
Insights from Cassini distant radiometry observations of Titan’s surface
 3,4,
3,4,- 1Laboratoire Atmospheres Observations Spatiales (LATMOS), Planéto, France (robisul.dr@protonmail.com)
- 2Institut Universitaire de France (IUF), France
- 3IPGP, CNRS, Paris, France
- 4Department of Astronomy, Cornell University, Ithaca, NY, USA
- 5National Radio Astronomy Observatory, Socorro, NM, USA
- Introduction
During its 13 years of mission in the cronian system, Cassini performed 127 flybys of Titan. On board the spacecraft, the RADAR, operating as a (passive) radiometer, recorded the 2.2-cm thermal emission from the surface. All resolved radiometry observations were combined to build a global map of Titan's surface brightness temperature [4]. In the calibration process, this data was corrected to a common season and the possibility of diurnal signal was ignored. In this work, we focus on the unresolved radiometry observations of Titan as they represent an opportunity to search for potential seasonal and diurnal signatures. This data was acquired from long range i.e., in a configuration where the antenna beam footprint is commensurate or larger than Titan’s disk ([6], [11]). It has been reduced to compute Titan’s disk-integrated brightness temperature. 118 of them are available; they were collected for different sub-spacecraft points (Figure 1 (a)), at different local hours and epochs of the cronian year.
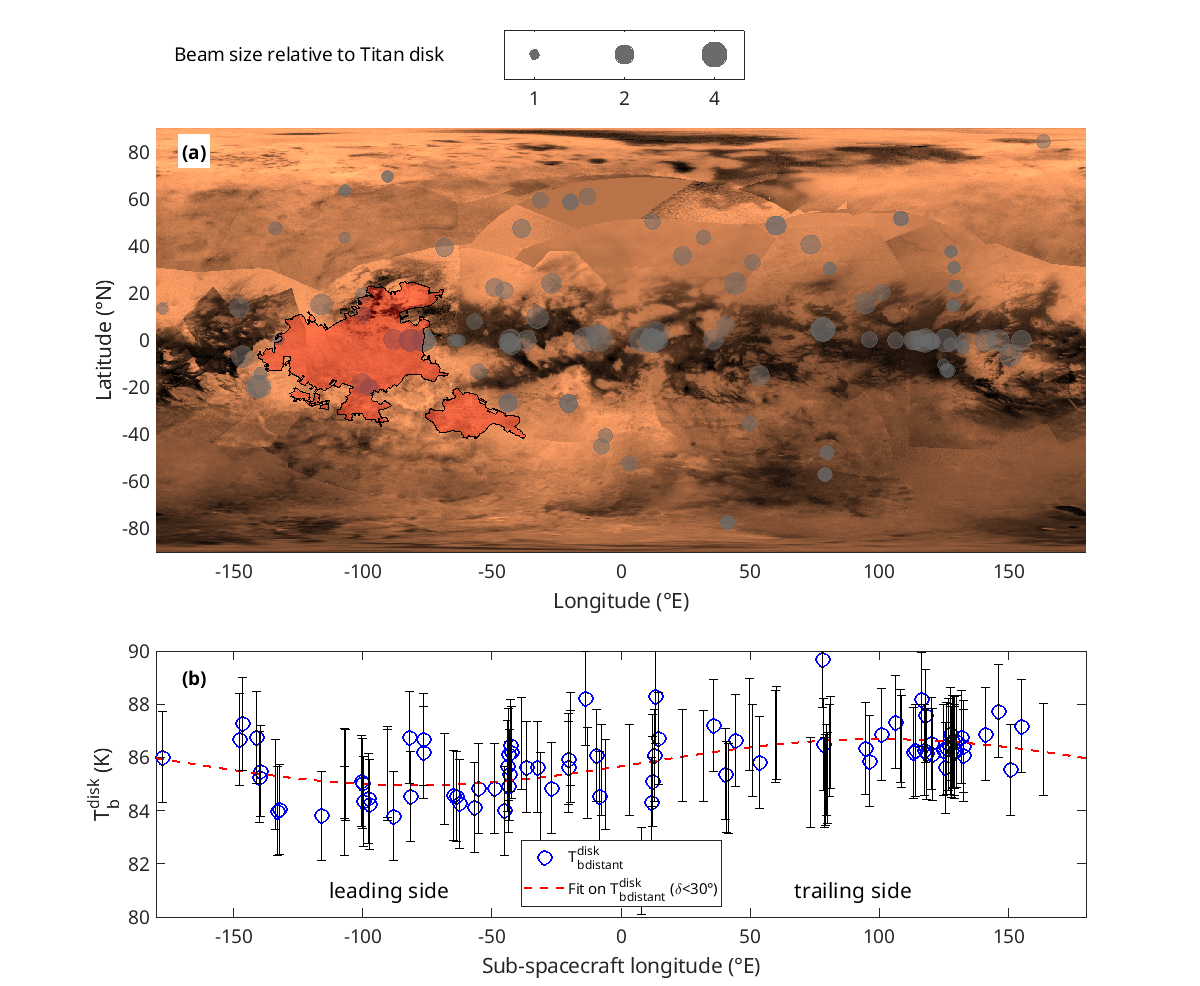
Figure 1: (a) ISS map of Titan’s surface showing the locations of the sub-spacecraft points of the 118 distant radiometry observations of Titan. Xanadu regio is highlighted in red. (b) Tbdisk as a function of Titan’s longitude as measured by the Cassini radiometer.
- Longitudinal variations
Titan’s surface brightness temperature depends both on the surface emissivity and the effective physical temperature of the surface. At first order, this latter can be regarded as nearly constant and predictable. The main source of variations in the disk-integrated brightness temperature Tbdisk derived from distant radiometry observation is related to spatial variations of the surface emissivity. Indeed, Tbdisk latitudinal variations clearly show the signature of Xanadu, a large-scale low emissivity/radar-bright feature on the leading side of the satellite ([12], [1], [13], [7]) (Figure 1 (a)).When 25% of the observable disk contains Xanadu, the disk-integrated brightness temperature is reduced by more than 1 K. For the study of Tbdisk variations as a function of time (hour or season), we therefore only consider data that were acquired on disk containing less than 1% of Xanadu.
- Monitoring seasonal changes
Cassini arrived at Saturn as it was in the late northern winter (July 2004) and the mission ended just after the northern summer solstice (Sept. 2017). Distant radiometry observations were collected regularly all along the 13 years of observations of the Cassini mission that is during half a cronian year. As such, they provide a valuable dataset to investigate the seasonal variations of Titan’s surface temperature, if any. As expected no significant variations are observed for data centred on the equatorial regions, where the seasonal effects are limited. Figure 2 displays the Tbdisk of observations centred on Titan’s poles as a function of the epoch of the year. It clearly shows the warming of the north pole and the cooling of the south one, consistent with CIRS observations [5]. This implies that the radiometer probing depth is smaller than the seasonal thermal skin depth. By comparison to a radiative transfer model in a wet sand sub-surface, we estimate the probing depth to be of at most a few meters. The comparison of the CIRS and RADAR datasets also allow to better estimate the disk-integrated emissivity of Titan’s surface: 0.93±0.01 excluding Xanadu, and 0.92±0.01.

Figure 2: Disk-integrated brightness temperature of Titan’s poles as a function of time derived from CIRS and Cassini RADAR radiometer measurements. Measurements in the southern hemisphere are plotted in blue, and in red for the northern.
- Absence of diurnal signal
From the analysis of CIRS dataset, Cottini et al., 2012 [3] report a diurnal signal of 1-1.5K indicative of a thermal inertia of 300-600MKS. However, Cassini distant radiometry observations show no specific variations with the local hour of the sub-spacecraft point. This implies that the radiometer probe deeper depths than the diurnal thermal skin depth. By comparison to a radiative transfer model in a wet sand subsurface, we estimate the probing depth to be of at least a few tens of centimeters.
- Comparison with Earth-based observations
Cassini distant radiometry observations can be directly compared to ground-based observations. In particular, the disk-integrated brightness temperature of Titan was measured at 3.5 cm from the Very Large Array (VLA) radio-telescope in 1992 ([8], [2]). This dataset was used to produce the light curve displayed in Figure 3 which exhibits a puzzling minimum of Tbdisk around 0° longitude, therefore shifted by more than 90° with respect to the location of Xanadu and the light curve derived from Cassini data. This discrepancy will be discussed during the presentation as well as comparison with other earth-base observations.

Figure 3: Light curve at 2.2 and 3.5 cm measured respectively by Cassini and the VLA.
- Emissivities in Saturn's system
Among all major cronian satellites, Titan exhibits the highest emissivity. When the innermost moons interacting with Saturn's E-ring have present lower emissivities (0.5-0.8), Titan's is much closer to Pheobe and Iapetus trailing values (0.8-0.9) suggesting a near sub-surface where the ice is less present (see Le Gall et al., this conference, [10]).
- Conclusions
With the good time and spatial sampling that Cassini distant observation provides, we monitored the regional and temporal variations of Tbdisk on Titan, giving insights on its surface and the interaction with its atmosphere.
- Acknowledgments
We sincerely thank the Institut Universitaire de France for funding this work.
- References
[1] Barnes et al., (2005). Science, DOI:10.1126/science.1117075.
[2] Butler and Gurwell, (2004). AAS/DPS
[3] Cottini et al., (2012). Planetary and Space Science, DOI:10.1016/j.pss.2011.03.015.
[4] Janssen et al., (2016). Icarus, DOI:10.1016/j.icarus.2015.09.027.
[5] Jennings et al., (2016). The Astrophysical Journal, DOI:10.3847/2041-8205/816/1/L17.
[6] Le Gall et al., (2014). Icarus, DOI:10.1016/j.icarus.2013.06.009.
[7] Lemmon et al., (1993). Icarus, DOI:10.1006/icar.1993.1074.
[8] Muhleman et al., (1993). 25:25.01. AAS/DPS
[10] Ostro et al., (2006). Icarus, DOI:10.1016/j.icarus.2006.02.019.
[11] Ostro et al., (2010). Icarus, DOI:10.1016/j.icarus.2009.07.041.
[12] Radebaugh et al., (2011). Icarus, DOI:10.1016/j.icarus.2010.07.022.
[13] Smith et al., (1996). Icarus, DOI:10.1006/icar.1996.0023.
How to cite: Sultana, R., Le Gall, A., Bonnefoy, L., and Butler, B.: Insights from Cassini distant radiometry observations of Titan’s surface, Europlanet Science Congress 2022, Granada, Spain, 18–23 Sep 2022, EPSC2022-807, https://doi.org/10.5194/epsc2022-807, 2022.