
On the rotation of the dwarf planet (136199) Eris
 1,1,5,2,4,4,4,4,5
- 1Konkoly Observatory, Research Centre for Astronomy and Earth Sciences, Eötvös Loránd Research Network (ELKH), Budapest, Hungary (szakats.robert@csfk.org)
- 2Max-Planck-Institut für extraterrestrische Physik Giessenbachstrasse, 85748 Garching, Germany
- 3ELTE Eötvös Loránd University, Institute of Physics, Budapest, Hungary
- 4Instituto de Astrofı́sica de Andalucı́a (CSIC), Glorieta de la Astronomı́a s/n, 18008-Granada, Spain
- 5Eötvös Loránd University, Pázmány Péter sétány 1/A, H-1171 Budapest, Hungary
Eris is currently the most massive known dwarf planet in the Solar system, it has one known satellite, Dysnomia (Brown & Schaller 2007; Holler et al. 2020). There have been several attempts trying to identify the rotation period of Eris from visible ground based measurements which resulted in a wide range of possible values (Duffard et al., 2008). Here we present some new light curve data of Eris, taken with ∼1m-class ground based telescopes, with the GROND instrument at the 2.2m MPG/ESO telescope La Silla, and also with the Transiting Exoplanet Survey Satellite (TESS).
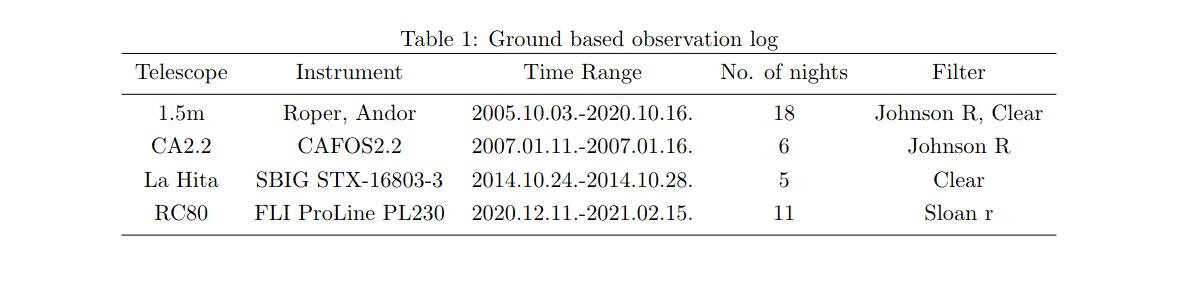
Observations of Eris with GROND were made in 3 nights in August 2010. Auxiliary ground based photometry data of Eris from five telescopes were obtained in irregular intervals between 2005 and 2020 (see table 1.) TESS observed Eris in Sector 30 with its Camera 1 and CCD 3. A significant portion of the light curve data had to be excluded due to Eris’ encounter with nearby background sources which left a dominant feature in the background-subtracted image. We note that due to the limited length of the TESS light blocks (2.3 d and 6.6 d) it was not possible to detect light curve periods in to order or close to the orbital period (15.78 d).
For most of the ground-based measurements we used our night-averaged values for the 1.5m, La Hita and CA2.2m data), except for the GROND measurements, for which we used the all the individual data points. In addition, we also considered previously published data, including ground-based data from Carraro et al., 2006 and Duffard et al., 2008, and the SWIFT satellite data from Roe et al., 2008.
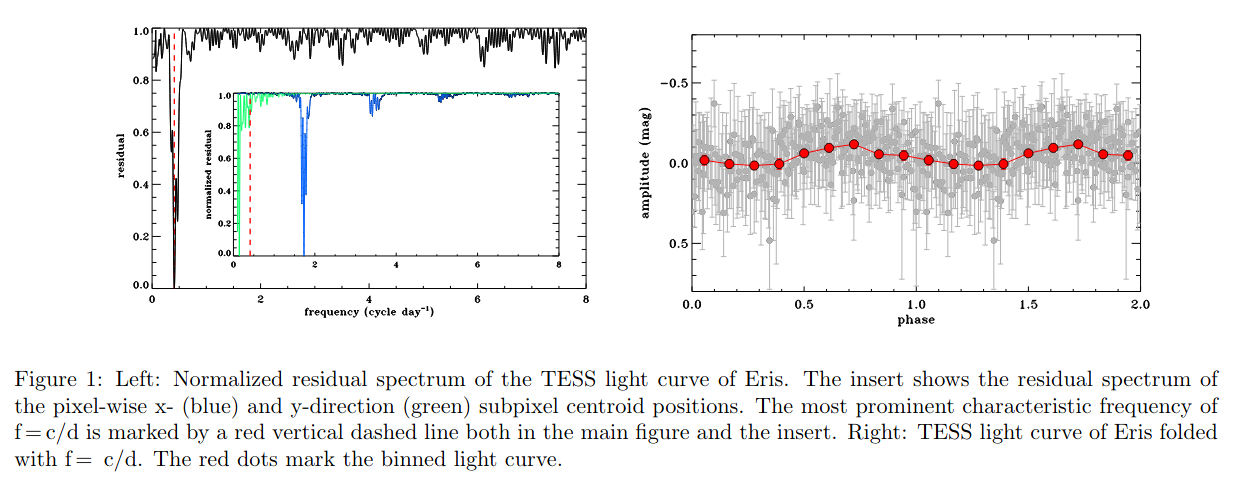
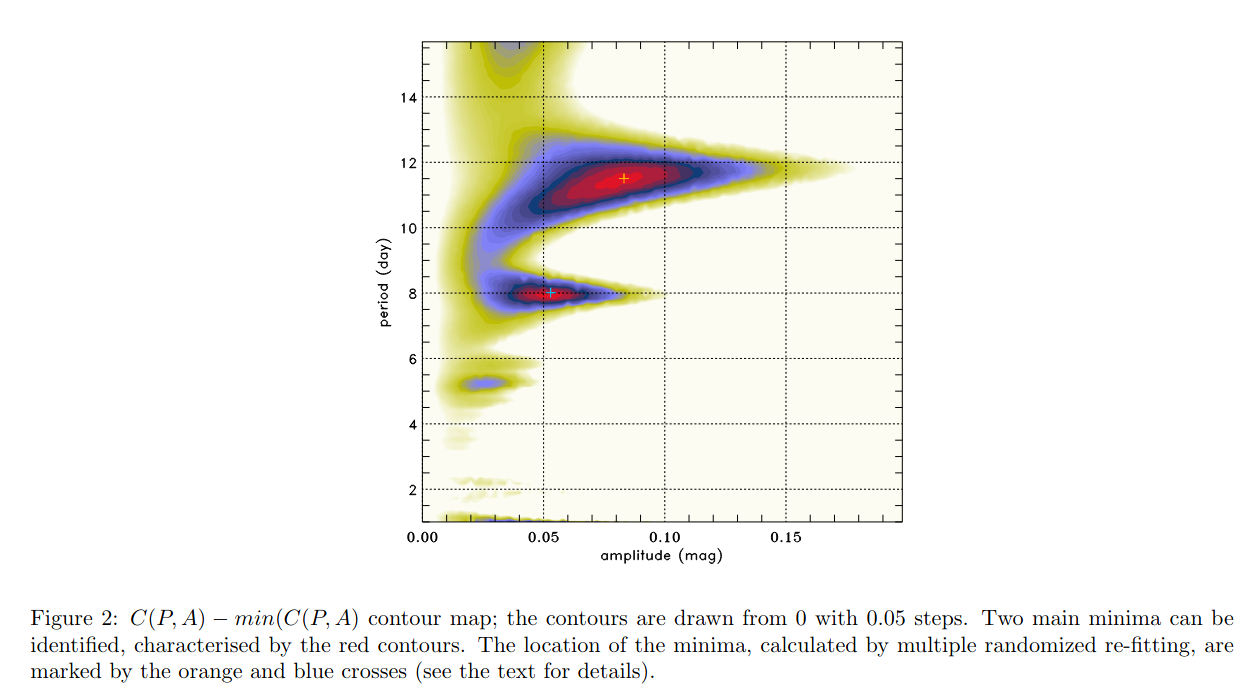
We assumed that i) the light curve amplitude is the same in any of the photometric bands used and ii) the light curve can be described by a simple sinusoidal variation. With these assumptions each model light curve can be described by four parameters: a light curve amplitude, period, phase-shift, and an offset from the photometric zero point. We allowed a different offset for each measurement block even if the data were taken by the same instrument and filter combination (1.5m measurements) due to the year-long gaps between the measurement blocks. We chose an amplitude A and period P, and determined the best fitting light curve phase using a Levenberg–Marquardt minimization algorithm. We expect that the best-fitting period-amplitude values provide the lowest C(P,A) values. We searched the period range P ∈ [1d, 15.88 d], where 15.88 d is the orbital period of Dysnomia, and it would correspond to a synchronised rotation. The C(P,A) contour map shows two minima, one at P ≈ 8 h, and A ≈ 0.05, and another at P ≈ 11.5 h, and A ≈ 0.08. To check the robustness of this result, we repeated the process by modifying the photometric data points by adding a random value with normal distribution and repeating the fitting process several times for the whole data set. The same two minima popped up in all cases. TESS data favours a rotation period of 59.420±0.527 h (See Figure 1.), while ground based data is more compatible with a synchronous or nearly synchronous rotation (See Figure 2.).
We inspected the colours calculated from the GROND photometry and compared our results to previous values from the literature (Table 2). The optical colours (B-V, V-R, R-I) are in good agreement with previous colours, but the J-H colour from GROND is different from the ones in the literature. Also, we can see a big scatter in those. (See Table 2.)
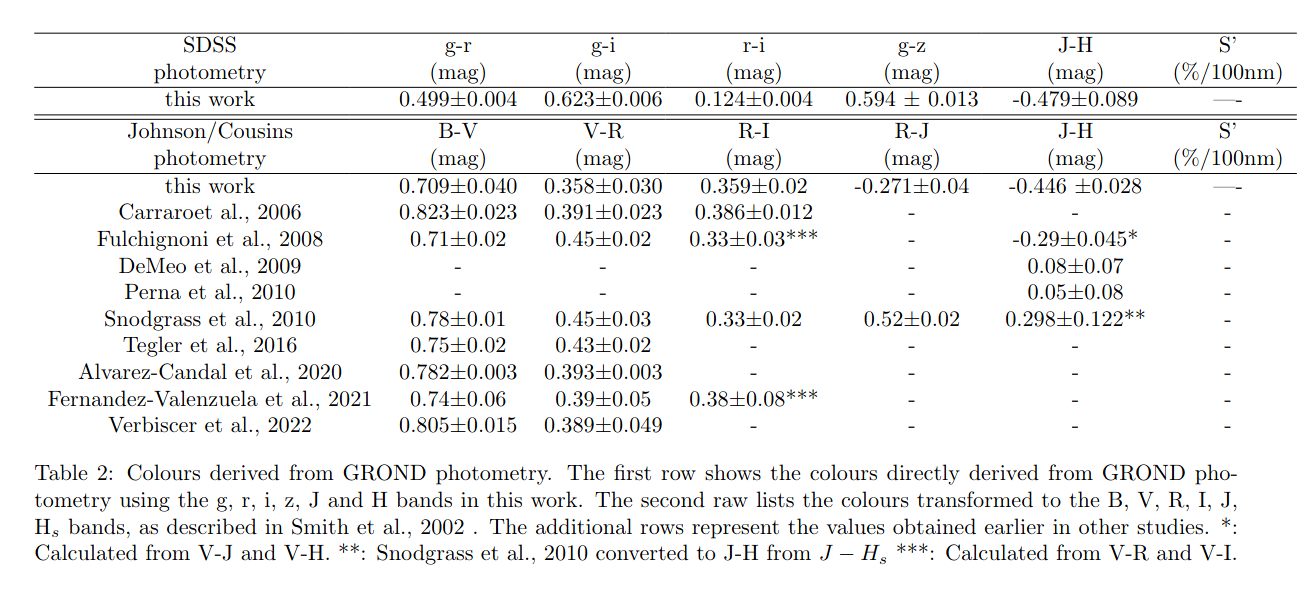
One possible explanation can be, that there is a big CH4 feature on the surface of Eris, which has strong absorption lines in H band, and it can change the NIR colour, but not the optical ones. To confirm this, more long-term optical and NIR measurements are needed. Finally, we use the simple tidal evolution code by Hastings et al. (2016) to calculate the evolution of the satellite orbit (only the semi-major axis in this approximation) and the spin evolution of Eris and Dysnomia. Although the spin period of Eris is not well defined yet, it is an interesting question whether the possible rotation periods of Eris – ranging from a few hours to the orbit-synchronous state – are feasible in terms of tidal evolution, using the current knowledge on the system components.
How to cite: Szakáts, R., Kiss, C., Pál, A., Müller, T., Greiner, J., Santos-Sanz, P., Marton, G., Ortiz, J. L., Morales, N., Duffard, R., and Sági, P.: On the rotation of the dwarf planet (136199) Eris, Europlanet Science Congress 2022, Granada, Spain, 18–23 Sep 2022, EPSC2022-824, https://doi.org/10.5194/epsc2022-824, 2022.