Elastic Thickness and Heat Flux Variations on Mercury from Thermal Evolution Modeling
- DLR, Institute of Planetary Research, Berlin, Germany
Introduction
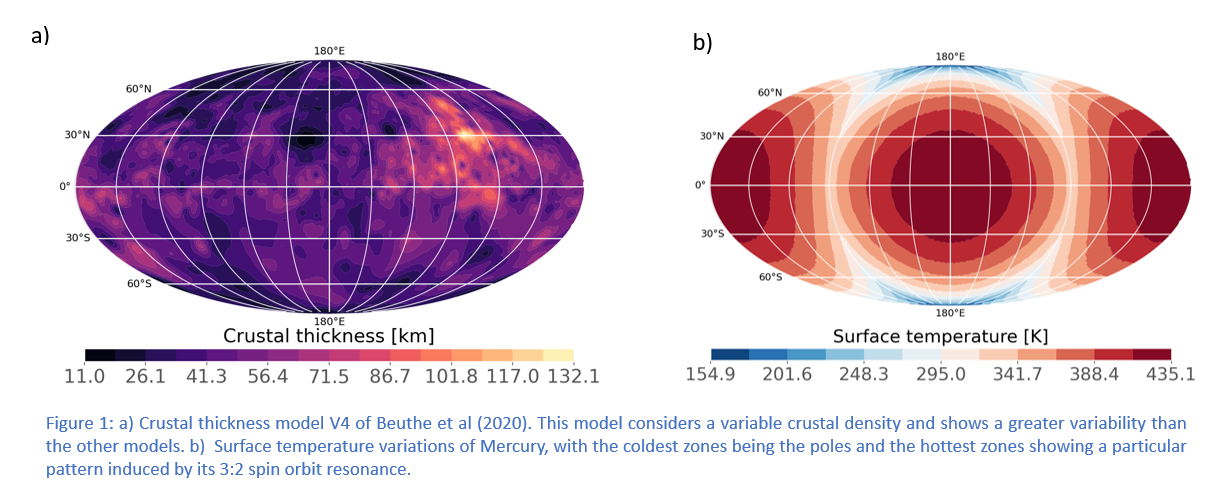
Because of its very low obliquity, Mercury experiences significant surface temperature variations between its polar region and its equatorial region (Margot et al., 2012). On the other hand, its atypical 3:2 spin-orbit resonance also leads to longitudinal temperature variations (Siegler et al 2013). The combination of these effects creates a peculiar surface temperature distribution with equatorial hot and warm poles, and cold poles at the geographic poles of the planet. Models that considered the insolation pattern were found compatible with the low-degree shape and geoid from MESSENGER (Tosi et al., 2015). The models of Tosi et al. (2015) showed that the insolation pattern imposes a long wavelength thermal perturbation throughout the mantle, whose temperature distribution is strongly correlated with the surface temperature variations.
Lateral variations of the crustal thickness can also affect the temperature distribution of the lithosphere and mantle as it was suggested for Mars (Plesa et al., 2016, 2018). Crustal thickness models for Mercury have been calculated based on the MESSENGER gravity and topography data, and largely depend on the assumed density difference between the crust and mantle. Recently, Beuthe et al. (2020) proposed several crustal thickness models using either a constant crustal density or a variable one, as informed by the surface chemical composition and further assuming that the crustal composition does not change significantly with depth.
In this study, we investigate the effects of surface temperature and crustal thickness variations on the thermal evolution of the interior of Mercury. We compute the surface and CMB heat flux patterns, as well as that of the elastic lithosphere thickness and compare our results to local elastic thickness estimates.
Model
We combine the geodynamical code GAIA (Hüttig et al., 2013) with the surface temperature variations and crustal thickness data similar to Plesa et al., (2016). All simulations are done in a full 3D spherical geometry, use the extended Boussinesq Approximation, and consider core cooling and radioactive decay. The pressure- and temperature-dependent viscosity follows an Arrhenius law of diffusion creep.

We use a pressure- and temperature-dependent thermal expansivity and conductivity in the mantle (Tosi et al., 2013). The thermal conductivity of the crust is set to 1.73 W/m/K, a value based on a crustal conductivity of 2 W/m/K that additionally takes into account the effect of an insulating, 5-km-thick megaregolith layer.
The crust is enriched in heat producing elements (HPEs) by a factor λ compared to the primitive mantle, for which we assume a chondritic HPE abundance. We test two crustal thickness models of Beuthe et al. (2020), namely model U0 with a homogeneous crustal density of 2957 kg/m3 and an average crustal thickness of 35 km, and model V4 (Fig. 1a) with a variable crustal density and an average crustal thickness of 45 km.
Additionally, our models include surface temperature variations (Fig. 1b) following the model of Vasavada et al. (1999).
Results
We model the entire evolution of Mercury to determine the variations of core-mantle boundary and surface heat flux, as well as the elastic lithosphere thickness at different times.
Our simulations show that the combined effect of surface temperature, crustal thickness variations and the enrichment of the crust in HPEs can significantly affect the CMB and surface heat flux as well as the elastic lithosphere thickness of Mercury.

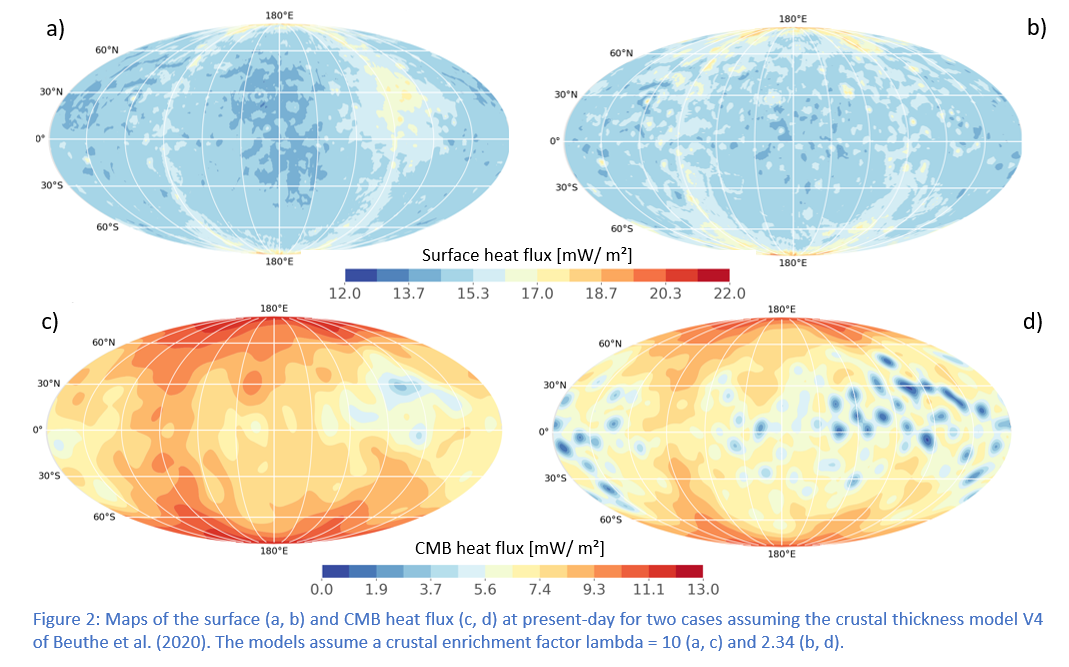
Fig. 2 shows the results of two simulations employing the V4 crustal model of Beuthe et al. (2020). Here we can observe both the effect of the surface temperature variations and of the crustal enrichment in HPEs on the surface and CMB heat flux Mercury at present day. The long-wavelength pattern of the heat flux follows the distribution of Mercury’s surface temperatures. Areas with a high heat flux correspond to the cold poles of Mercury, while smaller heat flux values are attained in the hot poles regions. For a high crustal enrichment in HPEs, the high Mg region, which is characterized by a thick crust in the V4 crustal thickness model, becomes clearly visible (Fig 2a, c). In this case, we observe a clear anti-correlation between the CMB heat flux and the surface heat flux at around 30°N and 240°-330°E.

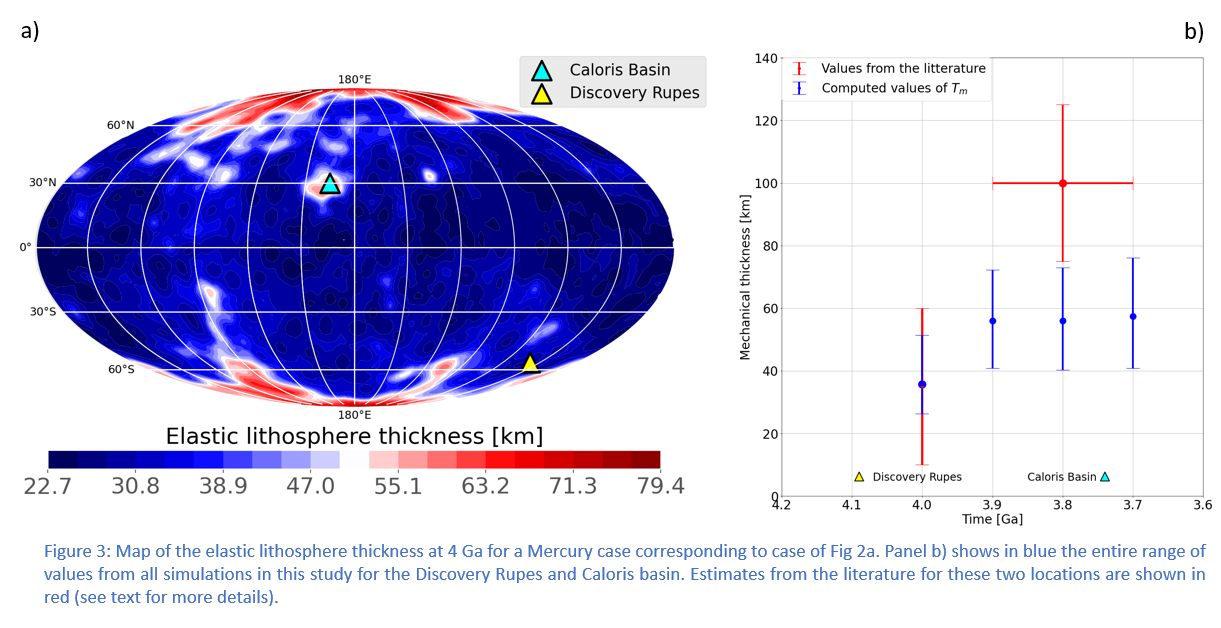
In addition to the surface and CMB heat fluxes, our models calculate local estimates of elastic lithosphere thickness between 4.0 and 3.8 Ga as in Tosi et al. (2015). Here we focus on two locations, i.e., Caloris basin and Discovery Rupes, for which elastic thickness estimates are available in the literature (Watters et al., 2002; Nimmo & Watters 2004; Phillips et al., 2018). Fig. 3a shows the elastic lithosphere thickness at 4 Ga obtained from one of our models and the location of the two estimates that were used here. While model values show a good agreement with the literature estimates of the Discovery Rupes, they are smaller than the estimates available for the Caloris basin (Fig. 3b).
Discussion and conclusion
Our models show that the surface heat flux of Mercury is chiefly affected by its peculiar surface temperature distribution, but the crustal thickness pattern and the distribution of HPEs between the mantle and crust can introduce additional variations. Models show that elastic thickness values for Discovery Rupes are compatible with estimates from previous studies, while systematically lower values are obtained for Caloris basin. These discrepancies reflect uncertainties in elastic thickness estimates and model values, but also in the Caloris formation age. The latter is important to estimate time at which the elastic thickness estimates are representative for the thermal state of the lithosphere.
Future data from the BepiColombo mission (Benkhoff et al., 2021) will provide a better resolution for the gravity and topography of Mercury, as well measurements of its surface composition. This will help to improve our geodynamical models and in turn constrain Mercury’s thermal evolution. Furthermore, these data could be used to provide additional estimates of the elastic lithosphere thickness and the time of formation of the associated geological features that in turn can be used to constrain the thermal state of Mercury through time.
How to cite: Fleury, A., Plesa, A.-C., Tosi, N., Walterova, M., and Breuer, D.: Elastic Thickness and Heat Flux Variations on Mercury from Thermal Evolution Modeling, Europlanet Science Congress 2022, Granada, Spain, 18–23 Sep 2022, EPSC2022-829, https://doi.org/10.5194/epsc2022-829, 2022.

