
 1,1,2,1,1
- 1Université Paris Cité, Institut de physique du globe de Paris, CNRS, F-75005 Paris, France
- 2Geosciences Barcelona, GEO3BCN – CSIC, Barcelona, Spain
NASA’s mission, InSight (Interior Exploration using Seismic Investigations, Geodesy and Heat Transport), has been conducting seismic observation since January 2019 (Banerdt et al. 2020; Lognonné et al. 2020; Giardini et al. 2020). Recently InSight has recorded a magnitude-5 event, S1222a, and in the seismic recording, Mars Quake Service identifies both Rayleigh and Love waves. Based on the two surface waves, we study the Martian subsurface radial anisotropy. We measure the group and phase velocities of the two surface waves (Figure 1), and then apply Markov chain Monte Carlo inversion to the measurement. Inversion of the Rayleigh- and Love-wave velocities provides the 1D Sv- and Sh-wave velocity models (Vsv and Vsh), respectively. The difference between Vsv and Vsh indicates the radial anisotropy distribution in depth and aids us in investigating the geological structure and/or mineralogy of the Martian subsurface.
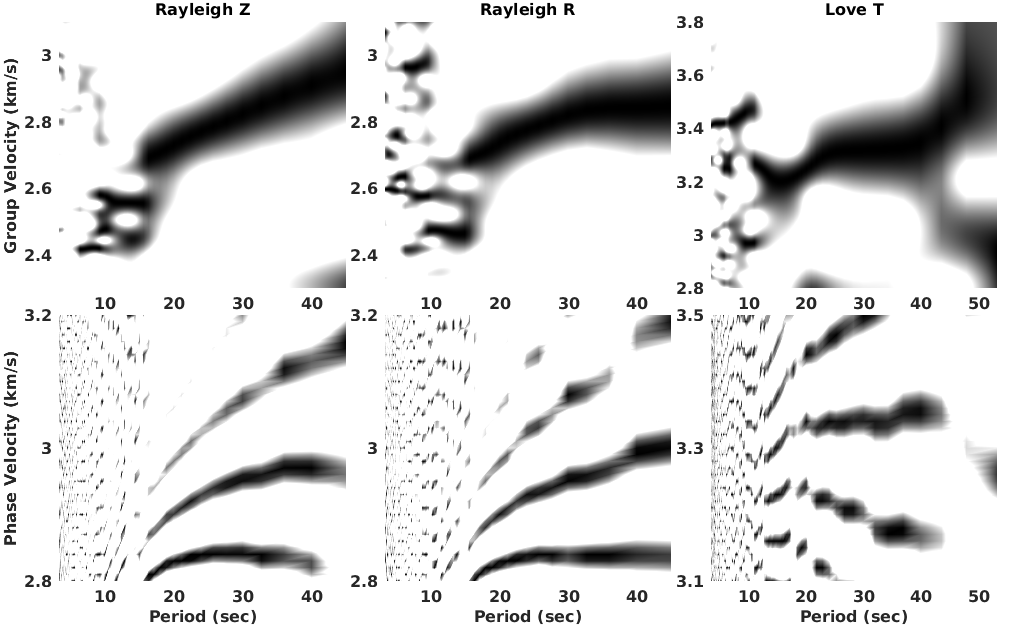
Figure 1. The Rayleigh- and Love-wave group and phase velocity measurement (black trends) of S1222a. The Rayleigh-wave measurement is from the vertical (Z) and radial (R) component data; the Love-wave measurement is from the transverse component (T). Our group and phase velocity measurement algorithms are from Bensen et al. (2007) and Yao et al. (2006), respectively. The multiple trends in the phase-velocity subplots are due to the cycle skipping in the phase-velocity measurement.
References:
Bensen, G. D., et al. "Processing seismic ambient noise data to obtain reliable broad-band surface wave dispersion measurements." Geophysical journal international 169.3 (2007): 1239-1260.
Banerdt, W. Bruce, et al. "Initial results from the InSight mission on Mars." Nature Geoscience 13.3 (2020): 183-189.
Giardini, Domenico, et al. "The seismicity of Mars." Nature Geoscience 13.3 (2020): 205-212.
Lognonné, Philippe, et al. "Constraints on the shallow elastic and anelastic structure of Mars from InSight seismic data." Nature Geoscience 13.3 (2020): 213-220.
Yao, Huajian, Robert D. van Der Hilst, and Maarten V. De Hoop. "Surface-wave array tomography in SE Tibet from ambient seismic noise and two-station analysis—I. Phase velocity maps." Geophysical Journal International 166.2 (2006): 732-744.
How to cite: Xu, Z., Stutzmann, E., Lognonné, P., Schimmel, M., Montagner, J.-P., and Kawamura, T.: Radial anisotropy from surface-wave observation in Mars, Europlanet Science Congress 2022, Granada, Spain, 18–23 Sep 2022, EPSC2022-863, https://doi.org/10.5194/epsc2022-863, 2022.