
Photometry of rock-rich surfaces on the Moon
 1,2,
1,2,- 1Westfälische Wilhelms-Universität Münster, Institut für Planetologie, Münster, Germany (rachael.marshal@uni-muenster.de)
- 2Image Analysis Group, Technische Universität Dortmund, Germany
- 3Institute of Astronomy of V.N.Karazin Kharkiv National University, Sumska 35, 61022, Kharkiv, Ukraine
Introduction
The study and investigation of local scale geological features (boulders and boulder fields) of planetary/asteroid surfaces can provide insight on the evolution of the regolith and the contribution of various processes to their formation. Numerous studies have employed photometric modelling to study the surface properties of the lunar regolith on a regional and local scale (e.g., [1], [2], [3]). In this study we characterize the roughness exhibited by rock rich fields. We do so by employing a Normalized Logarithmic Phase Ratio Difference (NLPRD) metric to measure and compare the slope of the phase curve (reflectance versus phase angle) of a rock-rich field to a rock-free field. We calculate the NLPRD on model derived synthetic images of rock-rich fields and compare it to the NLPRD calculated from fully resolved rock fields in the LROC/NAC data.
Method
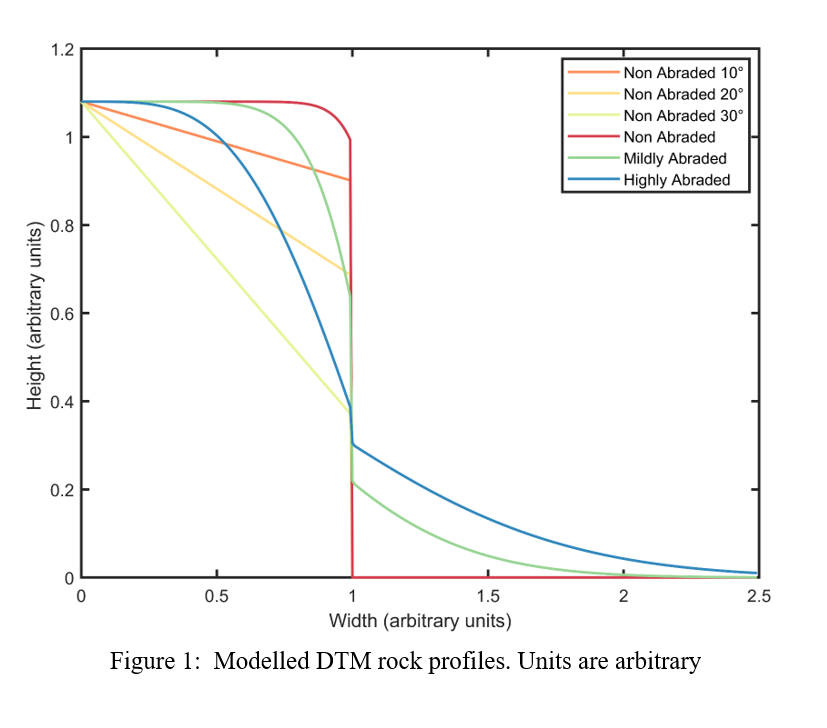
The first step in our approach consists of the construction of a set of digital terrain models (DTMs) representative of the most probable geologic contexts. The contexts are concerned with the rock and debris aprons shape and reflect the abrasion stage of the rock – Non-Abraded (flat top), Non-Abraded (angular), Mildly and Highly Abraded (Fig 1). Two size frequency distributions of rocks are used as input for the purpose of testing its effect on the resultant NLPRD
The synthetic DTMs are then converted to a synthetic reflectance image by utilising the Hapke model [4].
The NLPRD is then calculated as :

where F and B denote the mean reflectance of reference rock free area and rock rich area (boulder field), respectively. In the case of the synthetic images the mean reflectance is the spatially averaged model reflectance. In the case of the NAC data, the mean reflectance is calculated by averaging the I/F reflectance of each NAC pixel within each digitised polygon around a rock rich field (B) and a region with no resolved rocks(F). The selection the NAC areas is presented further below. P2 and P1 refer phase angles such that P2>P1. Effectively, the and are phase ratio images. We consider phase ratios is two configurations. Configuration 1 is a ratio of images acquired at the same incidence angle but varying emission angle – we address configuration 1 as emission ratio. Configuration 2 is a ratio of images acquired at varying incidence angle, but the emission angle is kept at nadir – we address configuration 2 as incidence ratio.
Results
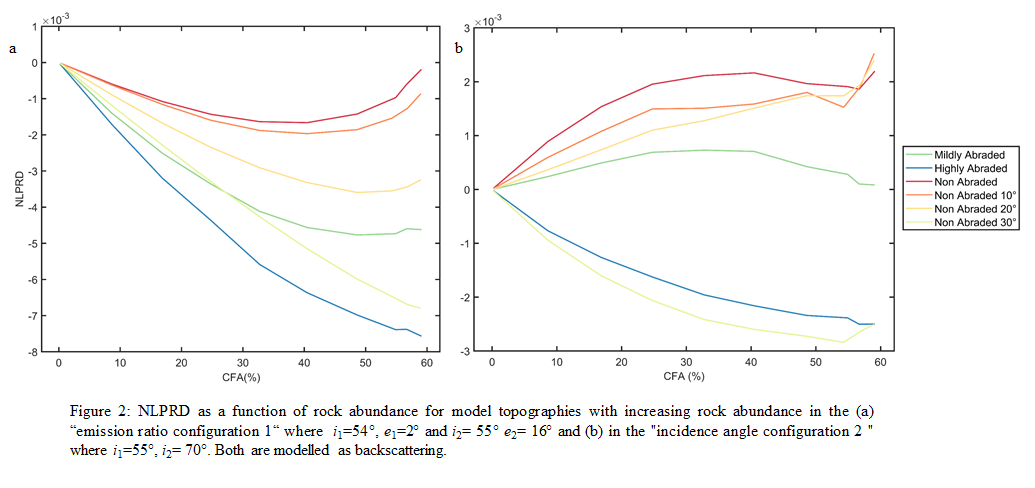
The variations in model derived NLPRD as a function of rock abundance for both the emission and incidence ratio is shown in Figure 2. From figure 2a and 2b , we see that rocks do not exhibit uniform photometric behaviour the phase ratio configuration. The abundance and morphology of rocks contribute strongly to how rough it appears in reference to a rock free surface. Relatively high values of roughness can be achieved by modelling non-abraded tall rocks whereas for the same height, the tilting on the top of the rock consistently produces low roughness and much lower than the roughness of the rock-free field in both configurations.
When comparing the model derived NLPRD to the NLPRD calculated from the LROC NAC data, in both configurations, the roughness of some boulder fields are explained by the modelled scenarios presented in Figure 2 whereas the roughness of some boulder fields are higher than the modelled lines. In the case of configuration 2, this mismatch is partially due to the regional topographic slopes, which is not an issue in configuration 1 as we use topographically corrected data from [6]. Overall, we find that with the addition of more parameters, the model lines explain the data to a greater extent, however this is often accompanied by additional complexity. Model lines are able to explain the observed roughness of the boulder fields in the NAC data when a combination of a double rock arrangement is coupled with an increase in macroscopic roughness of the rocks themselves (ϴb) or with a decrease in rock single scattering albedo(w). From the NLPRD of boulder fields in the vicinity of North Ray crater, we find that boulder fields on the west are rougher than those on the south east. This pattern might be indicative of spatial heterogeneity in the ejecta blanket ([5], [6]).
Conclusive remarks
From our study we find that rock morphology (shape) and thus nature of rocks creates different photometrical roughness or no photometrical roughness relative at all to a rock free surface. Rock morphology and rock size frequency distribution have the largest effects on the computed NLPRD.
Rock fields that are visually and photo-geologically indistinguishable have different photometric roughness characteristics in image ratios. We find that roughness of actual rock fields can be higher or lower than the model derived roughness, which might be due to the exclusion of additional parameters such as the macroscopic roughness or the modification of parameters such as the single scattering albedo of rock fields.
References:
[1] Watkins R.N. et al. (2019) JGR-P, 124, 2754–2771 [2] Sato et al. (2014) JGR-P, 119,1775-1805 [3] Lin et al. (2020) A&A,638 [4] Hapke (2012) Theory of Reflectance and Spectroscopy [5] Mustard el al. (2011) JGR-P, 116 [6] Velichko et al. (2020) PSS, 193
How to cite: Marshal, R. M., Rüsch, O., Wöhler, C., Wohlfarth, K., and Velichko, S.: Photometry of rock-rich surfaces on the Moon , Europlanet Science Congress 2022, Granada, Spain, 18–23 Sep 2022, EPSC2022-871, https://doi.org/10.5194/epsc2022-871, 2022.