
Using Phase Curves from ATLAS to Search for Cometary Activity in the Solar System
 1,
1,- 1Queen's University Belfast, School of Maths and Physics, Astrophysics Research Centre, United Kingdom of Great Britain – Northern Ireland (mdobson04@qub.ac.uk)
- 2Planetary Science Institute, 1700 East Fort Lowell Rd., Suite 106, Tucson, AZ 85719, USA
- 3Department of Astronomy, University of Virginia, P.O. Box 400325, Charlottesville, VA 22904-4325, USA
- 4University of Hawaii Institute for Astronomy, 2680 Woodlawn Dr., Honolulu, HI 96822
- 5Institute for Astronomy, University of Hawaii, 2680 Woodlawn Drive, Honolulu, HI 96822
The phase curve of a small Solar System object shows the change in the object’s reflectance at different Sun-object-observer (phase) angles, and the shape of the phase curve is determined by the physical properties of the object’s surface. Analysing phase curves of small Solar System objects such as Kuiper belt objects (KBOs), Centaurs, and inert Jupiter-family comets (JFCs) can also probe the composition and regolith structure of their surfaces, and by comparing these across populations of objects, can reveal possible evolutionary connections between them.
The phase curve of an object can be significantly altered from its nominal shape if the object has undergone epochs of cometary activity during the time across which observations were taken. Furthermore, Centaur activity takes the form of outgassing in between long periods of quiescence, differing significantly from the activity exhibited by JFCs, which is more continuous and strongly coupled to heliocentric distance. As a result, Centaur activity may be difficult to identify from their phase curves if there are large time-intervals between observations. However, if observations are taken at sufficiently high cadence to isolate these outbursts, phase curves can be used to detect and analyse cometary activity out to distances where any coma may not be visible to Earth-based observations. This technique can help shed light on the mechanism responsible for the activity exhibited by Centaurs, which is presently not fully understood, and which is also an important step in understanding cometary evolution in the Solar System.
Obtaining such high cadence observations over multiple apparitions for phase curve analysis is difficult to achieve due to limited availability of telescope observation time, the large baseline of observations required, and the challenges of ground-based observing (poor weather and the limited observability of targets throughout the year). To circumvent these difficulties, many previous studies of phase curves augment their datasets by collating photometry obtained from different sources (Alvarez-Candal et al., 2016; Ayala-Loera et al., 2018; Alvarez-Candal et al., 2019). These additional data are often obtained with heterogeneous methods of image processing and data analysis, which might introduce systematic errors in the resulting phase curve. The Asteroid Terrestrial-impact Last Alert System (ATLAS) survey (Tonry et al., 2018a,b) has accumulated serendipitous observations of several bright KBOs, Centaurs, and JFCs, having observed the visible sky over a 2-day cadence, to a limiting magnitude of ~19.5 in two wide-band filters since it first began observations in 2015. ATLAS offers an opportunity to study the phase curves of these objects populated with large datasets and thus use them to search for epochs of cometary activity.
Using data from the Haleakalā and Mauna Loa telescopes of the ATLAS 4-telescope survey, we analyse the phase curves of the bright KBOs, Centaurs, and JFCs visible to ATLAS with datasets large enough that we do not need to include additional data from potentially heterogeneous sources, thereby reducing potential systematic errors. Our sample of 18 bright KBOs, JFCs and Centaurs visible to ATLAS span semimajor axes of 5.7 au ≤ a ≤ 67.9 au, absolute magnitudes of −1.1 < HV < 13.3. Each object has on average 181 (c-filter) and 463 (o-filter) data points, exceeding the values of previous studies (Rabinowitz et al., 2007; Schaefer et al., 2009; Alvarez-Candal et al., 2016; Ayala-Loera et al., 2018; Alvarez-Candal et al., 2019), and which sample most of the phase angle range observable from Earth.
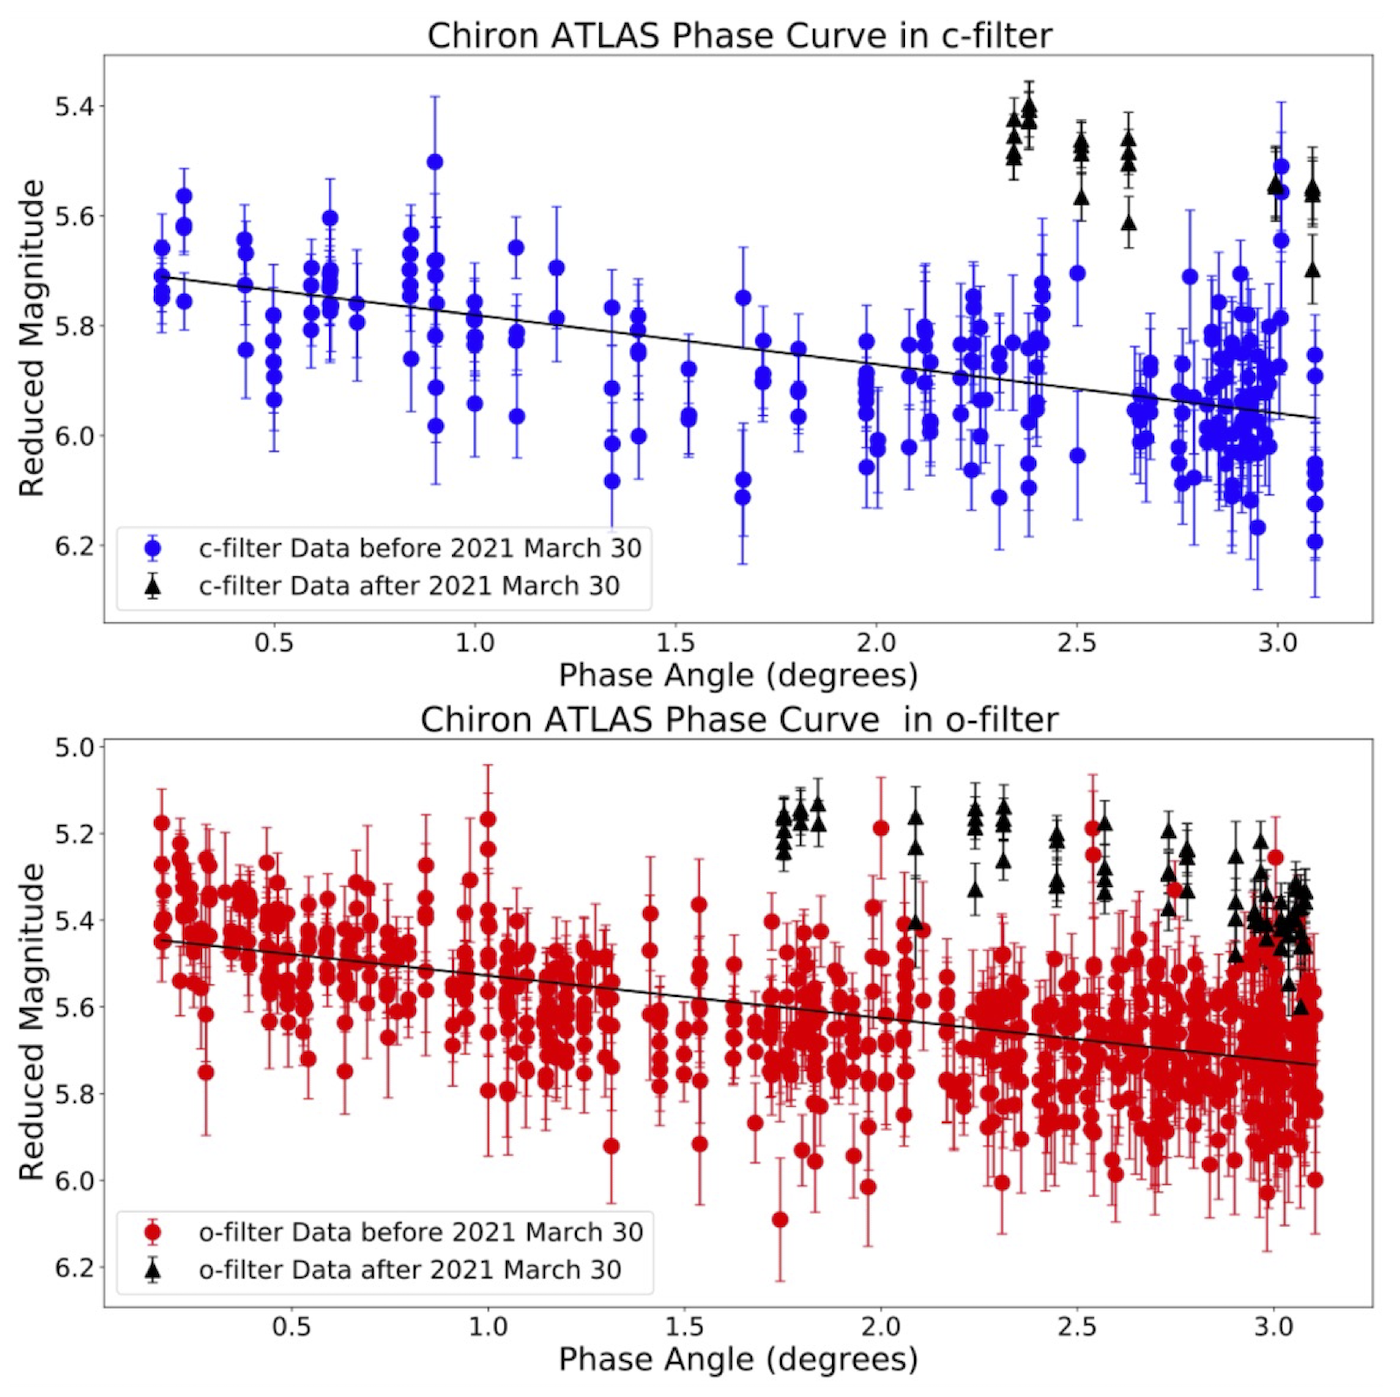
Figure 1: From Dobson et al. (2021), ATLAS Phase Curves of (2060) Chiron in c-filter (upper plot) and o-filter (lower plot), with data from most recent apparition indicated as black triangles. Black lines represent linear best fits to data.
We present our findings on using ATLAS phase curves with their advantage of unprecedentedly large datasets to search for instances of cometary activity exhibited by our sample of KBOs, JFCs and Centaurs since 2015. Notably, we discover a recent brightening of the Centaur (2060) Chiron (Dobson et al. 2021), as seen in Figure 1, which despite the lack of detected coma, is indicative of either an outburst or enhanced activity.
Acknowledgements
We made use of the ATLAS Forced Photometry Server to obtain our Centaur and KBO photometry. https://fallingstar-data.com/forcedphot/
This work has made use of data from the Asteroid Terrestrial-impact Last Alert System (AT- LAS) project. ATLAS is primarily funded to search for near earth asteroids through NASA grants NN12AR55G, 80NSSC18K0284, and 80NSSC18K1575; byproducts of the NEO search include images and catalogs from the survey area. The ATLAS science products have been made possible through the contributions of the University of Hawaii Institute for Astronomy, the Queen’s University Belfast, the Space Telescope Science Institute, the South African Astronomical Observatory (SAAO), and the Millennium Institute of Astrophysics (MAS), Chile.
References
Alvarez-Candal, A., Ayala-Loera, C., Gil-Hutton, R., et al. 2019, MNRAS, 488, 3035, doi: http://doi.org/10.1093/mnras/stz188010.1093/mnras/stz1880
Alvarez-Candal, A., Pinilla-Alonso, N., Ortiz, J. L., et al. 2016, A&A, 586, A155, doi: http://doi.org/10.1051/0004-6361/20152716110.1051/0004-6361/201527161
Ayala-Loera, C., Alvarez-Candal, A., Ortiz, J. L., et al. 2018, MNRAS, 481, 1848, doi: http://doi.org/10.1093/mnras/sty236310.1093/mnras/sty2363
Dobson, M. M., Schwamb, M. E., Fitzsimmons, A., et al. 2021,
Research Notes of the AAS, 5, 9, doi: http://doi.org/10.3847/2515-5172/ac26c9
Rabinowitz, D. L., Schaefer, B. E., & Tourtellotte, S. W. 2007, AJ, 133, 26, doi: http://doi.org/10.1086/50893110.1086/508931
Schaefer, B. E., Rabinowitz, D. L., & Tourtellotte, S. W. 2009, AJ, 137, 129, doi: http://doi.org/10.1088/0004-6256/137/1/12910.1088/0004-6256/137/1/129
Tonry, J. L., Denneau, L., Heinze, A. N., et al. 2018a, , 130, 064505, doi: http://doi.org/10.1088/1538-3873/aabadf10.1088/1538-3873/aabadf
Tonry, J. L., Denneau, L., Flewelling, H., et al. 2018b, ApJ, 867, 105, doi: http://doi.org/10.3847/1538-4357/aae38610.3847/1538-4357/aae386
How to cite: Dobson, M. M., Schwamb, M. E., Benecchi, S. D., Verbiscer, A. J., Fitzsimmons, A., Shingles, L. J., Denneau, L., Heinze, A. N., Smith, K. W., Tonry, J. L., Weiland, H., and Young, D. R.: Using Phase Curves from ATLAS to Search for Cometary Activity in the Solar System, Europlanet Science Congress 2022, Granada, Spain, 18–23 Sep 2022, EPSC2022-878, https://doi.org/10.5194/epsc2022-878, 2022.