Reference emission spectral data for astronomical observations
- 1Department of Experimental Physics, Comenius University in Bratislava, Slovakia (juraj.orszagh@uniba.sk)
- 2Physics Department, Leach Science Center, Auburn University, Auburn, AL, USA
In astronomy emission spectroscopy is widely used technique to study various objects. Although emission spectra of individual compounds are quite well known so composition of the studied body can be analysed the information on processes active in distant object can be encoded in the determined spectra as well. To decode such information the individual elementary processes need to be well understood. For example, in case of comets which are simple leftovers from the beginning of the Solar System understanding the connection between the coma and the comet’s nucleus is critical because observations rarely detect the nucleus directly, and its properties must often be inferred from measurements of the coma. As measurements of the coma do not necessarily represent the characteristics of the nucleus due to spatial, temporal and chemical evolution of the emitted material, projecting the coma observations back to the nucleus requires understanding of the processes in the coma. Within the Rosetta various instruments were used for spectroscopy. OSIRIS was equipped with several band filters that are commonly used in ground-based studies (Farnham et al. 2000). The spectroscopic measurements done within the Rosetta mission led to conclusion that electron-molecule processes play much more significant role than it used to be suspected in the past (Bodewits et al. 2016). This fact can be utilized to remotely study the plasma-chemical reactions active in distant objects. For example, the formation of excited OH by electron impact on H2O has an electron temperature threshold of 9.1 eV; H Ly-a has a threshold of 15.4 eV; and the production of OI 130.4 nm emission requires electron temperatures above 23.5 eV (Beenakker et al. 1974; Morgan & Mentall 1974). At electron temperatures below 10 eV, collisions with water molecules result in ro-vibrational excitation and energy is emitted in the IR range (Itikawa & Mason 2005). Electron impact emission thus provides a sensitive diagnostic probe for studying coma (Bodewits et al. 2019). The presence of spectral structures depends on reaching the threshold electron energy for specific transition. Emission cross sections that have thresholds of 10-100 eV – typical for the coma (Broiles et al. 2016) – depend strongly on electron impact energy. Knowledge of emission spectra and cross sections for electron-molecule reactions is critical for evaluation of physical-chemical properties of cometary coma based on spectroscopic observations. For thorough analysis of such studies a reliable database of reference spectra and emission cross sections must be available. Especially the availability of cross section data the Achilles’ heel since most of the values were determined only for a few individual energies but for successful application in models of atmospheres or comas they need to be known for wider range of energies.
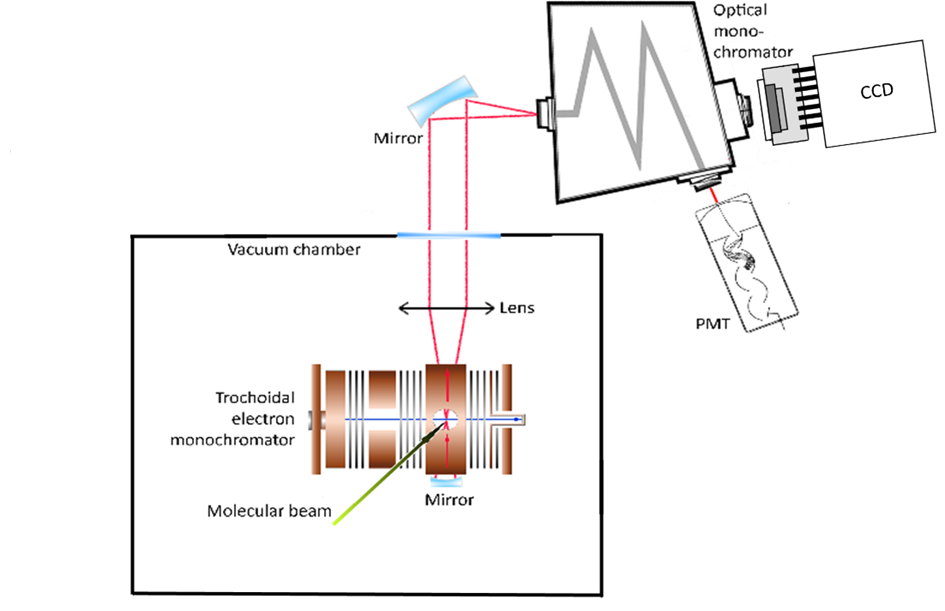
Such data can be provided by laboratory experiments studying individual electron-molecule interactions in various experimental configurations such as crossed beams of electrons and molecules. The example of the apparatus scheme aimed at studying electron induced excitation reactions is shown in the figure. The electron beam generated by trochoidal electron monochromator collides perpendicularly with molecular beam created by effusive capillary. Photons emitted by excited reaction products are guided out of the vacuum chamber into the spectrometer equipped by CCD or photomultiplier detectors. The details of the experimental system were described elsewhere (Orszagh et al. 2017).

Fig. 1. Scheme of the experimental apparatus.
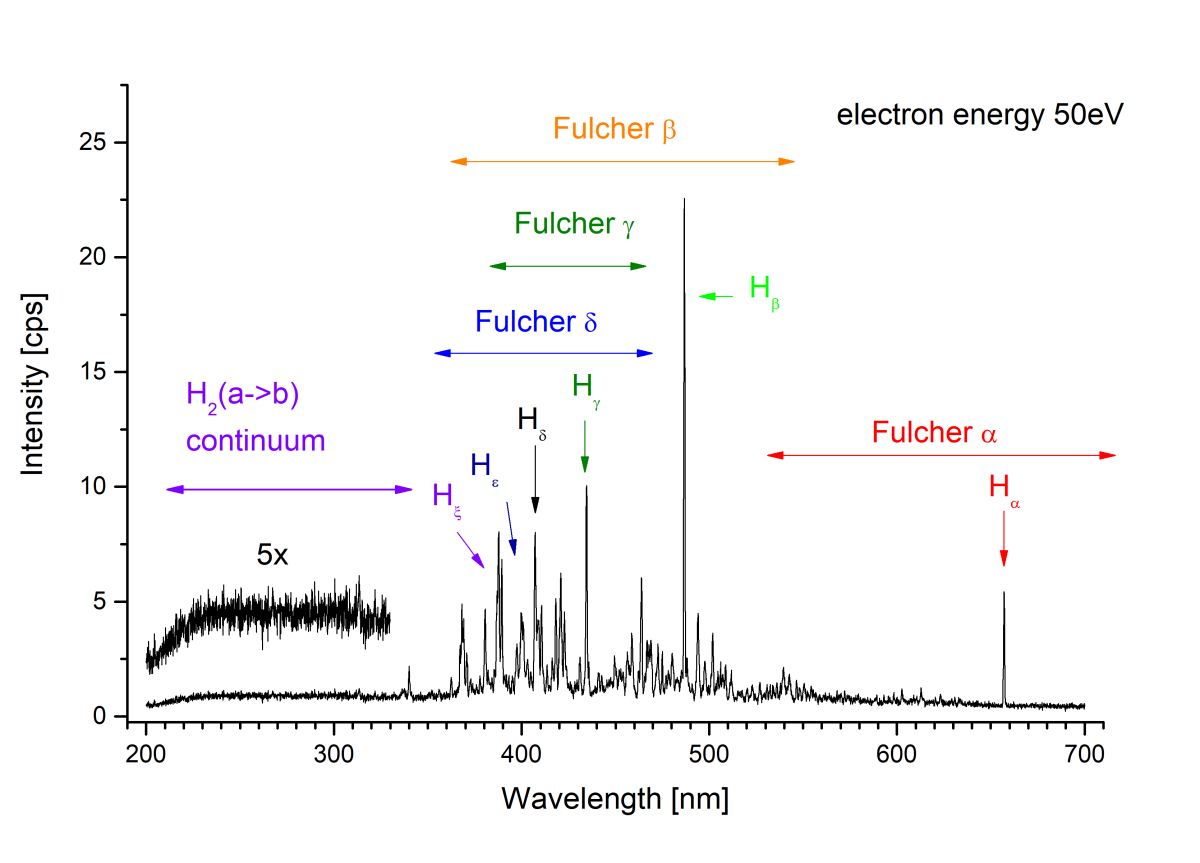
The main result of the experiment are the emission spectra (see second figure as an example) and emission cross section curves determined in precisely defined conditions. The shape of the spectrum given by population of individual ro-vibrational states and presence of individual spectral features depends strongly on excitation source and its energy (Bodewits et al. 2019).

Fig. 2. Emission spectrum of hydrogen induced by 50 eV electrons impact.
From the relative cross section curves it is possible to determine the lowest kinetic energy (threshold energy) of the electrons necessary to create a specific excited product and after calibration to absolute values we get series of cross sections for individual electron impact energies. Below the threshold the spectral line or band will not be present in the spectrum. The third figure shows relative emission cross section of oxygen where two thresholds correspond to different processes generating excited oxygen atom.
Fig. 3. Relative emission cross section curve for oxygen atom.
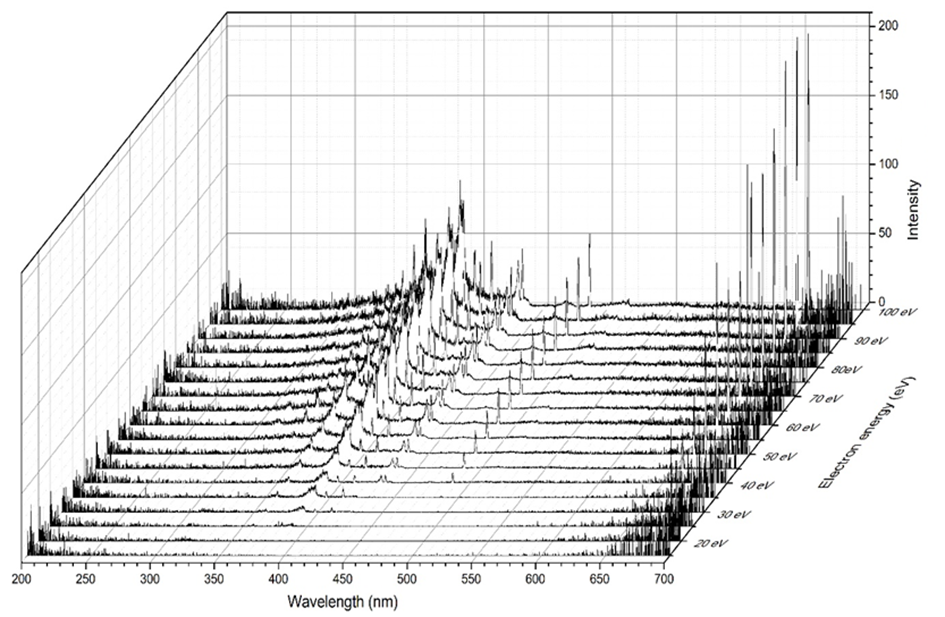
By putting spectral and relative cross sections information together by measuring emission spectra at several electron impact energies we can get a surface formed by emission cross section values within selected range of wavelengths and electron energies (see the last figure).

Fig. 4. 3D spectral map of emission induced by electron impact on pyridine.
Such complex information on the kinetics of electron-molecule excitation reactions is unfortunately rare mostly due to the technically demanding experiment but they provide valuable reference for analysis of astronomical spectroscopic data. Electron-molecule reactions in environment such as cometary comas or atmospheres can serve as a remote probe for characterization of local conditions if reference laboratory data on their kinetics are available.
Acknowledgments
This project has received funding from the European Union's Horizon 2020 research and innovation programme under grant agreement No 871149. This research was supported by Slovak grant agency VEGA within the projects nr. 1/0489/21 and 1/0553/22, by Slovak Research and Development Agency within project nr. APVV-19-0386, and by NASA ROSES project nr. NNH18ZDA001N-RDAP.
Beenakker, C.I.M. et al., 1974. Chemical Physics, 6(3), pp.445–454.
Bodewits, D. et al. 2016. Astronomical J., 152, 130.
Bodewits, D. et al., 2019. Astrophys. J., 885(167), p. 16.
Broiles, T.W. et al., 2016. Journal of Geophysical Research: Space Physics, 121 (8), pp.7407–7422.
Farnham, T.L., Schleicher, D.G. & A'Hearn, M.F., 2000. Icarus, 147, p.180.
Itikawa, Y. & Mason, N., 2005. Journal of Physical and Chemical Reference Data, 34(1), pp.1–22.
Morgan, H. D. & Mentall, J.E., 1974. Journal of Chemical Physics, Volume 60, Issue 12, pp. 4734-4739.
Orszagh, J. et al. 2017, Astrophys. J., 841(17).
How to cite: Orszagh, J., Stachova, B., Blasko, J., Matejcik, S., Bodewits, D., and Bromley, S.: Reference emission spectral data for astronomical observations, Europlanet Science Congress 2022, Granada, Spain, 18–23 Sep 2022, EPSC2022-950, https://doi.org/10.5194/epsc2022-950, 2022.

