SB5
Session assets
Orals: Fri, 23 Sep, 10:00–17:00 | Room Andalucia 2
The planetary Ice Laboratory has been developed at the University of Bern to measure various reflectance properties of analogues for small bodies and planetary surfaces with a special focus on icy surfaces. Its core facilities are a set of devices to produce well-characterized and reproducible analogue samples and a set of instruments designed to measure the reflectance properties of the samples over different spectral ranges, different geometrical configurations, either in total light or sorted by polarisation state.
We use the laboratory to work on a range of scientific questions, mostly related to current Solar System missions and the interpretation of remote-sensing data but also occasionally on telescopic observations of Solar System objects as well as distant exoplanets and planet-forming circum-stellar discs. The experimental datasets collected are then provided to public databases for use by the community.
Some of our most recent investigations include:
- Visible and near-infrared reflectance spectra of analogues for the icy moons of the outer Solar System. We have collected new data with salty ice samples (Fig. 1), before and after irradiation by electrons, which can be compared with reflectance data measured by previous missions. The dataset will also help with the preparation of the JUICE and Europa Clipper missions.
- Simulations of cometary activity, in the framework of the CoPhyLab project led by TU Braunschweig, with IWF Graz, MPS and DLR as partners. We develop quantitative methods to derive the ice-to-dust ratio from reflectance data in order to study the sublimation of dust ice mixtures prepared as cometary analogues. The results help interpreting the data from previous missions such as Rosetta and preparing future missions such as Comet Interceptor.
- Spectral reflectance properties of different types of icy and dry Martian analogues, most notably in relation with the quantitative analysis of images returned by the CaSSIS imager of Exomars TGO. These measurements are performed in a simulation chamber equipped to simulate the Martian conditions of composition, temperature and pressure and we look at the samples with an imager equipped with the spare bandpass filters from CaSSIS (Fig. 2).
- The linear polarisation properties of pure and mixed minerals as analogues for the surfaces of asteroids with implications for the interpretation of measured phase curves in terms of composition. (see also Spadaccia et al., this conference).
- Assessment of the potential of circular spectropolarimetry as a biosignature in reflected light for Solar System objects and exoplanets.
- Measurements of artificial samples for comparison with numerical simulations.
With this presentation, we will provide an overview of the main objectives of the overall project, detail the methodology used, and present some of the results from the most recent studies mentioned here.
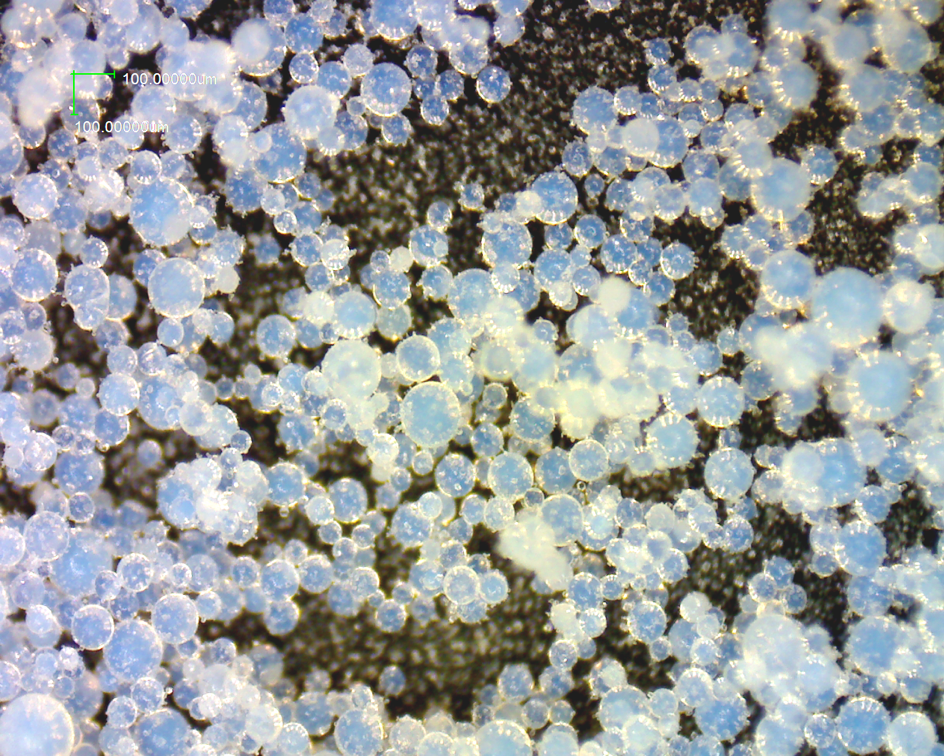
Fig. 1: Blueish salty (NaCl) ice particles (~67µm) produced after the freezing in LN2 of salty solutions. Particles freeze from the exterior to the interior, forming a thin mantle of pure crystalline ice around a core of amorphous hyper saline ice. After the LN2 has evaporated, ice and salt in the core slowly crystallize as the temperature increases, generating Rayleigh scattering.
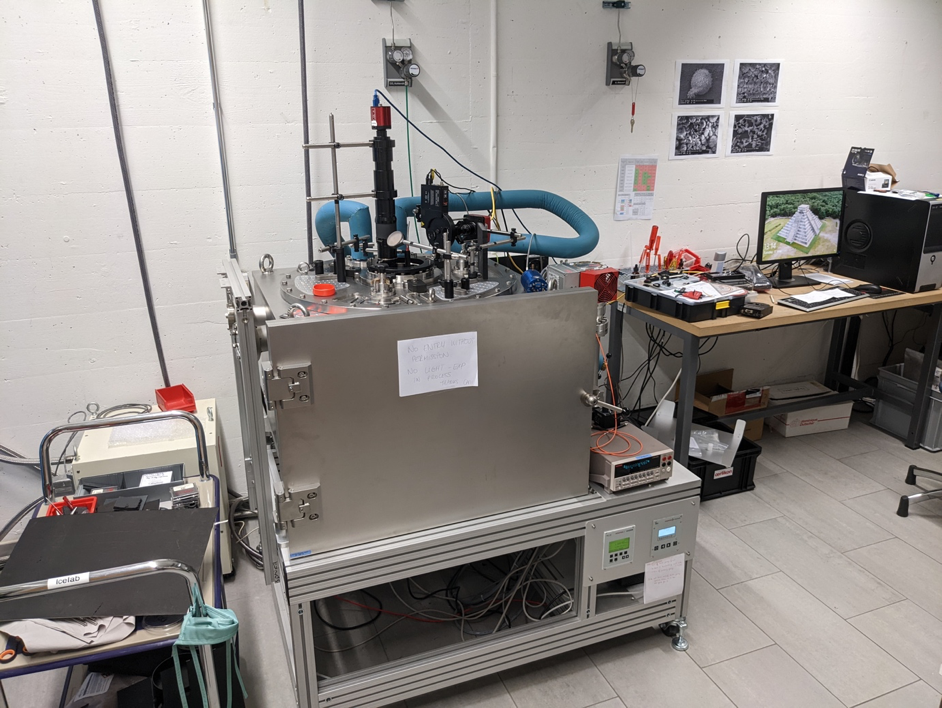
Fig. 2: The SCITEAS-2 simulation chamber configured to simulate the cold surface and atmosphere at the Martian poles and equipped with a microscope and a multispectral imager with the spare bandpass filters from CaSSIS.
How to cite: Pommerol, A., Patty, L., Spadaccia, S., Affolter, L., Becerra, P., Capelo, H., Cerubini, R., Cesar, C., Drozhzhova, T., Feller, C., Kipfer, K., Stoeckli, L., Valantinas, A., Yoldi, Z., and Thomas, N.: Reflectance properties of analogues for small bodies and planetary surfaces. Overview of experimental characterizations at the University of Bern, Europlanet Science Congress 2022, Granada, Spain, 18–23 Sep 2022, EPSC2022-512, https://doi.org/10.5194/epsc2022-512, 2022.
Introduction
Solar System small bodies are presumed relics from the eve of the Solar System, as they were the first objects to accrete inside the protoplanetary disk. The P-/D-type asteroids are particularly interesting because of the similarity of their spectra, in the visible (Vis) and near infrared (NIR) wavelengths, with cometary nuclei, suggesting that they are the most primitive types of small bodies [1-3]. In the mid-infrared (MIR), emission spectra of both P-/D-type asteroids surfaces and cometary comae display a signature around 10 µm due to the fundamental mode of vibrations of Si-O in silicates [2, 4-5]. P-/D-type asteroids are among the low-albedo class, and are characterized by linear polarimetric phase curves in V-band with a minimum of polarization around 1.2 ± 0.4 % and an inversion angle around 8.5 ± 2.5° [6].
There are various indications that the surface of these primitive small bodies are covered by so-called “hyperfine” grains, with individual grain sizes smaller than the wavelength at which they are observed (< 1 µm) [7]. The spectral characteristics of these objects in the Vis-NIR and MIR have also been attributed to their peculiar micro-texture and grain size [4, 5]. Here, we investigate how the Vis-NIR spectra, MIR spectra and Vis polarimetric phase curves of surfaces made of hyperfine grains are influenced by the relative abundance of materials having strongly different optical indexes.
Methods
We used olivine and iron sulphide (a mixture of pyrrhotite and troilite; labelled as “FeS”) having contrasted optical indexes. Following a dedicated grinding protocol, we have produced grains of average diameter ranging from 0.3 to 0.6 µm, as imaged by electron microscopy [8]. Mixtures were produced by mixing the two powders in a mortar manually with the pestle for about 10 min. Reflectance spectra in the Vis-NIR range were obtained at IPAG with the SHADOWS instrument [9] (emergence e=30º, incidence i=0º). MIR reflectance spectra were obtained using a Brucker Vertex 70V FT-IR spectrometer equipped with a reflectance kit A513/QA. Because small bodies MIR observations are emissivity spectra, we show on Figure 1b the experimental spectra as “1 - reflectance” to approximate their emissivity spectra according to the Kirchhoff’s law. Polarimetric phase curves were measured at the University of Bern with the POLICES instrument at 530 nm [10].
Results
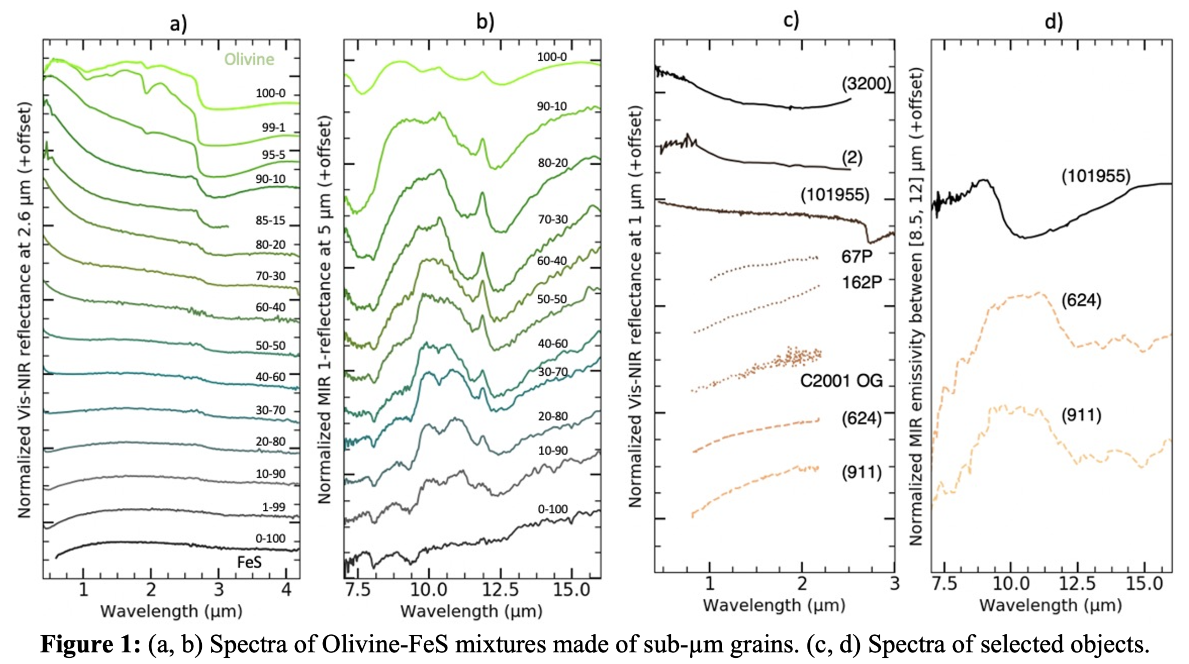
Figure 1a presents the evolution of normalized reflectance spectra of olivine-FeS mixtures with decreasing volume concentration of olivine. We observe a general decrease of reflectance, associated to a modification of the spectral slope, as the concentration of FeS (opaque in the Vis) increases, with a blueing followed by a reddening of the spectra (Fig. 1a). The measurements reveal that mixtures of hyperfine grains made of two components with contrasted optical indexes have spectral and polarimetric properties which varies in strongly nonlinear way in the Vis-NIR (Fig. 1a,b, Fig. 2). In the MIR, while the spectra of the endmembers are relatively flat, the spectra of mixtures containing high concentrations of FeS exhibit the absorption bands of Si-O in the olivine around 10 µm.
Discussion
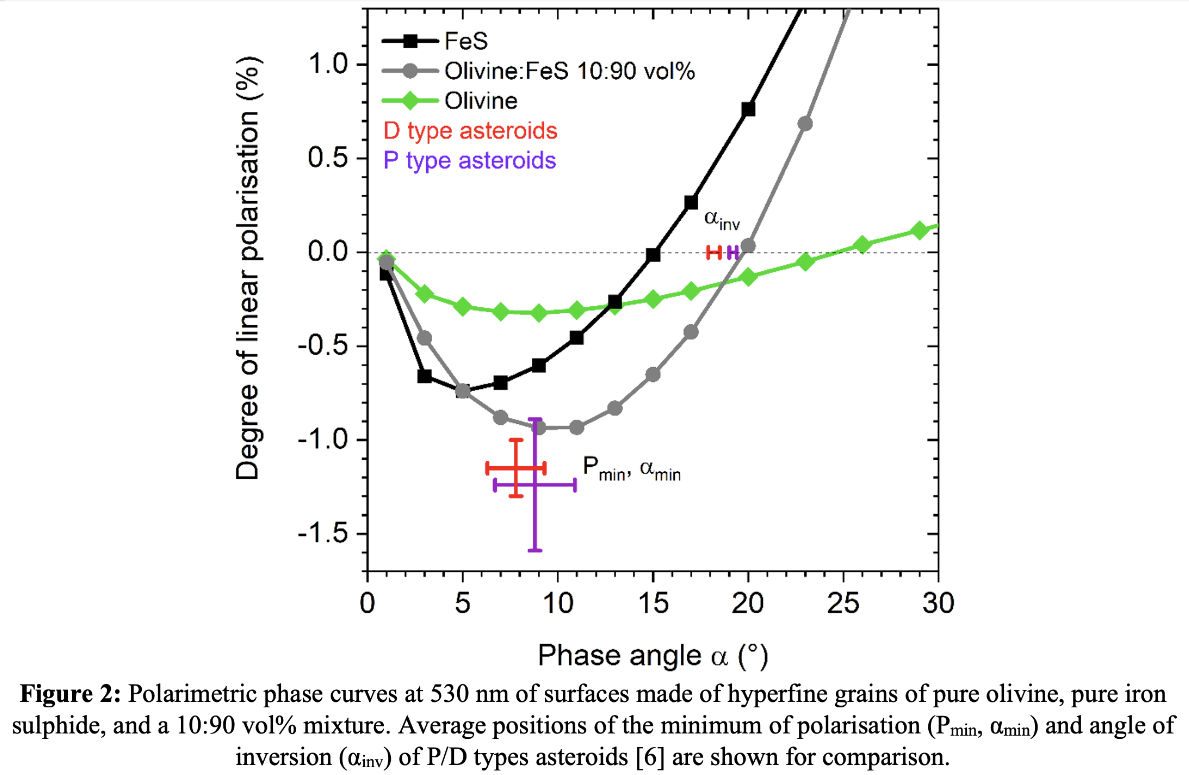
Spectra of mixtures of olivine and iron sulphide (or anthracite, not shown here) exhibit an emissivity feature in the MIR and various degree of bluing or reddening in the Vis-NIR, as observed on several small bodies (Fig. 1). Moreover, the same mixtures exhibiting the 10-µm feature also have a polarimetric phase curve similar to P-/D-type asteroids (Fig. 2).
Spectra of pure olivine, or mixtures with high concentration of olivine exhibit spectral features mainly due to reflectivity effects. As the concentration of FeS grains increases, these features are progressively replaced by the absorption bands of olivine material, maximum around 10 to 11 µm. In these cases, the olivine grains are well dispersed in a matrix of FeS grains which diffuse the light and enable photons to escape the sample after some absorption by olivine grains. A similar mechanism was pointed out with mixtures in KBr [5], but while mixtures with KBr are very reflective, mixtures with FeS have a much lower reflectance, compatible with the low reflectance and high emissivity values observed on small bodies.
The resemblance between mid-IR spectra of our hyperfine mixtures and P-/D-type asteroids emission feature (Fig. 1d) implies that elevated porosity is not a requirement for the presence of a silicate signatures at 10 µm. We show here that a relatively compact surface (porosity of the order of 50 %) exhibits similar mid-IR feature as cometary dust tails. An interpretation that can be proposed is that in both cases an optical separation of olivine grains occurred, whether by vacuum in the case of comae, or by optically featureless grains in the case of P-/D-type asteroids.
Finally, we note that some mixtures of hyperfine grains (such as olivine-FeS 10:90 vol%) exhibit altogether a red spectral slope in the Vis-NIR, a 10-µm feature in the MIR, and a V-band polarimetric phase curve similar to P-/D-type asteroids, reinforcing the hypothesize that these bodies are made of powdery mixtures of hyperfine grains.
Acknowledgments: We acknowledge funding from the European Research Council (ERC) (SOLARYS ERC-CoG2017_771691)
References: [1] Capaccioni et al. (2015) Science 347, 6620. [2] Vernazza and Beck (2017) in Planetesimals, Cambridge Univ. Press. [3] Poch et al. (2020) Science 367, 6483. [4] Emery et al. (2006) Icarus 182, 496-512. [5] Vernazza et al. (2012) Icarus 221, 1162–1172. [6] Belskaya et al. (2017) Icarus 284, 30–42. [7] Levasseur-Regourd et al. (2018) Space Sci Rev 214. [8] Sultana et al. (2021) Icarus 35, 11412. [7] Mustard and Hays (1997) Icarus 125, 145-163. [9] Potin et al. (2018) App. Optics 57, 28. [10] Poch, (2018) JGR Planets, 123.
How to cite: Poch, O., Sultana, R., Beck, P., Spadaccia, S., Patty, L., Pommerol, A., Quirico, E., and Schmitt, B.: Hyperfine grains can explain altogether the Vis-NIR spectral slope, MIR emissivity, and V-band polarimetric phase curves of primitive small bodies, Europlanet Science Congress 2022, Granada, Spain, 18–23 Sep 2022, EPSC2022-821, https://doi.org/10.5194/epsc2022-821, 2022.
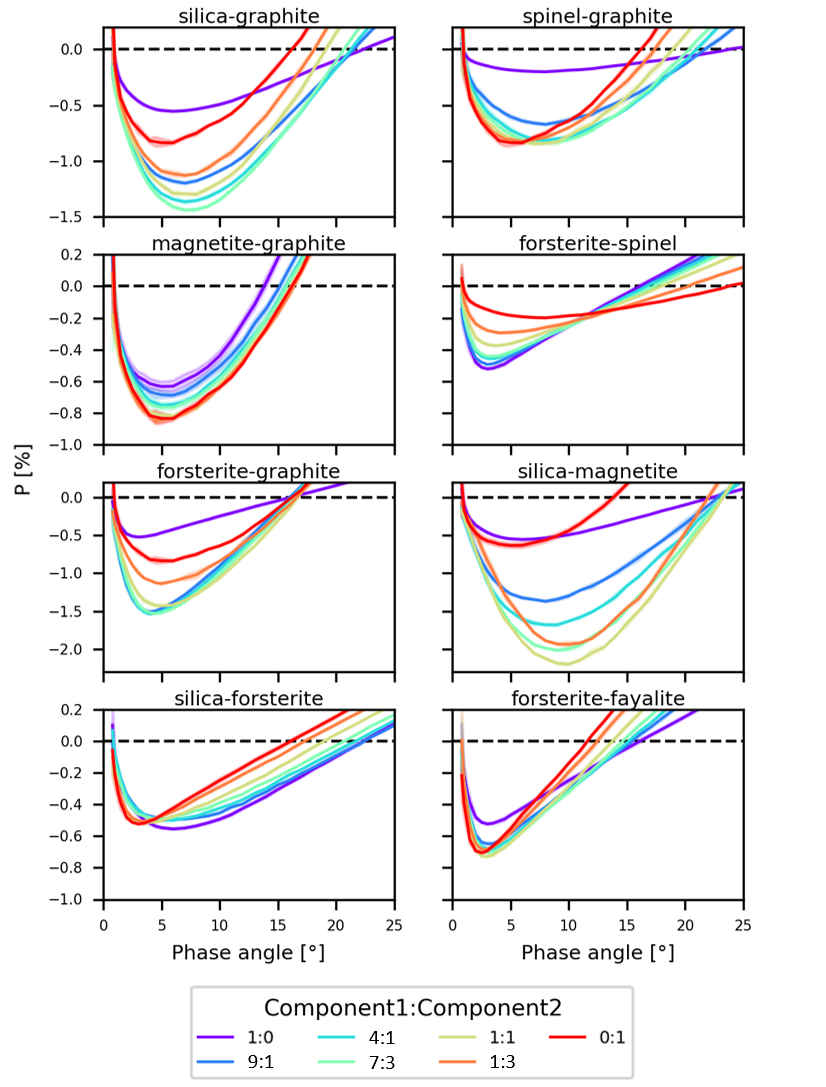
Polarization phase curves of asteroids and other small airless bodies are influenced by the compositional and physical properties of their regolith. The mixing of minerals composing the regolith influences the negative polarization at small phase angles as it changes the multiple scattering properties of the medium.
In recent years, two new asteroid classes have been identified by their polarization phase curve at small phase angles [1][2]. The F-class shows an inversion angle (i.e. the phase angle at which the polarization becomes positive) relatively small to other asteroid families (about 14-16°), and the L-class (the so-called “Barbarians” after the prototype of this class (234) Barbara) show very high inversion angles, about 25-30°. The interpretation of these phase curves is challenging, and it has been proposed that the polarization properties of Barbarians are directly correlated to their surface mineralogy, in particular to the presence of spinel-bearing calcium-aluminum inclusions in a dark matrix [3][4]. The F-class peculiar negative polarization has been interpreted as the result of a homogeneous composition of the surface [1].
We know that the surface mineralogy is directly influencing the polarization phase curve of asteroids. In fact, asteroids tend to group in their respective spectral classes when their minimum of polarization is plotted versus [5]. It has been experimentally demonstrated that a mixture of minerals with different albedos can deepen the negative polarization with respect to the polarization phase curves of the single minerals [6][7], and we call this effect the “mixing effect”. A systematic study on the “mixing effect”, however, is lacking in the literature. The mixing of bright ad dark minerals has been studied in polarization only for a few minerals, and it has been used to explain the polarization behavior of F-type asteroids and trans-Neptunian objects [8].
Our work aims to demonstrate experimentally how the “mixing effect” influences the polarization phase curve at small phase angles for different mineralogies relevant for asteroids and to determine how different aggregate sizes affect the negative polarization. We prepared a set of binary and ternary mixtures with different common minerals on asteroids and one set of the same mixture with different aggregate sizes. We measured their reflected light at 530 nm with full-Stokes polarimetry at phase angles ranging from 0.8° to 30°.
The mixing effect of those mixtures with both bright and dark minerals significantly changes the behavior of the phase curves in terms of minimum polarization, phase angle of the minimum, and inversion angle with respect to the mineral components that are mixed together (Fig. 1). Some of the binary mixtures show a deepening of the negative polarization when a low reflectance mineral is mixed with a high reflectance mineral. The inversion angle is affected similarly, increasing respect to the inversion angle of the single minerals. Interestingly, some binary mixtures with high and low reflectance minerals show no deepening of the negative polarization (e.g. spinel and graphite). In general, the polarization phase curve changes significantly every time that two or more minerals are mixed together. Furthermore, we find that the presence of aggregates up to cm-size does not affect the negative polarization.
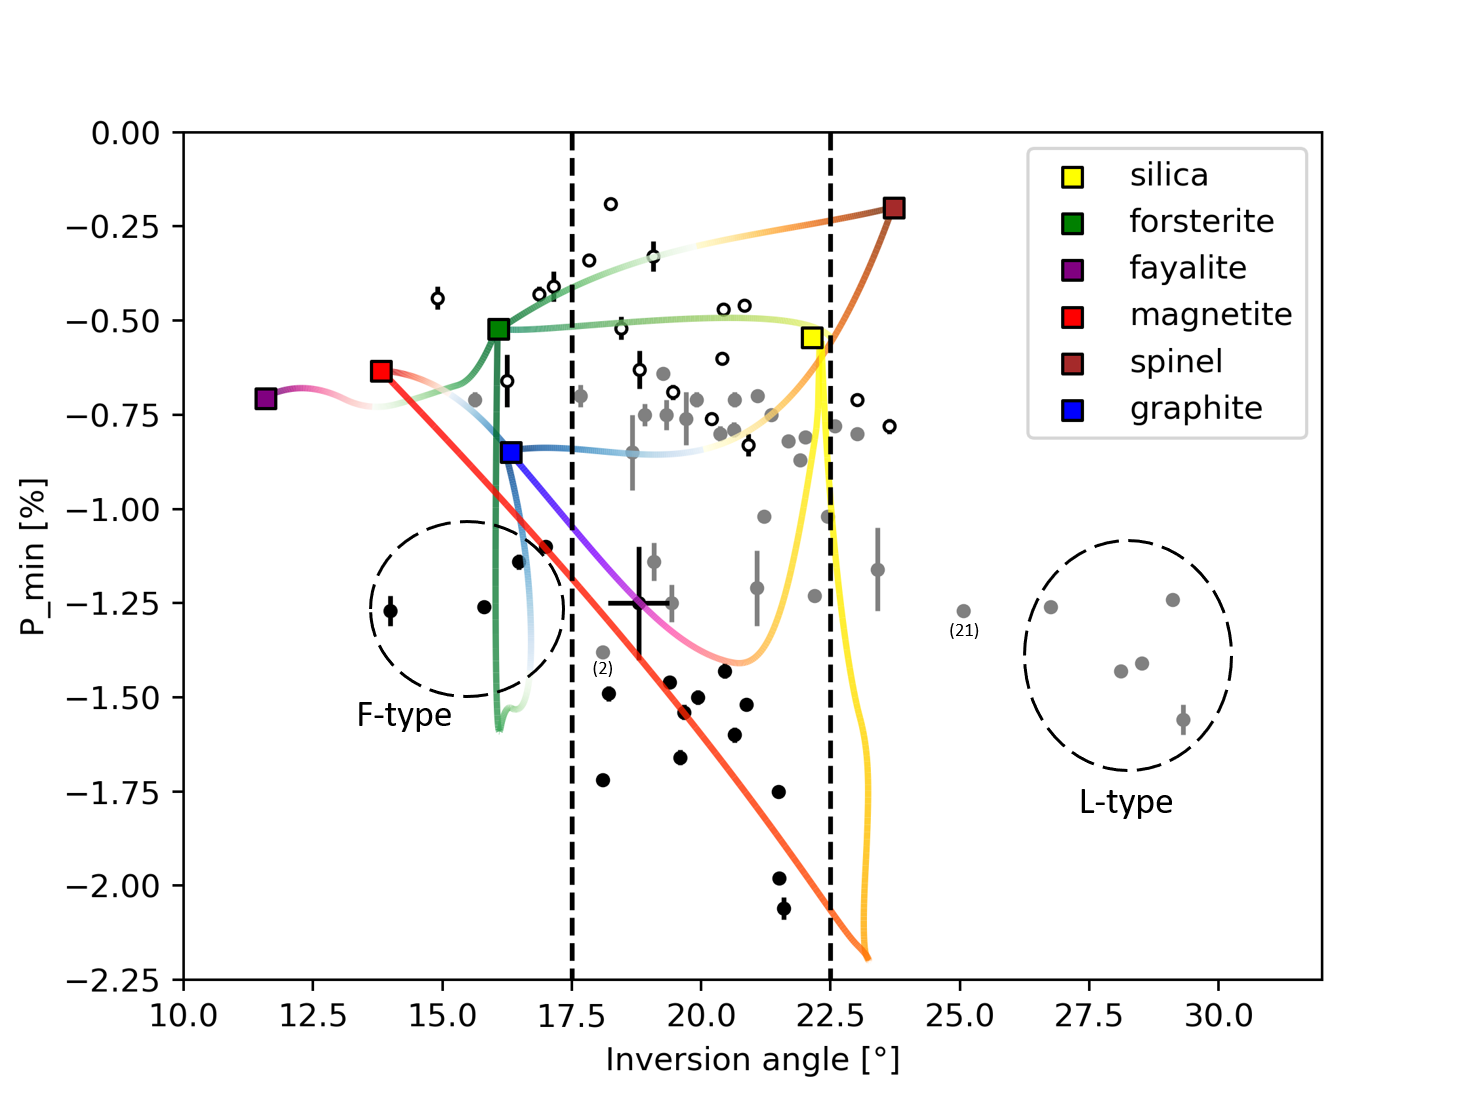
Our binary mineral mixtures can explore large areas of the space (Fig. 2). Our results show that F-class asteroids could be not as homogeneous as previously thought, since similar reflectance, and can be obtained by a mixture with 1:3 mass ratio of bright and dark minerals (forsterite and graphite).
Barbarians lay in a region that is not explored by our binary mixtures. Nonetheless, we observe that our binary mixtures have a higher inversion angle with increasing contrast of the two end-members (pure Mg-spinel excluded). Other studies found similar results for mixing bright and dark materials: [6] found that the inversion angle increases by 3° compared to pure fine silicates when adding 10% of 10 nm soot, and [7] found that a 1:1 mixture of sub-micron MgO and Fe2O3 shows a 9° higher inversion angle with respect to the highest inversion angle of the end-members (MgO). In our sample, the largest increase in inversion angle is given by a 1:1 mixture of silica and magnetite, with an excess of 1° compared to the inversion angle of pure silica. We expect that mixtures of very fine dark and bright particles could increase even more substantially the inversion angle compared with the single end-members. From this perspective, we propose that the polarimetric behavior of Barbarians is not merely related to the presence of a single mineral, but to a combination of very fine regolith having both bright (CAIs) and dark components that are mixed finely together.
A good synergy between modeling, observations, and laboratory experiments has the potential to strongly aid in interpreting the surface properties of regolith when observing reflected polarized light. Both future sample-return missions and in-situ high sensitive polarimetric observations will greatly improve our
understanding of asteroid regolith properties, helping in the interpretation of astronomical measurements and constraining laboratory simulations to more realistic mineralogies.
[1] Belskaya, I. N., et al. "The F-type asteroids with small inversion angles of polarization." Icarus 178.1 (2005): 213-221
[2] Cellino, A., et al. "The strange polarimetric behavior of Asteroid (234) Barbara." Icarus 180.2 (2006): 565-567.
[3] Sunshine, J. M., et al. "Ancient asteroids enriched in refractory inclusions." Science 320.5875 (2008): 514-517.
[4] Devogèle, Maxime, et al. "New polarimetric and spectroscopic evidence of anomalous enrichment in spinel-bearing calcium-aluminium-rich inclusions among L-type asteroids." Icarus 304 (2018): 31-57.
[5] Belskaya, I. N., et al. "Refining the asteroid taxonomy by polarimetric observations." Icarus 284 (2017): 30-42.
[6] Zellner, B., T. Lebertre, and K. Day. " II-Laboratory polarimetry of dark carbon-bearing silicates." Lunar and Planetary Science Conference Proceedings. Vol. 8. 1977.
[7] Shkuratov, Yu G. "Negative Polarization of Sunlight Scattered from Celestial Bodies-Interpretation of the Wavelength Dependence." Soviet Astronomy Letters 13 (1987): 182.
[8] Bagnulo, Stefano, et al. "Exploring the surface properties of transneptunian objects and Centaurs with polarimetric FORS1/VLT observations." Astronomy & Astrophysics 450.3 (2006): 1239-1248.
How to cite: Spadaccia, S., Patty, L., Capelo, H. L., Thomas, N., and Pommerol, A.: Small phase angle polarization properties of regolith-like materials - the "Mixing Effect", Europlanet Science Congress 2022, Granada, Spain, 18–23 Sep 2022, EPSC2022-516, https://doi.org/10.5194/epsc2022-516, 2022.
Light scattering experiments have been carried out at visible light for two kinds of dust samples: narrow size distributions consisting of low-absorbing particles with sizes in the micron domain, plus millimeter-sized single grains. The polarimetric analysis of the scattered light has revealed as a very precise tool for size characterization of the samples of particles in the resonance regime, while it let us distinguish the compact/fluffy structure feature of particles much larger than the wavelength.
First, four narrow size distributions of forsterite particles, spanning a broad range of scattering sizes in the resonance regime, were measured. Forsterite is a Mg-rich olivine representative of low-absorbing cosmic dust particles that has been identified in several comets, e.g. 1P/Halley, Hale–Bopp, 9P/Tempel and 81P/Wild2 (see [1] and references therein). The maximum of the degree of linear polarization (DLP) decreases with the size of the particles. That maximum occurs around 90º in all cases, but the angle ranges from 75º to 140º, increasing with the grain size [2]. Furthermore, dust particles with size parameters from ∼ 6 to ∼ 20 seem to be responsible for the negative polarization branch (NBP). This is in agreement with the idea that the NBP might be caused by coherent back-scattering by wavelength-scaled features of the grains (see .e.g. [3]).
On the other hand, millimeter-sized particles were identified to reproduce the flux curve of Fomalhaut protoplanetary disk [4]. Light scattering was then
measured for the same kind of grains in an attempt to reproduce the comet 67P/Churyumov-Gerasimenko phase function obtained in situ by the OSIRIS
camera system onboard the ESA Rosetta mission. In that case it was found that large porous particles with organic inclusions can reproduce both, ground-based observations of the DLP and the OSIRIS phase functions [5].
References
1. Frattin, E., Muñoz, O., Moreno, F., Nava, J., Escobar-Cerezo, J., Gomez Martin, J.C., Guirado, D., Cellino, A., Coll, P., Raulin, F., Bertini, I., Cremonese, G., Lazzarin, M., Naletto, G., Forgia, F.L.: Experimental phase function and degree of linear polarization of cometary dust analogues. Monthly Notices of the Royal Astronomical Society 484, 2198–2211 (2019)
2. Muñoz, O., Frattin, E., Jardiel, T., Gómez-Martín, J.C., Moreno, F., Ramos, J.L., Guirado, D., Peiteado, M., Caballero, A.C., Milli, J., Ménard, F.: Retrieving dust grain sizes from photopolarimetry: An experimental approach. The Astrophysical Journal Supplement Series 256(17 (12pp)) (2021)
3. Muinonena, K., Penttilä, A., Videen, G.: Polarimetry of Stars and Planetary Systems, chap. Multiple Scattering of Light in Particulate Planetary Media. Cambridge University Press, Cambridge (2015)
4. Muñoz, O., Moreno, F., Vargas-Martín, F., Guirado, D., Escobar-Cerezo, J., Min, M., Hovenier, J.W.: Experimental phase functions of millimeter-sized cosmic dust grains. The Astrophysical Journal 846(85 (8pp)) (2017)
5. Muñoz, O., Moreno, F., Gómez-Martín, J.C., Vargas-Martín, F., Guirado, D., Ramos, J.L., Bustamante, I., Bertini, I., Frattin, E., Markannen, J., Tubiana, C., Fulle, M., Güttler, C., Sierks, H., Rotundi, A., Corte, V.D., Ivanovski, S., Zakharov, V.V., Bockelée-Morvan, D., Blum, J., Merouane, S., Levasseur-Regourd, A.C., Kolokolova, L., Jardiel, T., Caballero, A.C.: Experimental phase function and degree of linear polarization curves of millimetersized cosmic dust analogs. The Astrophysical Journal Supplement Series 247(19 (13pp)) (2020)
How to cite: Guirado, D., Muñoz, O., Frattin, E., Gómez Martín, J. C., Martikainen, J. A., Moreno, F., Jardiel, T., Peiteado, M., and Caballero, A. C.: Characterizing cometary dust grains with polarimetry, Europlanet Science Congress 2022, Granada, Spain, 18–23 Sep 2022, EPSC2022-740, https://doi.org/10.5194/epsc2022-740, 2022.
Introduction: Airless bodies of the Solar System present surface evolution due to space weathering. Their regolith is exposed to thermal cycling, cosmic and solar-irradiation, solar wind sputtering and micrometeorites bombardment and associated vaporization. With time, these materials accumulate optically active opaque particles such as nanophase metallic iron on the surface or rims of dust grains or larger iron particles. The density increase in iron particles modifies the spectral properties of the material with a lowering of the albedo, and of the amplitude of absorption bands, generally associated with a global reddening of the spectral slope [1, 2].
Previous studies have shown that nanophase iron particles that induce spectral properties typical of space-weathering will accumulate at the surface of olivine and pyroxene minerals at temperature conditions corresponding to micrometeorite impacts [3]. The skin depth of weathered material depends on the weathering process and minerals.
Context for Phobos studies: The moons of Mars, Phobos and Deimos, are some of the most enigmatic small bodies of the Solar System. Indeed, it is still debated in the community whether they originate from a large impact on Mars [4, 5], or if they are captured primitive asteroids [6]. The overall spectra of Phobos and Deimos have a strong red slope with no obvious diagnostic spectral features readily detected in the visible or near-infrared, similar to very primitive small bodies of the solar system. However, significant variations in the spectral slope indicate inhomogeneities of the material on the surface of Phobos, suggesting mixture of asteroidal and basaltic materials [7].
The Mars Moons Explorer (MMX) mission will bring back samples of Phobos to Earth in order to decipher the origin of the Martian Moons system [8]. The MMX InfraRed Spectrometer (MIRS) instrument on-board the mission is an infrared imaging spectrometer (0.9 to 3.6 μm) that will study the spectral properties of the surface of Phobos and Mars.
Laboratory analogue samples: In this context, laboratory analogues were ‘weathered’ artificially by submitting basalt (such as the Pic d’Ysson basalt already used for laboratory studies on the lunar regolith optical and spectrophotometric behavior [9]) and meteorite samples to near fusion temperature (1000°C) in an controlled-atmosphere furnace under reducing conditions (partial pressure of CO/CO2 of 96% corresponding to an oxygen fugacity of about 10-17) for exposure times of a 2, 4 and 8 hours (Figure 1; [10]).
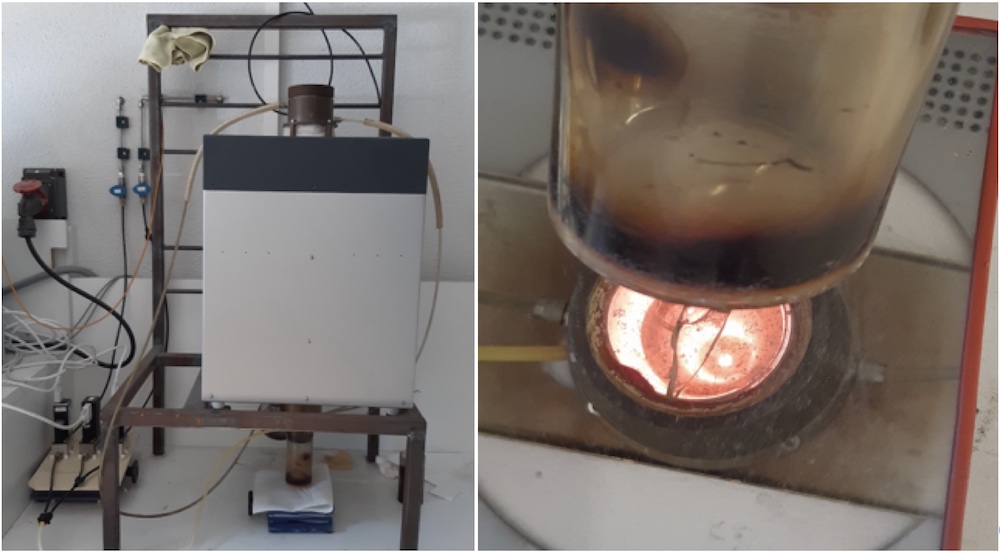
Fig. 1: The controlled-atmosphere furnace at IRAP used for heating under reducing conditions [10].
Analysis of the weathered samples : A first comparison between unaltered Pic d’Ysson basalt grains and grains subjected to 4 hours heating at 1100°C under reducing conditions (fugacity of 10-17) is presented in Figure 2. Backscattered SEM images of basaltic grains before and after exposure are compared. The unaltered grain presents a typical crystalline structure with olivine, feldspars and ilmenite (bright minerals). Its bulk composition is given in Table 1.
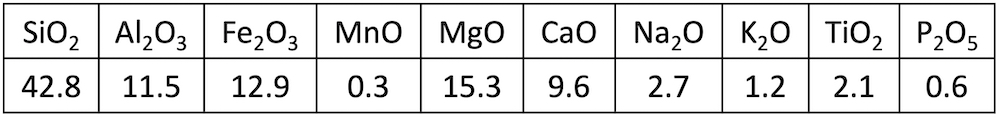
Tab. 1: Elemental bulk composition of the Pic d’Ysson basalt unweathered (values given in wt.%).
When considering the altered basalt grain, the onset of alteration due to heating is clearly seen over a depth of about 30 microns (top left and left side of the images), with partial melting of the minerals and the appearance of nanophase metallic iron phases (presence of small white grains on the surface and inside the minerals).
Spectral analysis : The near infrared reflectance spectra of the ‘unweathered’ (pristine) and ‘weathered’ (heat-treated) samples (1050°C for 4 hours) are then acquired with the SHADOWS instrument at IPAG [11]. The resulting spectra are illustrated in Figure 3 (unweathered in red, weathered in blue). The weathered samples (powdered or sintered) demonstrate a significant change of slope with a strong visible reddening of the spectrum. At the same time the crystal infrared absorption bands depths are generally reduced.
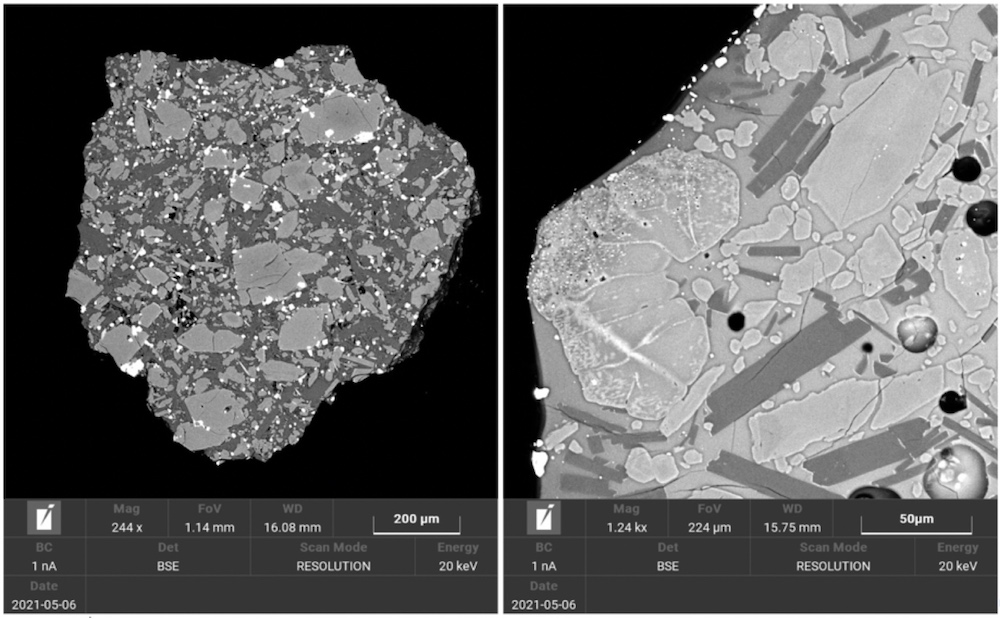
Fig. 2 : SEM analysis showing the onset of heat diffusion and iron metal formation left: crystalline basalt grain unaltered showing the presence of olivine and feldspar crystals with ilmenite (bright minerals). right: apparition of nanophase Fe over a 30 μm depth after 4 hrs heating at 1100°C under reducing conditions.
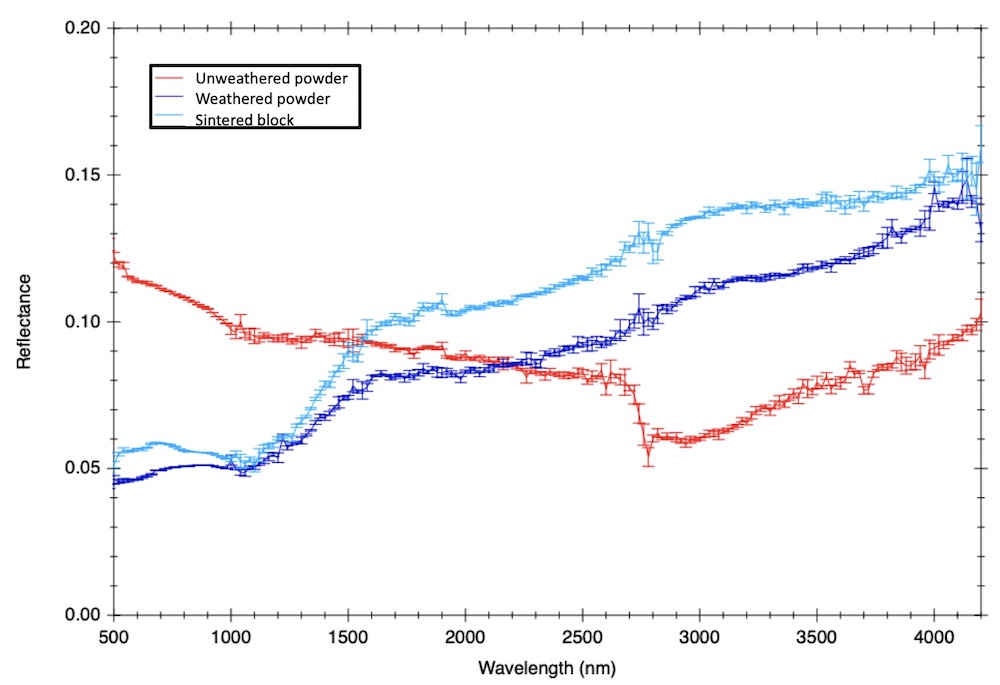
Fig. 3 : NIR analysis of samples heated at 1050°C for 4 hours with SHADOWS [11] showing the reddening of the spectral slope between unaltered sample (red) and weathered samples (light blue: sintered; dark blue: powdered).
Conclusions and perspectives : Laboratory simulations show that heat-treated samples under reducing conditions can recreate the conditions under which regolith may be weathered in space with surface alteration of grains and appearance of nanophase iron. The analysis of the grains’ spectral properties indicates significant reddening and decrease of the absorption band depths as seen on space weathered surfaces. For the moment, the slopes reached remain lower than the ones seen on the surface of Phobos and Deimos. Now that the weathering concept has been demonstrated, further experiments will be performed using Mars analogues and meteorite samples to better constrain the possible materials on the surface of Phobos. Grain size distribution effects will also be explored.
Acknowledgment: this study was funded by CNES.
References: [1] Hapke, B. (2001) JGR, 106(E5), 10039-10073. [2] Pieters, C.M., & Noble, S.K. (2016) JGR, 121(10), 1865-1884. [3] Weber, I., et al. (2020) EPSL, 530, 115884. [4] Canup, R., & Salmon, J. (2018) Science advances, 4(4), eaar6887. [5] Bagheri, A., et al. (2021) Nature Astronomy, 1-5. [6] Hansen, B. M. (2018) MNRAS, 475(2), 2452-2466. [7] Glotch, T. D., et al. (2018) JGR: Planets, 123(10), 2467-2484. [8] Kuramoto, K., et al. (2021) Earth, Planets and Space. Submitted. [9] Souchon, A.L., et al. (2011) Icarus, 215(1), 313-331. [10] Toplis, M.J., & Corgne, A. (2002) Contributions to Mineralogy and Petrology, 144(1), 22-37. [11] Potin, S., et al. (2018) Applied optics, 57(28), 8279-8296.
How to cite: Lasue, J., Pinet, P., Beck, P., Toplis, M., Munsch, P., and Oustric, M.: Spectral behavior of regolith analogues weathered by heating under reducing conditions. , Europlanet Science Congress 2022, Granada, Spain, 18–23 Sep 2022, EPSC2022-840, https://doi.org/10.5194/epsc2022-840, 2022.
1. Introduction
Over the past 35 years, our understanding of comets has been effectively revised by the different space missions, which have allowed to extensively characterise the coma and nuclei of seven comets [1]. While continuously supported by the results of ground observations, this understanding has been further im proved by the multiple laboratory experiments performed concurrently (e.g. [2, 3]).
As part of the efforts of the CoPhyLab project to further our knowledge of the physical processes occuring on comets [4, 5],
we will present the results obtained at the University of Bern on optical properties of silicon dioxide (SiO2) and juniper charcoal (JChc), as well as of intimate mixtures made out of these two components, as detailled in [6].
2. Samples and experiments
We performed our characterization using the goniometer and spectral imager developped by the Planetary Imaging Group of the Bern university [7]. Measurements were acquired for samples of JChc and SiO2powders but also for intimate mixtures of these two materials. Mixtures were prepared with a JChc fraction varying from 10% to 90% by mass, in 10% increments.
The goniometer PHIRE-2 [8] allowed us to acquire the bidirectional reflectance of the samples, across the incidence and emergence planes (from ±5° to ±80°), and for azimuths ranging from 0° to 180°. The measurements were performed using 6 broadband filters (centered at 450, 550, 650, 750, 905 and 1064 nm).
The spectral imager MoHIS [9] was used to retrieve the spectral properties of the considered samples across the visible and near-infrared domains (from 380 nm to 2.45 μm), with a spectral resolution of 15 nm in the visible and 6 nm in the near-infrared. The samples surface were imaged at phase angles lower than 5°, by a CCD array and a SWIR camera. Both channels' acquisitions were assembled into hyperspectral cubes.
3. Overview of the results
The measured spectra of the pure end-members, plotted alongside one of 67P/Churyumov-Gerasimenko’ spectrum, are presented here in Fig. 1. Phase curves of the samples in the principal plane and at 550 nm, are presented in Fig. 2.
The JChC and SiO2 spectra distinguish themselves through their opposing behaviours (e.g. low vs. high reflectances, quasi-monotonic vs. slightly incurved profile). Additionally, the SiO2 spectrum presents several dips in reflectance across the near-inrared domain, consistent with hydration and hydroxylation features [10]. Moreover, this spectrum’s overall reflectance decrease beyond 1.35 μm is consistent with a scattering regime change within the sub- and micrometric-sized grains [11].
On the other hand, the JChc spectrum presents a slight reflectance dip around 1.1 μm, which together with a 3% H/C ratio exposed by a CHN elemental analysis, hint at the presence of polyaromatic compounds, similarly to certain bitumens [12].
While the spectra of these end-members differ from that of 67P/Churyumov-Gerasimenko (Fig. 1), we found that differences in spectral slopes in the 535 nm – 880 nm range disappear in part when considering the phase reddening phenomenon.
Measured phases curves were modeled using the “Hapke” photometric model [13, 14]. At 550 nm, the best-fitting model parameters verify the mentionned dichotomy (wSSA,JChc∼5.6% and pv,JChc∼3.8%, wSSA,SiO2∼97.5% and pv,SiO2∼1).
All phase curves present a non-linear reflectance surge at low-phase angles, albeit with varying intensities (Fig.2). This observation is also reflected in the modelisation of the opposition effect (B0,JChc∼1.4 and hJChc∼0.15; B0,SiO2∼0.6 and hSiO2∼0.07). The photometric properties of the intimate mixtures were found to be driven by the JChc fraction, and the geometric and bidirectional albedoes were found to be best-fitted by an exponential function.
Although neither the JChc or the SiO2 samples present best-fitting parameters matching those obtained for surfaces of comet 67P [14, 15], some of the intimate mixtures were found to be partially comparable to these surfaces as well as to other planetary surfaces.
4. Perspectives
We have investigated the spectrophotometric properties of the samples considered for the CoPhyLab sublimation experiment. We will detail the results of this study, and how they compare to small bodies of the solar system.
![Figure 1: Reflectance spectra of Juniper charcoal and SiO2 powders plotted alongside a spectrum from comet 67P’ surface presented in [16]. The bottom plot display the spectra normalised to their respective reflectance at 535 nm.](https://www.epsc2022.eu//_protected/abstractImages/292088-1-1.png)
Acknowledgments
This work was carried out in the framework of the CoPhyLab project funded by the D-A-CH program (1620/3-1 and BL 298/26-1 / SNF 200021E 177964 / FWF I 3730-N36).
References
[1] 10.1146/annurev-astro-081710-1025
[2] 10.1098/rsta.2016.0262
[3] 10.1016/j.icarus.2018.03.025
[4] 10.1063/5.0057030
[5] Lethuillier et al., 2021, Submitted.
[6] Feller et al., 2022, Submitted.
[7] 10.1007/s11214-019-0603-0
[8] 10.1016/j.pss.2011.07.009
[9] 10.1016/j.pss.2015.02.004
[10] 10.1029/2007JE003069
[11] 10.1016/j.icarus.2017.10.015
[12] 10.1006/icar.1998.5955
[13] Hapke, 1993, 978-0-521-88349-8
[14] 10.1093/mnras/stw2511
[15] 10.1093/mnras/stx1834
[16] 10.1126/science.aag3161
How to cite: Feller, C., Pommerol, A., Lethuillier, A., and Gundlach, B.: Cometary Physics Laboratory: spectrophotometric experiments, Europlanet Science Congress 2022, Granada, Spain, 18–23 Sep 2022, EPSC2022-1082, https://doi.org/10.5194/epsc2022-1082, 2022.
The ICAPS setup was flown in 2019 on the Texus-56 sounding rocket and its successor, the Laplace facility, is planned for a usage on the ISS in 2023. Both experiments allow to investigate the very first stages of planet formation. The relevant growth processes require observation of many-particle processes consisting of millions of µm-sized particles in a low-density gas environments (typical a few 10s of Pa, such that Knudsen numbers of >>1 are achieved) for prolonged time. The latter requirement make it necessary to perform these investigations in a microgravity environment. The ICAPS and Laplace setups allow to actively protect the dust cloud against diffusion and other external residual forces and also allow concentration of the dust cloud by means of a unique actively-controlled thermophoretic trap acting on all three axes.
Simultaneously, the dust cloud is made available to a number of observational instruments. As a whole, the cloud is observed in 3D from two perpendicular overview cameras while also making a small central volume of 1 mm² cross-section accessible to a dedicated long-distance microscope with high-speed imaging to facilitate non-destructive in-situ analysis of the growing dust aggregates. An extinction sensor allows to measure the extinction throughout the cloud as a whole. Measurements of the electric charges of the individual particles can be conducted repeatedly by means of a controlled DC or AC fields in order to determine charge and charge evolution.
We will present the design and techniques of the ICAPS and Laplace setups, the current status of the Laplace facility and demonstrate its capabilities on a few select data from the Texus-56 flight of ICAPS.
How to cite: von Borstel, I., Blum, J., Schräpler, R., Aktas, C., Balapanov, D., Vedernikov, A., Brisset, J., Molinski, N., and Schubert, B.: The ICAPS & Laplace experiments to investigate the initial stage of planet formation, Europlanet Science Congress 2022, Granada, Spain, 18–23 Sep 2022, EPSC2022-951, https://doi.org/10.5194/epsc2022-951, 2022.
Abstract
Understanding the composition of cometary nucleus will provide a direct link between present-day comets, KBOs, and Oort cloud objects and formation of cometesimals during the protoplanetary phase. We will understand whether cometary nucleus is primordial, and hence contain molecules of life. Our focus here is to derive compositional information of the nucleus of comet 67P-CG based on laboratory studies comparing with outgassing dichotomy of the comet, particularly that of CO2 and H2O and the corresponding minor volatiles.
Introduction
Interstellar ice grains and cometary outgassing have so much in common that it is hard to understand how such compositional similarity is preserved without the interstellar ice grains themselves preserved throughout the evolution of our solar system – from dense molecular clouds through protoplanetary disk to evolved solar system that has the cometary precursors – Kuiper Belt Objects and Oort Cloud.
While the link seems to be obvious, chemical evolution of ice grains in the protoplanetary phase is far from well understood. Particularly, if the ice particles were to cross the ice-line towards the protostar and sublimate leaving the refractory grains behind. It is hard to determine how similar composition is put together in the formation of cometary precursors and cometesimals. In addition to follow reaction pathways that could be used as tracers for the history of ice grain chemistry and transport, it is necessary to understand outgassing properties of long-period and short-period comets in order to correlate this outgassing to the physical and chemical composition of the nucleus through laboratory experiments and modeling. It is our goal to investigate and quantify the outgassing properties and dichotomy that is already noticed, but not yet fully understood.
Results
Here we present preliminary results from conventional temperature programmed desorption of ternary mixtures containing H2O, CO2, O2, and CO (Figure 1). While the first two are the major species resulting in mutually exclusive outgassing, of the last two super volatiles, O2 is predominantly correlated with H2O. Our laboratory data shows that excess CO2, O2, and CO that cannot be trapped into amorphous water ice, form separate ices at or below their individual condensation temperatures. Majority of this excess ice is sublimed at their respective pure ice sublimation temperatures. Some O2 and CO are trapped in the CO2 ice, which are seen to outgas along with CO2 sublimation. Keep in mind that in the mass spectrometer presented in Figure 1, contribution of CO due to fragmentation of CO2 is not removed. After completely outgassing aggregated ice other than H2O ice, amorphous to crystalline transition occurs around 120-140 K, during which almost all trapped volatiles (CO2, CO, and O2) within amorphous ice are released. The entrapment of these volatiles is also dependent on the starting ice composition. For example, when CO2 to H2O ratio is 1:3 vs. 1:1, more CO2 is trapped in H2O ice (Figure 1). However, we expect upper limit of CO2 trapping in H2O ice. When crystalline H2O ice sublimes, only a few percentage (< 3-5%) of the other volatiles are observed. Though the mixing ratio of our experiments is not exactly as it was observed by the Rosetta Mission, these data provide insight into the capacity of amorphous ice to trap other volatiles and sublimation temperatures of these volatiles forming pure ices. Our measurements are in qualitative agreement with earlier lab work (cf. Kouchi et al. 1994) though finer differences could be found, particularly around amorphous ice crystallization temperatures. Critical to the understanding of the ROSINA data from 67P-CG, is to use gas ratios in the lab comparable to the comet outgassing (Läuter et al. 2020) and vary the composition around this mixing ratio to determine the dependence of composition on sublimation properties. Keeping in mind that the ROSINA observed averaged outgassing of 67P-CG occurring from areas with very different illumination conditions, crystallization and sublimation seen in our experiments between 120 – 170 K seem to occur together in the observations. Future work includes further experimental work and comparison with observational data from Rosetta ROSINA instrument.
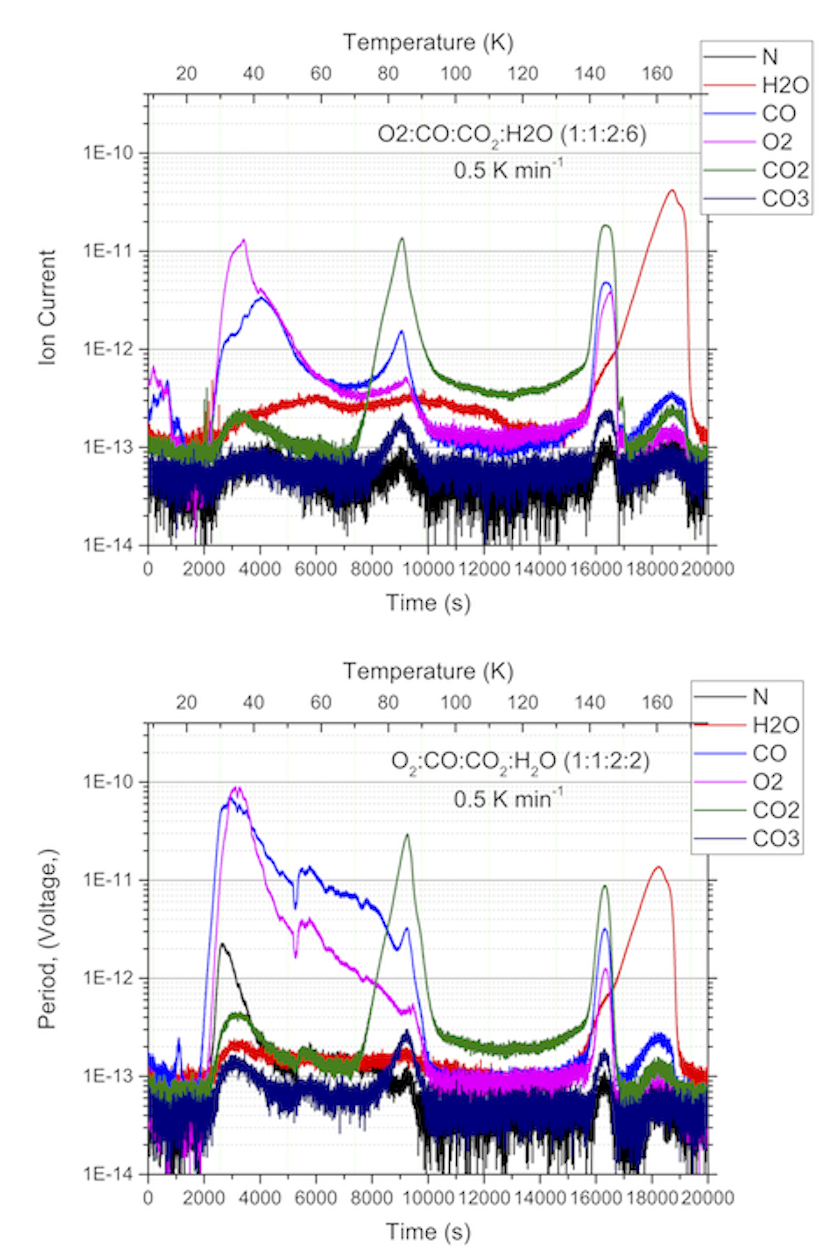
Figure 1: Laboratory data on outgassing properties of cometary ice analogs. It is evident that long-period comets originating from Oort cloud would have the significant outgassing of super volatiles, while short-period comets originating from KBOs and have gone through several orbits are depleted of these super volatiles, at least in the subsurface where the thermal equilibration could occur to temperatures beyond 80-100 K.
References
Kouchi, A., et al., A&A. 290, 1009-1018(1994)
Läuter, M., et al., MNRAS 498, 3995–4004 (2020)
Acknowledgements
This work was carried out at the Jet Propulsion Laboratory, California Institute of Technology, was under a contract with the National Aeronautics and Space Administration (NASA). Funding through NASA Discovery Data Analysis Program is gratefully acknowledged.
How to cite: Gudipati, M., Fleury, B., Rubin, M., and Altwegg, K.: Dichotomy of Cometary Outgassing, Europlanet Science Congress 2022, Granada, Spain, 18–23 Sep 2022, EPSC2022-334, https://doi.org/10.5194/epsc2022-334, 2022.
Abstract
Comet Interceptor is a Fast mission of the European Space Agency (ESA) conceived to study a long period comet.
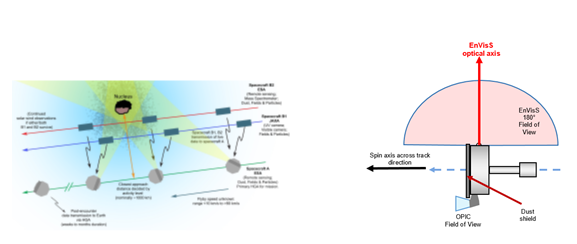
The mission concept includes a spinning probe venturing very near to the comet; on this probe, the Entire Visible Sky (EnVisS) camera will be mounted.
EnVisS is an intensity and polarimetric imager that will address several fields of cometary science by carrying out observations close to, and within a comet’s coma.
In this work, the instrument concept, design and scientific capabilities of EnVisS will be presented.
1. Introduction
The present Comet Interceptor mission configuration comprises a spacecraft and two probes. The spacecraft, called A, will make remote and in-situ observation of the target from afar. While the two probes, one provided by the Japan Aerospace Space Agency JAXA, called B1, and the other one provided by ESA, called B2, will venture near to the target performing a fly-by [1].
The B2 probe will be a spinning spacecraft, thus a rotational push-broom or push-frame imaging technique can be adopted for EnVisS to scan and image the whole scene around the spacecraft. Filtering strips mounted very near to the detector can be foreseen for studying the target in different wavelength ranges and performing polarimetric imaging.
EnVisS will map the intensity and the degree of linear polarization and polarization angle orientation of the light scattered by the dust particles in the comet coma with a full 180° phase angle coverage. The linear polarization depends on dust size distribution, morphology, porosity and composition [2]. The monitoring of linear polarization will provide some clues on how these parameters correlate.
2. Instrument acquisition concept
The EnVisS instrument has been conceived to work in the visible wavelength range from 550-800 nm. The extremely wide FoV of the instrument is designed to acquire the full sky.
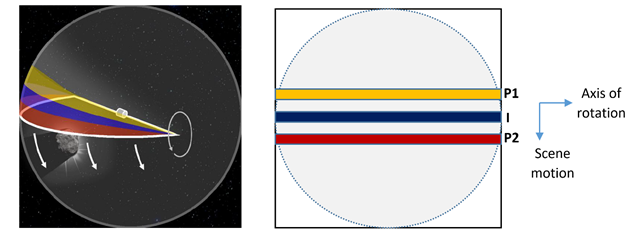
EnVisS will feature a flexible push-broom/push-frame imaging technique, while the probe rotates (see Figure 1) slices of the sky are acquired that will be later stitched together on-ground to form a full sky image.
(a) (b)
Figure 1: In (a) illustration of EnVisS full-sky imaging scanning concept. In (b) schematics of the filters strips images on the 2kx2k detector.
The probe spin-axis will be pointing to the comet nucleus for most of the time, except at the closest approach when the comet nucleus will fall inside the camera FoV (see Figure 2 for the expected geometry of the fly-by and the EnVisS placement on the B2 probe).
(a) (b)
Figure 2: In (a) expected B2 comet fly-by geometry in (b) placement of the EnVisS camera on the B2 probe.
3. EnVisS: Instrument Design
The EnVisS instrument is composed of different parts:
- a fish-eye lens, under study at the Leonardo S.p.A. company in Florence (IT);
- a commercial space-qualified detector from 3D-Plus [3], that will be equipped with a filter strip package;
- ad-hoc power and data handling units;
- software.
The design solution adopted for the filters in EnVisS allows for a compact, low mass and low complexity camera and avoids the use of a filter wheel. Each filter strip is covering a different area on the detector.
Three broad-band filters, all working in the same wavelength range, are foreseen for the camera:
- one broadband intensity filter positioned to be centered on the detector (see Figure 1b blue central strip I);
- two polarimetric filters with transmission axis angles oriented at 45° one to the other (see Figure 1b the red and yellow strips P1 and P2).
The EnVisS optical head will have a 3.45 mm focal length with an MTF of 70% at 45 lp/mm to match a 2x2 pixel resolution element. The full FoV of the instrument will be 180° in the direction of the spin axis, i.e. across-track direction, and 45° in the plane of rotation and motion of the scene, i.e. along-track direction. The full EnVisS characteristics are summarized in Table 1.
|
Wavelength coverage |
550-800 nm 1 broad band filter (I) and 2 polarimetric filters (P) |
|
Instrument FoV |
180°x45° (fixed full instrument instantaneous) 180°x360° (dynamic after image reconstruction) 180°x2° (instantaneous per each filter strip) |
|
Entrance aperture (F#) |
1.23 mm (2.8) |
|
Detector |
CMOS 2kx2k 5.5 micron px size |
|
Scale factor |
0.1°/px |
|
MTF |
>70% @ 45 lp/mm |
|
Distortion and telecentricity |
< 8% (f-theta distortion law) and <4° (at the FoV edges) |
Table 1 Summary of EnVisS characteristics
The direction of apparent motion of the scene due to the S/C B2 rotation, i.e. along-track direction, is parallel to the vertical direction in Figure 1 b, while the horizontal direction, corresponds to the direction of the spin axis.
A flexible approach has been devised to allow obtaining the required SNR of 10 for the broadband images and 100 for each polarimetric image. Depending on the target object activity, the map of the coma will be taken with different spatial resolution, i.e. smearing and pixel binning.
Along track, the signal from the coma is not expected to change too much, high spatial resolution is not required and smearing can be tolerated. The spatial resolution is retained in the across-track direction and assures a sampling of the comet phase function every 0.2°. This strategy will also allow for an adjustment of the exposure time if the radiance of the coma is different from expected.
Further pixel binning on-board, or co-adding, on-ground, of the images over different rotations, could be considered if the signal happens to be extremely low.
Acknowledgements
This work has been supported by the Italian Space Agency (ASI) through a contract to the Istituto Nazionale di Astrofisica (2020-4-HH.0) and by the State Agency for Research of the Spanish MCIU through the ‘Center of Excellence Severo Ochoa” award to the Instituto de Astrofısica de Andalucıa (SEV-2017-0709) and from project PGC2018-099425-B-I00 (MCI/AEI/FEDER, UE).
References
[1] Snodgrass, C. and Jones, G. H., "The European Space Agency’s Comet Interceptor lies in wait", Nat. Commun. 10, 5418 (2019).
[2] Fulle, M., Levasseur-Regourd, A. C., McBride, N. and Hadamcik, E., "In situ dust measurements from within the coma of 1P/Halley, The Astronomical Journal, 119:1968-1977 (2000).
[3] https://www.3d-plus.com/
How to cite: Da Deppo, V., Della Corte, V., Zuppella, P., Nordera, S., Pernechele, C., Lara, L. M., Castro, J. M., Jiménez, J., Martinez, I., and Praks, J. and the EnVisS Team: The Entire Visible Sky (EnVisS) imager for the Comet Interceptor ESA mission, Europlanet Science Congress 2022, Granada, Spain, 18–23 Sep 2022, EPSC2022-273, https://doi.org/10.5194/epsc2022-273, 2022.
Even if silicate glasses represent a major component in volcanic products, their spectral characteristics are not always considered when dealing with the interpretation of planetary and asteroidal surfaces and terrains. Space analogues described in spectral libraries are mostly constituted of crystalline materials rather than amorphous products. This happens because of the lack of spectral features of amorphous products, but this kind of blurred/featureless spectra are indeed observed on planetary surfaces, and, moreover, very recent studies have shown how amorphous phases can also deeply influence the spectral response of volcanic terrains [1]. For this reasons, the Petro-Volcanology Research Group at the University of Perugia (PVRG) have started an extensive investigation of the spectral response of silicate glasses.
PVRG group has chosen to reproduce in the lab, using experimental petrology tools such as high-temperature furnaces, volcanic glasses with complex chemical compositions mimicking the chemical variability of possible natural magmatic bodies. PVRG have used different techniques to characterize such silicate glasses: reflectance in the Visible and Near-Infrared (VNIR) [2], again reflectance in the Mid-Infrared Region (Mid-IR) [3] and reflectance and emissivity in the Thermal-Infrared Region (TIR) [4].

| Fig. 1: Series of VNIR spectra from glasses having compositions ranging between mafic and felsic, from [2] |
We have observed how different spectral techniques allow us to retrieve interesting correlations between change in spectral characteristics and chemical/textural composition. As examples, we have observed promising correlations between spectral slope/albedo and iron content and speciation of the investigated samples in the VNIR (Fig. 1), but also between silica and alkaline content and spectral shift/shape in the Mid-Infrared Region (Fig. 2). Moreover, it is observed how evolution of spectral shape in the MIR region carries interpretable and useful information on granulometry of the investigated terrains.
These findings suggest that accounting for glassy phases for the interpretation of planetary volcanic terrains is useful because i) it permits to distinguish which parts of the spectra carry information about crystalline phases and which not, and ii) glasses spectra carry themselves important information (iron, silica and alkaline content) that can be used to classify volcanic rocks and therefore to define geological history of planetary bodies. For these reasons, we want to offer a tool where such dataset can easily be observed and investigated.

| Fig. 2: Series of MIR spectra from glasses having compositions ranging between mafic and felsic, from [3] |
The ASI (Italian Space Agency) Space Science Data Center (SSDC) [5] is an infrastructure thought to archive open access data in the field of space sciences for different missions and purposes, and it operates using international standards such as those regarding Planetary Virtual Observatory [6] to maintain and disseminate data applying the FAIR (Findable, Accessible, Interoperable, Reusable) principles. Within SSDC infrastructure, we have created an environment to provide open access to this kind of data by creating a spectral database in which raw spectral data can be found together with the relative peer-reviewed publications in which such data are discussed. Up to now (May 2022) the database is only reacheable through the SSDC pages and with access restricted to people inside the group, but it is already planned to made the catalog completely public in a very near future, not excluding the possibility of making it available as a VO resource in a more advanced phase. Such environment will be explorable in the “Catalogs” list of the SSDC website (https://www.ssdc.asi.it/) under the name Spectral Database for Silicate Glasses with Natural Composition (Fig 3), where it will be possible to visualize, compare, and filter-search spectra, making it a fundamental tool for planetary scientists to account spectra of amorphous phases within their analyses of planetary surfaces.
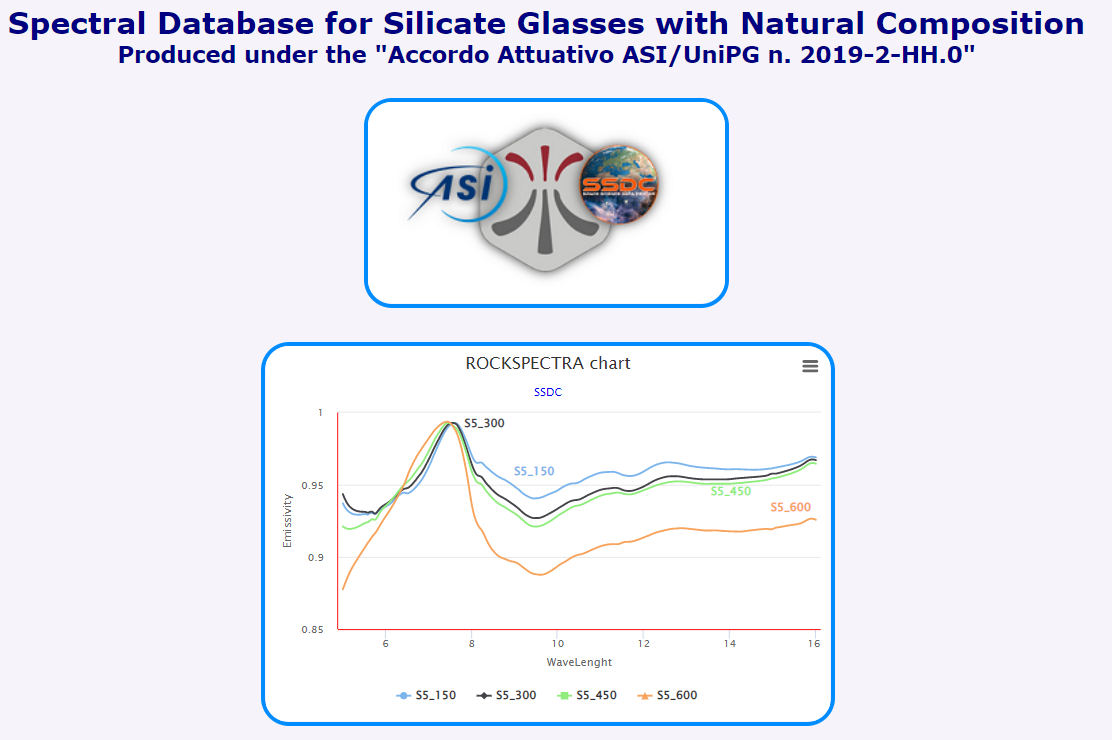
| Fig. 3: Screenshot of the Database's navigation. |
Acknowledgements
We acknowledge the support of ASI under the ASI-UniPG agreement 2019-2-HH.0.
References:
[1] Leight et al., 2022. Characterization of tephra deposits using VNIR and MIR spectroscopy: A comprehensive terrestrial tephra spectral library. Remote Sensing of Environment, 273, 112965.
[2] Pisello, et al., 2022. Visible and near-InfraRed (VNIR) reflectance of silicate glasses: Characterization of a featureless spectrum and implications for planetary geology. Icarus, 374, 114801.
[3] Pisello, et al., 2022. Reflectance of silicate glasses in the mid-infrared region (MIR): implications for planetary research. Icarus, under review.
[4] Pisello, et al., 2019. Retrieving magma composition from TIR spectra: implications for terrestrial planets investigations. Scientific reports, 9(1), 1-13.
[5] Zinzi et al., 2018. The SSDC contribution to the improvement of knowledge by means of 3D data projections of minor bodies. Advances in Space Research, 62(8), 2306-2316.
[6] Erard et al., 2019. Virtual european solar & planetary access (VESPA): a planetary science virtual observatory cornerstone. arXiv preprint arXiv:1907.06521.
How to cite: Pisello, A., Zinzi, A., Bisolfati, M., Porreca, M., and Perugini, D.: A new spectral database for silicate glasses: a fundamental resource to interpret characteristics of volcanic terrains on planetary bodies, Europlanet Science Congress 2022, Granada, Spain, 18–23 Sep 2022, EPSC2022-539, https://doi.org/10.5194/epsc2022-539, 2022.
In astronomy emission spectroscopy is widely used technique to study various objects. Although emission spectra of individual compounds are quite well known so composition of the studied body can be analysed the information on processes active in distant object can be encoded in the determined spectra as well. To decode such information the individual elementary processes need to be well understood. For example, in case of comets which are simple leftovers from the beginning of the Solar System understanding the connection between the coma and the comet’s nucleus is critical because observations rarely detect the nucleus directly, and its properties must often be inferred from measurements of the coma. As measurements of the coma do not necessarily represent the characteristics of the nucleus due to spatial, temporal and chemical evolution of the emitted material, projecting the coma observations back to the nucleus requires understanding of the processes in the coma. Within the Rosetta various instruments were used for spectroscopy. OSIRIS was equipped with several band filters that are commonly used in ground-based studies (Farnham et al. 2000). The spectroscopic measurements done within the Rosetta mission led to conclusion that electron-molecule processes play much more significant role than it used to be suspected in the past (Bodewits et al. 2016). This fact can be utilized to remotely study the plasma-chemical reactions active in distant objects. For example, the formation of excited OH by electron impact on H2O has an electron temperature threshold of 9.1 eV; H Ly-a has a threshold of 15.4 eV; and the production of OI 130.4 nm emission requires electron temperatures above 23.5 eV (Beenakker et al. 1974; Morgan & Mentall 1974). At electron temperatures below 10 eV, collisions with water molecules result in ro-vibrational excitation and energy is emitted in the IR range (Itikawa & Mason 2005). Electron impact emission thus provides a sensitive diagnostic probe for studying coma (Bodewits et al. 2019). The presence of spectral structures depends on reaching the threshold electron energy for specific transition. Emission cross sections that have thresholds of 10-100 eV – typical for the coma (Broiles et al. 2016) – depend strongly on electron impact energy. Knowledge of emission spectra and cross sections for electron-molecule reactions is critical for evaluation of physical-chemical properties of cometary coma based on spectroscopic observations. For thorough analysis of such studies a reliable database of reference spectra and emission cross sections must be available. Especially the availability of cross section data the Achilles’ heel since most of the values were determined only for a few individual energies but for successful application in models of atmospheres or comas they need to be known for wider range of energies.
Such data can be provided by laboratory experiments studying individual electron-molecule interactions in various experimental configurations such as crossed beams of electrons and molecules. The example of the apparatus scheme aimed at studying electron induced excitation reactions is shown in the figure. The electron beam generated by trochoidal electron monochromator collides perpendicularly with molecular beam created by effusive capillary. Photons emitted by excited reaction products are guided out of the vacuum chamber into the spectrometer equipped by CCD or photomultiplier detectors. The details of the experimental system were described elsewhere (Orszagh et al. 2017).
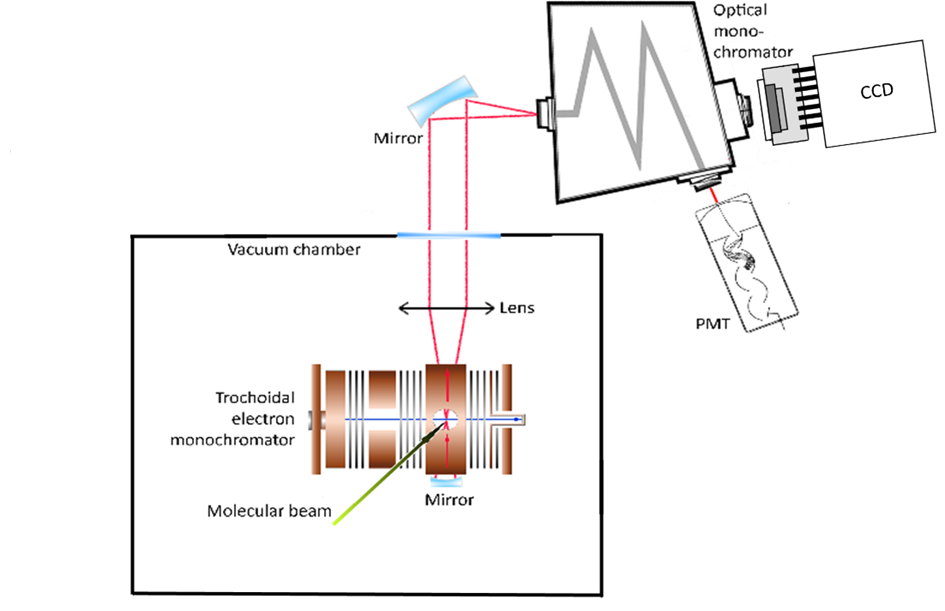
Fig. 1. Scheme of the experimental apparatus.
The main result of the experiment are the emission spectra (see second figure as an example) and emission cross section curves determined in precisely defined conditions. The shape of the spectrum given by population of individual ro-vibrational states and presence of individual spectral features depends strongly on excitation source and its energy (Bodewits et al. 2019).
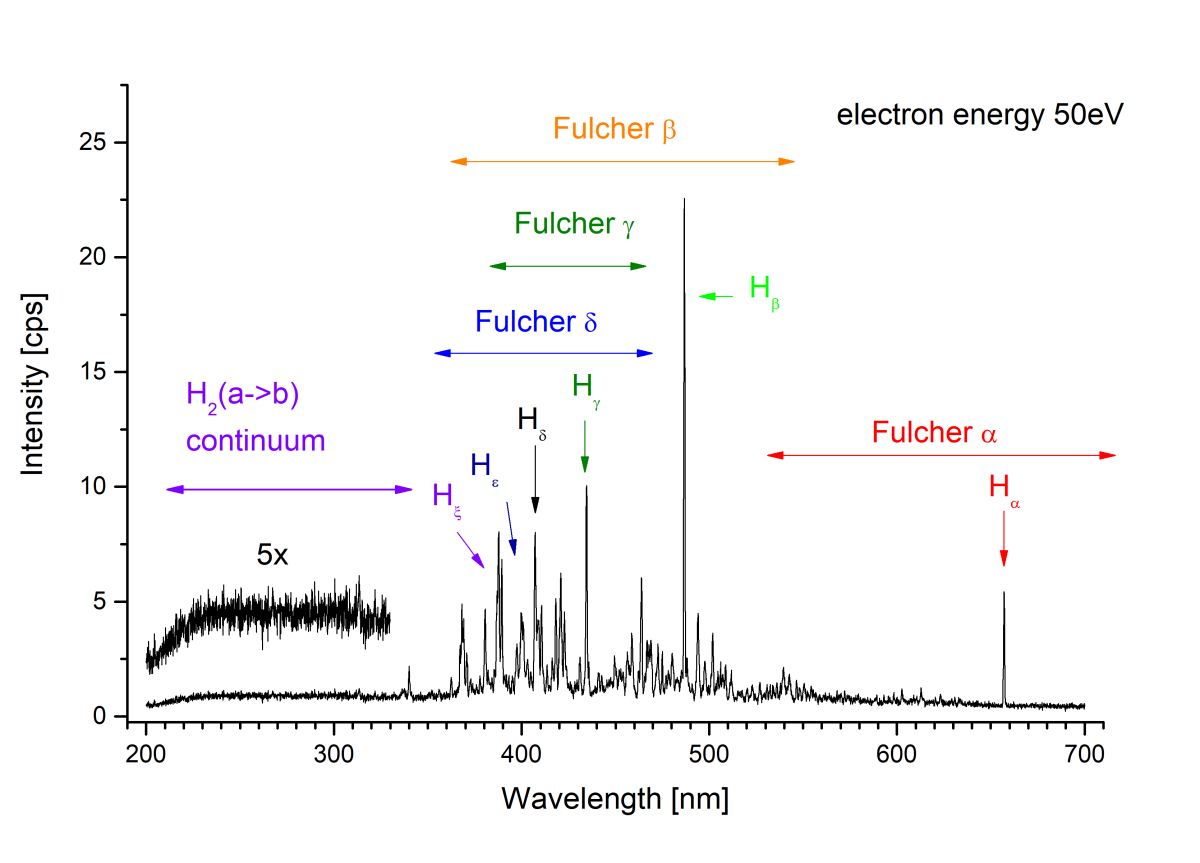
Fig. 2. Emission spectrum of hydrogen induced by 50 eV electrons impact.
From the relative cross section curves it is possible to determine the lowest kinetic energy (threshold energy) of the electrons necessary to create a specific excited product and after calibration to absolute values we get series of cross sections for individual electron impact energies. Below the threshold the spectral line or band will not be present in the spectrum. The third figure shows relative emission cross section of oxygen where two thresholds correspond to different processes generating excited oxygen atom.

Fig. 3. Relative emission cross section curve for oxygen atom.
By putting spectral and relative cross sections information together by measuring emission spectra at several electron impact energies we can get a surface formed by emission cross section values within selected range of wavelengths and electron energies (see the last figure).
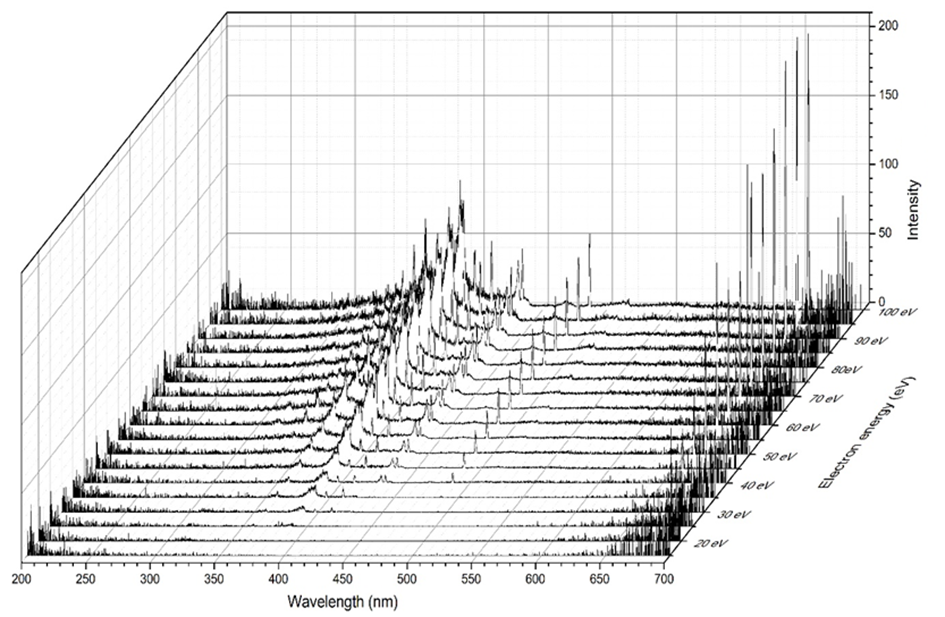
Fig. 4. 3D spectral map of emission induced by electron impact on pyridine.
Such complex information on the kinetics of electron-molecule excitation reactions is unfortunately rare mostly due to the technically demanding experiment but they provide valuable reference for analysis of astronomical spectroscopic data. Electron-molecule reactions in environment such as cometary comas or atmospheres can serve as a remote probe for characterization of local conditions if reference laboratory data on their kinetics are available.
Acknowledgments
This project has received funding from the European Union's Horizon 2020 research and innovation programme under grant agreement No 871149. This research was supported by Slovak grant agency VEGA within the projects nr. 1/0489/21 and 1/0553/22, by Slovak Research and Development Agency within project nr. APVV-19-0386, and by NASA ROSES project nr. NNH18ZDA001N-RDAP.
Beenakker, C.I.M. et al., 1974. Chemical Physics, 6(3), pp.445–454.
Bodewits, D. et al. 2016. Astronomical J., 152, 130.
Bodewits, D. et al., 2019. Astrophys. J., 885(167), p. 16.
Broiles, T.W. et al., 2016. Journal of Geophysical Research: Space Physics, 121 (8), pp.7407–7422.
Farnham, T.L., Schleicher, D.G. & A'Hearn, M.F., 2000. Icarus, 147, p.180.
Itikawa, Y. & Mason, N., 2005. Journal of Physical and Chemical Reference Data, 34(1), pp.1–22.
Morgan, H. D. & Mentall, J.E., 1974. Journal of Chemical Physics, Volume 60, Issue 12, pp. 4734-4739.
Orszagh, J. et al. 2017, Astrophys. J., 841(17).
How to cite: Orszagh, J., Stachova, B., Blasko, J., Matejcik, S., Bodewits, D., and Bromley, S.: Reference emission spectral data for astronomical observations, Europlanet Science Congress 2022, Granada, Spain, 18–23 Sep 2022, EPSC2022-950, https://doi.org/10.5194/epsc2022-950, 2022.
Analysis of the photopolarimetric observational data obtained for the surfaces of the Solar System bodies requires understanding of the light scattering mechanisms that are responsible for the optical opposition phenomena such as the intensity surge (IS) and the negative polarization (NP) branch [1,2]. The width of the IS and the slope of the intensity curve, the inversion angle of polarization and the position and the depth of the NP feature depend on the physical properties upper layer of planetary regoliths. Measuring intensity and linear polarization as functions of the scattering θ or phase angle α (α = π - θ) one can characterize them and extract the information about the complex refractive index of the material, particles size, packing density and the surface microtopography [1-3]. This is possible if an adequate theoretical model is applied.
We numerically study light scattering from clusters of densely packed irregular particles [4,5] with dimensions much larger than the wavelength. Such structures with bulk packing densities of ρ = 0.5 and numbers of particles up to 5000 represent a realistic model for planetary regoliths (Fig. 1a). The size parameters of constituents are kr = 10 - 30. The Discontinuous Galerkin Time Domain (DGTD) method is applied to obtain a full wave solution of the electromagnetic problem (Fig. 1b). Thus, we avoid many approximations used in the popular radiative transfer models. With a numerically accurate solution one can correctly account for the single-scattering phase function, single-scattering polarization properties of particles and near-field effects. The input parameters like particle size, complex refractive index and packing density are clearly defined in this case as well.
The results of simulation for large clusters of non-absorbing irregular particles demonstrate the role of high packing density for light transport and the backscattering phenomena. Light propagation becomes highly localized in this case and mimics a percolation process that is controlled by the topology and degree of disorder of the medium. The topological differences in the structure of the considered clusters can be seen in the intensity and polarization scattering angle curves [6].
In the case of low-albedo highly absorbing layers the total optical response is determined by the contributions of single and mostly double scattering in the very upper layer. At high bulk packing density, the incident light does not penetrate deeper than a few particle sizes (Fig. 1b) [7].
We can distinguish two sources of NP for bright and dark samples. Single non-absorbing particles comparable with the wavelength can produce strong NP feature which is suppressed by multiple scattering in a dense multi-particle system [6,8]. At high absorption it is double scattering between close neighbour particles that produces NP as a result of coherent backscattering [7,9]. The single scattering component is positively polarized in this case. In Fig. 1c the simulation result for a thick absorbing layer is compared with the polarimetric data obtained for an F-type asteroid 419 Aurelia [10] and a boron carbide powder with particle size d = 7 μm [11].

Acknowledgment. The authors gratefully acknowledge the computing time granted by the Paderborn Center for Parallel Computing (PC2) and by the John von Neumann Institute for Computing (NIC) on the supercomputer JUWELS at Jülich Supercomputing Centre (JSC).
References:
1. Shkuratov, Y., et al., (2002). Icarus 159, 396–416.
2. Levasseur-Regour A.-C., et al., (2015) In: Kolokolova L, Hough J, Levasseur-Regourd A-C (eds), Polarimetry of Stars of Stars and Planetary Systems. Cambridge University Press, pp. 62–80.
3. Videen, G., et al., Yatskiv Ya, Mishchenko M, eds (2004) Photopolarimetry in remote sensing, eds., NATO Science Series. Netherlands: Kluwer Academic Publishers.
4. Grynko, Y., et al., (2016). Opt. Lett. 14, 3491–3493.
5. Grynko, Y., et al., (2018). Opt. Lett. 43, 3562-3565.
6. Grynko, Y., et al., (2020). J. Quant. Spectrosc. Radiat. Transf. 255, 107234.
7. Grynko, Y., et al., (2022). Icarus 2022, in press.
8. Shkuratov, Y., et al., (2006). Quant. Spectrosc. Radiat. Transf. 100, 340–358.
9. Alhaddad, S., et al., (2022). Opt. Lett. 47, 58-61.
10. Belskaya, I.N., et al., (2005). Icarus 178, 213–221.
11. Ovcharenko, A.A. et al., (2006). J. Quant. Spectrosc. Radiat. Transf. 101, 394–403.
How to cite: Grynko, Y., Shkuratov, Y., Alhaddad, S., and Foerstner, J.: Light backscattering from numerical analog of planetary regoliths, Europlanet Science Congress 2022, Granada, Spain, 18–23 Sep 2022, EPSC2022-151, https://doi.org/10.5194/epsc2022-151, 2022.
Radiative transfer coherent backscattering (RT-CB) code [1,2] is extended to apply for dense discrete random media of optically soft spherical particles. This is achieved by utilizing the well-known static structure factor (SSF) correction derived from the Percus-Yevick approximation for sticky sphere pair correlation function [3]. The resulting dense medium RT-CB resembles to that of the standard RT-CB except the input parameters are modified with the SSF correction. The SSF correction accounts for the collective scattering and the interference effects arising from the correlated positions of particles in a dense medium.
We will verify the code against the numerically exact Fast superposition T-matrix method FaSTMM [4] for a small medium consisting of submicrometer-sized particles at optical wavelengths. We show that the SSF correction significantly improves the accuracy of the RT-CB solution for densely-packed systems of icy particles. Thus,the code may find application in analyzing phootometric and polarimetric observations of icy planetary bodies and dust.
Acknowledgements: This work has received funding from the European Research Council (ERC) - program grant CAstRA, agreement ID 757390.
References:
[1] K. Muinonen, 2004. Waves in Random Media 14(3), 365-388.
[2] T. Väisänen, et al, 2016. Abstract for 2016 URSI International Symposium on Electromagnetic Theory (EMTS), pp. 396-399.
[3] L. Tsang, J. Kong, K. Ding, O. Ao, Scattering of Electromagnetic Waves, Numerical Simulations, Vol. 2, 2001.
[4] J. Markkanen & A. Yuffa, 2017, Journal of Quantitative Spectroscopy and Radiative Transfer 189, 181-188.
How to cite: Markkanen, J.: Extension of RT-CB code to dense discrete random media, Europlanet Science Congress 2022, Granada, Spain, 18–23 Sep 2022, EPSC2022-793, https://doi.org/10.5194/epsc2022-793, 2022.
Background: Spectral observations in visual and near-infrared wavelengths are used to infer their surface material composition. Similar laboratory measurements of meteorites and various minerals and are used to link the known composition in laboratory measurements to asteroid composition.
However, many parameters in observations and measurements can introduce effects on the resulting spectra. With regolith-type powdered grains packed to a slab, the observing angles, particle size distribution, particle shapes, and space-weathering state of the material can all alter the spectra. Here, we try to model the particle size effects so that at least this effect could be understood when comparing different spectra.
Size effects in spectra: One can find spectral measurements of the same material but with varying size fractions in spectral databases such as RELAB (https://pds-speclib.rsl.wustl.edu/) and SSHADE (https://www.sshade.eu/). The typical spectral effects of different particle size are that the smaller particles are generally brighter, have redder slope, and deeper (absolute) absorption band depths. However, it is also possible to find counterexamples of different behavior.
Trend from light-scattering theory: If we limit to optically large particles (several times larger than the wavelength) and assume that different particle sizes are simply scaled versions of one particle, the particle size effects in spectra can be understood as interplay between surface reflections and absorption in the volume. If we assume that the surfaces are flat in the wavelength-scale, the surface reflections follow Fresnel reflections. For light that is refracted from the surface into the homogeneous material, the Beer-Lambert absorption gives the attenuation in the volume.
The Fresnel-type reflections do not absorb and are also only weakly dependent on the imaginary part k of the complex refractive index of the material, m=n+ik. The Beer-Lambert absorption, on the other hand, is only dependent on k and the distance traveled in the material, d. If the same volume is divided into smaller particles, typical d in the material between air-surface or surface-air interfaces and reflections or refractions from these is decreasing. Since absorption is taking place only in the volume, the increased surface reflections are increasing the brightness. This is the simple mechanism behind increasing brightness with decreasing particle size. At the same time, the exponent-term in the Beer-Lambert absorption affects so that similar change in d in the particle for a bright material has larger effect than the same d in darker material. This means that the absorption band depths are also increasing, in absolute units, when particle size is decreasing.
The possible increase of red slope with decreasing particle size in spectra cannot be explained with optically large particles. The longer wavelengths are ‘seeing’ the distances inside the particles shorter, but the effect is quite small for particles that are several times larger than the wavelength. However, if the sample also includes wavelength-scale particles, these are relatively more abundant in smaller size fractions and can introduce a red slope. This is because the scattering efficiency of particles increase when they reach wavelength-scale whereas for optically large particles it is constant.
Numerical modeling: We will verify and quantify the abovementioned theoretical trends with numerical simulations. We use a two-fold scheme where we first simulate the single-scattering properties (single-scattering albedo and the phase function) of individual random particle shapes, and then simulate the multiple-scattering effect in a packed slab of these particles.
We model the particles with a Voronoi cell particle model, see Fig. 1. In this model, a large volume is first filled with random seed points. Then, a 3d Voronoi division is done on the points, resulting the volume to be divided into Voronoi cells having flat surfaces and sharp corners. Finally, single cells are extracted from the volume, except the cells close to the edge of the volume to avoid edge-effects.

The light-scattering properties of single Voronoi particles are computed using a geometric-optics ray-tracing code SIRIS (https://bitbucket.org/planetarysystemresearch/siris4-framework/). These computations are run for 200 realizations of the particle model and changing the size parameter (physical size divided by the wavelength) and the real and imaginary parts of the refractive index. The results are averaged over the particle shape realizations.
The single-particle properties are fed into the Monte Carlo radiative transfer code RT-CB (https://bitbucket.org/planetarysystemresearch/rtcb_public/) where the amount of reflected light from a large slab containing the single particles is computed. This gives us the brightness as a function of particle size, wavelength, and real and imaginary parts of the refractive index.
Preliminary results: We have a grid of size parameters and refractive indices computed, and the results are consistent with what we expected from the simple theory of the changing ratio of surface reflections to volume absorption. We can, for example, plug in a typical behavior of the imaginary part of olivine as a function of wavelength, keep the real part of the refractive index constant for simplicity (it does not change much in visual/near-infrared wavelengths), and plot the spectra of different-sized olivine particles, see Fig. 2.

Conclusions and future work: Currently, we are increasing the parameter grid to include both smaller size parameters and smaller imaginary k values. From the results we have, it seems that we can fit an analytical function to the results with quite small prediction errors. If successful, this analytical model can be used to model the size effect on the reflectance spectra of particulate materials if the particles are clearly larger than the wavelength. If we can model, we can also remove the effect if we know the particle sizes and receive size-standardized spectra that can be better compared between the samples.
As a side product, we can use this data and the model to invert the imaginary part of the refractive index for materials from which we have reflectance spectra measurements and the particle size.
How to cite: Penttilä, A., Martikainen, J., and Muinonen, K.: Modeling the effect of particle size distribution on spectra for optically large particles, Europlanet Science Congress 2022, Granada, Spain, 18–23 Sep 2022, EPSC2022-415, https://doi.org/10.5194/epsc2022-415, 2022.
Introduction: This study is focused on the investigation of the reflected solar light on planetary atmosphere-less bodies, as a function of the viewing geometry (direction of the solar light and direction of the ob-server with respect to the normal to the surface, identifying angles named respectively incidence and emission, and the relative angle between them, named phase). In particular, we focus on the photometric properties of large-scale roughness (hereafter referred to as roughness), which, being not spatially resolved, can be only derived by photometric models. The investigation of the photometric response as a function of roughness is mandatory to disentangle properties of the surface regolith such as albedo, porosity, and thermal inertia (the latter when thermal emission data are avail-able). Moreover, the information on the roughness can be important by itself for interpretation of the geological and physical processes in place, or for engineering use in a case of a landing site selection.
Photometric Models: Among the interpretative physically-based models describing the reflection of the light from surfaces, Hapke [1] theory is among the most used in literature, thanks to its completeness in the description of the surface, and the practicality of use, being an analytical model. According to Hapke, a rough surface can be described as a collection of facets, each with a certain slope (θ), in a way that the distribution of slopes is completely identified by a unique parameter (the Mean Slope θ). Random Gaussian and fractal terrains are well-represented by the slope distribution described by Hapke’s theory. This is the case with several minor bodies, targets of recent space missions (e.g., [2]). Hapke developed an analytic formulation to include the effect of the roughness into a general relation describing the reflectance of planetary surfaces, which is a function of several photometric parameters. However, some authors, including Hapke himself, have high-lighted some limitations of this formulation: (i) the parameter that describes roughness is derived in theory only for small angles of the slope of the facets relative to the average surface. This prevents reliable derivation of roughness for more general conditions [1]; (ii) unresolved shadows and self-illumination can affect the overall reflected signal, and if not accurately modeled, can be confused with albedo variation (e.g., [3]). In Hapke’s theory, the dependence of these contributions on observation geometry is treated by means of simpli-fied approximations.
An improved approach to the study of rough surfaces has been proposed to overcome the above issues [4]. It consists of a statistical approach in which N unresolved facets, each one having its own viewing geometry, are generated. The integrated resulting signal corresponding to these facets is calculated starting from the response of all facets visible to the observer. This statistical-multi-facets algorithm (SMFA) also takes into account the self-illumination and shadows projected along the observer's line of sight, so that the photometric response is not calculated through analytical ap-proximations, but with the sum of each of the N facets that describe the simulated terrain (see Fig. 1).
Roughness retrieval: We investigate the properties of spatially resolved roughness of the dwarf planet Ceres and comet 67P from their shape models, derived by Dawn/NASA and Rosetta/ESA data. From this, we infer the possibility to safely apply the above-mentioned models for retrieval of non-resolved roughness. The latter is performed by the comparison of signals of the surface detected in different viewing geometries. We discuss results coming from both Hapke model and the statistical multi-facets algorithm.

Figure 1. An example of the different output between SMFA and Hapke’s models: S = shadowing function, µ0eff = effective incidence angle cosine, µeff = effective emission angle cosine. All these parameters are used by the Hapke formulation, and they are functions of the Mean Slope (θ) parameter. In this example, the incidence, emission, and phase angles are fixed respectively to 30°, 0°, 30° [4].
References:
[1] Hapke, Theory of Reflectance and Emittance Spectroscopy, 1993
[2] Davidsson et al., Icarus, 252, 2015
[3] Cuzzi et al., Icarus, 289, 2017
[4] Raponi et al., 14th EPSC 2020, id. EPSC2020-761
How to cite: Raponi, A., Ciarniello, M., Filacchione, G., Capaccioni, F., De Sanctis, M. C., and Frigeri, A.: Roughness of planetary surfaces: Hapke theory and statistical multi-facet algorithm applied to dwarf planet Ceres and comet 67P data, Europlanet Science Congress 2022, Granada, Spain, 18–23 Sep 2022, EPSC2022-547, https://doi.org/10.5194/epsc2022-547, 2022.
Comet 67P/C-G is a dusty object. As it neared its closest approach to the Sun in late July and August 2015, instruments on Rosetta recorded a huge amount of dust enshrouding the comet. This is tied to the comet’s proximity to our parent star, its heat causing the comet’s nucleus to release gases into space, lifting the dust along [10]. This disturbed, ejected material forms the ‘coma’, the gaseous envelope encasing the comet’s nucleus, and can create a beautiful and distinctive tail.
A single image from Rosetta’s OSIRIS instrument can contain hundreds of dust particles and grains surrounding the 4 km wide comet nucleus. The study of the dust behaviour is vital for understanding the global evolution of the comet and has direct consecuences in the research of the origins of the solar system. [1]
A simple image of the OSIRIS instrument can contain hundreds of dust and grain particles around a 4km sphere around the core. The images above show the level of complexity when processing an image. Partly, most image sequences are processed manually [5]
There is no universal method for calculating dust trajectories in comets [7]. To date, studies have been carried out on:
- Trajectories close to the surface of the comet [2]
- Calculation of trajectories through parallax between two cameras on board Rosetta [13], [15], [16]
- Orbital determination for long periods of time [11]
To determine dust trajectories, neither of these methods would work individually, but a combination of them could be effective. Using the satellite's displacement as a parallax source the position and velocity could be determined if the particle remains long enough in the camera's field of view.
The biggest drawback is the large number of false positives (stars, cosmic rays, etc ...) that make real detections difficult.
We will present a method of calculating the trajectories with ImageJ [7] and SPICE [9]
BIBLIOGRAPHY
[1] Fulle et al 2016 [2] Agarwal et al 2016 [3] Guttler et al 2016 [4] El Maary et al 2017 [5] Guttler et al 2017 [6] Timenez et 2017 [7] Chenuard N et al 2014. [8] Bertini et al 2015 [9] DOI: 10.5270/esa-tyidsbu [10] Blum et al 2015 [11] Davidsson et al 2016 [12] Bertini et al 2017 [13] Drolshagen & Ott et al 2017 [14] Davidsson et al 2015 [15] Drolshagen et al 2017 [16] Ott et al 2017 [17] Ott (IMC 2016) [18] Pfeifer et al 2022
How to cite: Marín-Yaseli de la Parra, J., Kueppers, M., Roger, J., and Osiris Team, A. T.: Analysis of a particle in the surroundings of 67P using ImageJ, Europlanet Science Congress 2022, Granada, Spain, 18–23 Sep 2022, EPSC2022-789, https://doi.org/10.5194/epsc2022-789, 2022.
Among three fundamental properties of electromagnetic waves (intensity, frequency, and polarisation), polarimetry of cometary dust examines the last properties of scattered light by measuring the degree of linear polarisation (P) of the dust, which sensitively reflects its physical and compositional profiles. P-dependences of the dust on phase angle and wavelength often offer a convenient tool to diagnose the dust environment and thus compare the relative primitiveness of comet nuclei in various dynamical groups.
This presentation will report our new near-infrared (over the J and H bands) spectropolarimetric study of Oort-cloud comet C/2020 T2 (Palomar) using a newly commissioned low-resolution spectropolarimetry mode of the Wide-Field InfraRed Camera (WIRC) on the Hale Telescope at Palomar Observatory. We observed this comet (hereafter T2) at a phase angle of 28.5 deg around two weeks before perihelion in June 2021. T2 has a relatively far perihelion distance (~2 au) and low orbital inclination (~28 deg) compared to other well-studied bright Oort-cloud comets like C/1995 O1 (Hale-Bopp) and 1P/Halley. We found the coma morphology of our target is spherical and centrally condensed, without a detectable tail of small-sized dust particles along the anti-solar direction that is otherwise typical of the Oort-cloud comets around perihelion. We also noticed slightly different behaviours of T2 in the polarimetric colour and phase curve from those of other Oort-cloud comets observed at similar observing geometries. P shows excess at ~1.6 sigma level around 1.65 micrometres, a diagnostic wavelength of crystalline water ice, at the cometocentric distance of r = 845 km but vanishes in the outer coma at r = 1140 km.
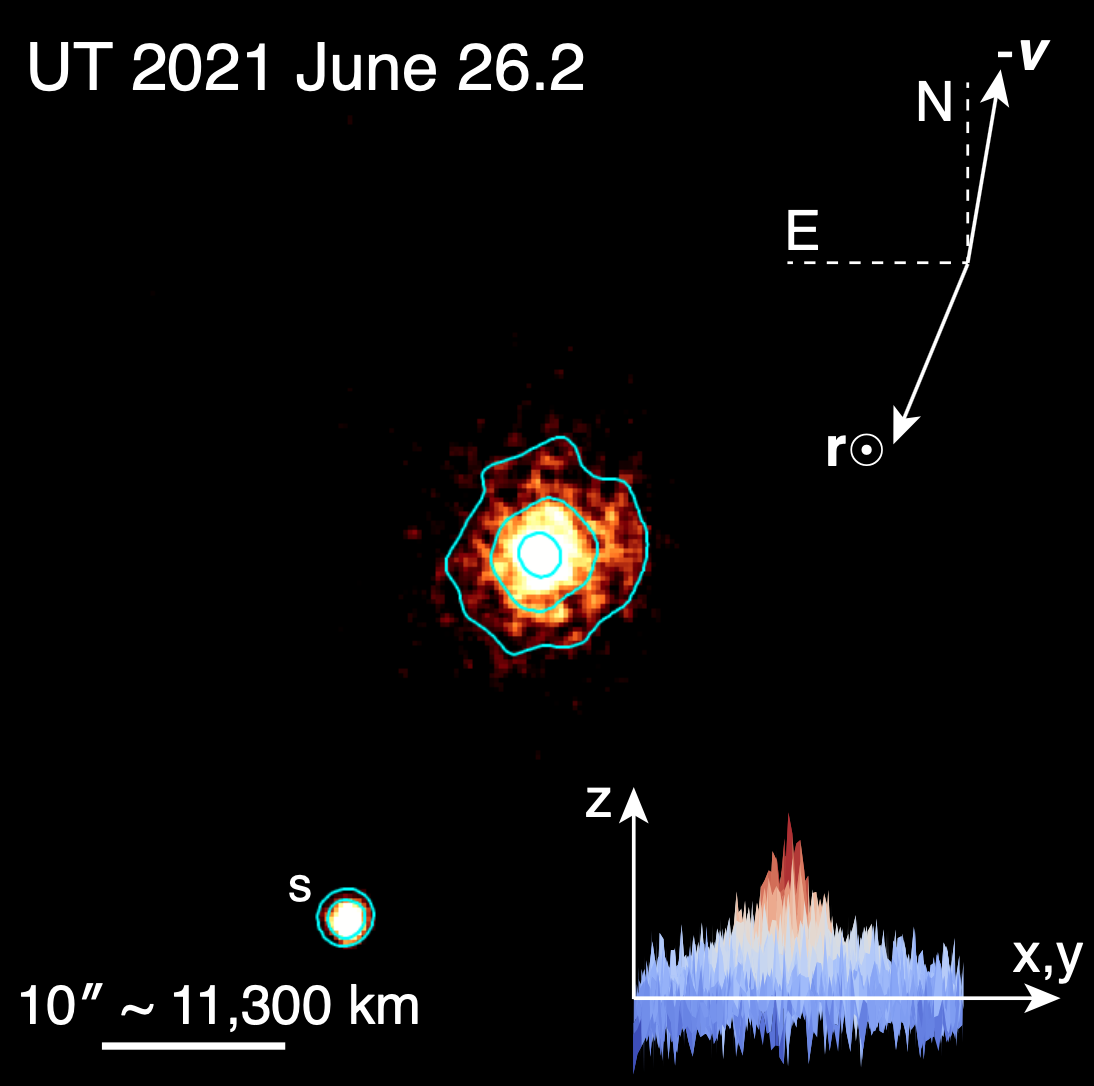
To constrain the physical properties (particularly size and porosity) of T2's dust particles dominant in its coma, we first numerically simulated the light scattering of the dust using the radiative transfer with reciprocal transactions method (R2T2). The retrieved information was then incorporated into the dynamical modelling to reproduce the observed coma morphology of T2 at the observing epoch and thus provide a plausible range of dust characteristics of interest. Finally, we investigated a possible connection between the polarimetric and dynamical properties of Oort-cloud comets whose dust continuum has ever been observed in polarimetry. We discussed whether any gradients embedded in the Oort-cloud structure could be recognised by polarimetry (and vice versa) and which insights we learn for comet evolution from the resultant relationship between the two properties of the dust.
How to cite: Kwon, Y., Masiero, J., and Markkanen, J.: Near-infrared spectropolarimetry of Oort-cloud comet C/2020 T2 (Palomar): Can polarimetry reflect any gradients in the Oort cloud?, Europlanet Science Congress 2022, Granada, Spain, 18–23 Sep 2022, EPSC2022-190, https://doi.org/10.5194/epsc2022-190, 2022.
Abstract
We present the results of complex (photometric, spectral, and polarimetric) observations of hyperbolic comet C/2013 X1 (PANSTARRS) obtained at 6-m telescope BTA on November 4, 2015. Color and dust productivity was estimated from photometrical and spectral data. Distribution maps of intencity and degree of the linear polarization were constructed. Analysis of morphology showed a non-uniform structure of the dust coma. Emission features of several molecules were detected in the cometary spectrum.
1. Introduction
New comets, coming from the Oort Cloud at their first passage close to the Sun, are particularly important because their matter is supposed to contain primordial material not differentiated by the Solar radiation. Comet C/2013 X1 (PANSTARRS) is a hyperbolic comet, that firstly came into the inner parts of the Solar system. It was discovered on December 4, 2013 by the Panoramic Survey Telescope and Rapid Response System (Pan-STARRS) 1 telescope on Mount Haleakala. C/2013 X1 reached a perihelion distance of 1.314278 AU on April 20, 2016. We present the results of preperihelion observations using broadband photometrical, long-slit spectral, and broadband polarimetric methods. Such complex analysis allows us to study more precisely the dust and gas components of the comet.
2. Observations
The observations of comet C/2013 X1 were carried out on November 4, 2015, before the perihelion passage when the heliocentric and geocentric distances of the comet were 2.66 au and 1.78 au, respectively, and the phase angle was 12.29°. The multimode focal reducer SCORPIO-2 [1, 2] attached to the prime focus of the 6-m Big Telescope Altazimuth (BTA) was used. The observations of the comet were conducted in the packet mode, which allowed us to make a sequence of exposures to obtain direct CCD images, spectra with a long-slit, and imaging linear polarimetry. We used the CCD chip E2V-42-90 with 2K × 2K square pixels of 16 µm corresponding to 0.18ʹʹ on the sky plane without binning.
Photometry and polarimetry of comet C/2013 X1 were performed through the g-sdss (the central wavelength λ0 and FWHM are λ4650/1300 Å) and Johnson-Cousins R (λ6400/1580 Å) broadband filters, respectively.
We derived spectra of the comet with a long-slit mask using the transparent grism VPHG1200@540 as a disperser in the spectroscopic mode of the SCORPIO-2. The slit of 6.1 arcmin × 1.0 arcsec was placed on the nucleus position in the sky and oriented along the velocity vector of the comet. The obtained spectra covered the wavelength range 3600–7070 Å.
3. Results
Photometry. We estimated the dust productivity using the Afρ parameter. It was about 1500 cm. The comet demonstrated typical red colour, based on V-R calculated value. To reveal the low-contrast structures in the dust coma, we constructed an intensity map of comet C/2013 X1 using digital filters (Fig. 1).
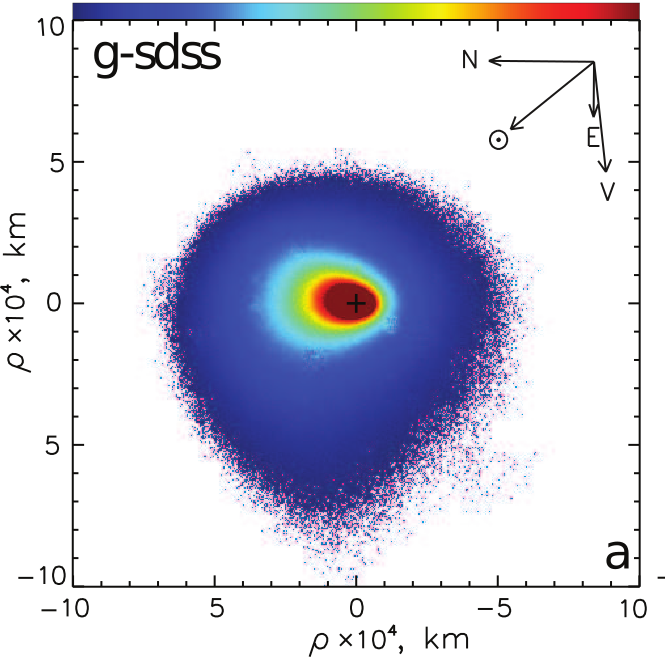
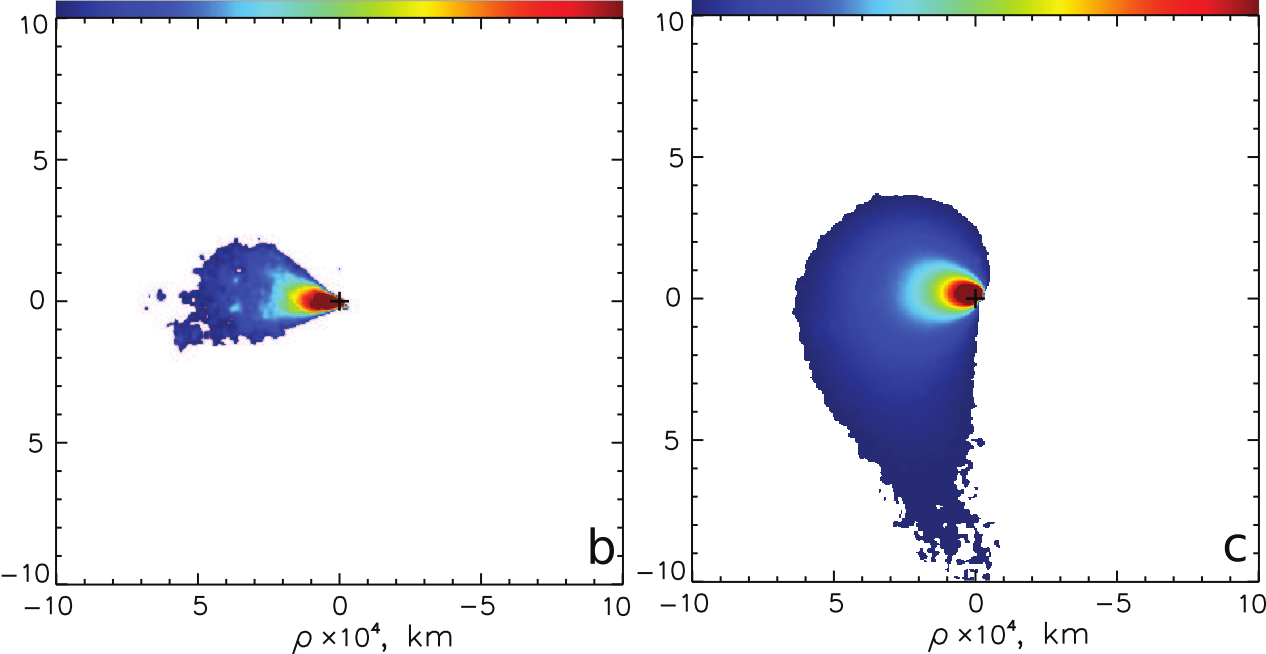
Figure 1: Intensity maps of comet C/2013 X1 (PANSARRS). (a) direct image of the comet; with using digital filters: (b) a rotational gradient method [4], and (c) division by 1/ρ profile [5].
Based on the distribution map of intencity, we derived the radial profiles of the surface brightness for observed structures to describe the dust brightness as a function of the distance from the optocenter. The profiles demonstrate slopes differed from the value -1, which corresponds to the case of a steady and isotropic emission of long-lived grains.
Polarimetry. We obtained the degree of linear polarization for comet C/2013 X1. It is distributed non-uniformly over the cometary coma. The value of linear polarization degree variates from -1.1% to -3.2%. It is clearly seen differences between the polarization of cometary structures. Changes in polarization degree are indicative of different properties of dust particles in various parts of the comet. We have also made profiles of the linear polarization of the comet in the direction with the jets structures and the quiet coma.
Spectroscopy. We analyzed a cometary spectrum in the wavelength region of 3800-7100 Å. Despite the heliocentric distance of 2.66 au, we detected significant gas emission lines in the spectrum. The strongest features belong to molecules of CN, C2, C3, and NH2.
Gas production ratios were calculated for all detected molecules using the Haser model [3]. Also, we estimated the gas contribution in wavelength regions corresponding to filters used for photometric and polarimetric studies. To compare with photometrical results we also computed a colour slope value based on the spectral data. The results from both methods are in good agreement.
Acknowledgments
The research is supported by the Slovak Academy of Sciences (grant Vega 2/0059/22). This work was supported by the Slovak Research and Development Agency under the Contract no. APVV-19-0072. Data analyzed in this work was obtained by V.L.Afanasiev.
References
[1] Afanasiev, V. L., & Moiseev, A. V. 2011, Balt. Astron., 20, 363
[2] Afanasiev, V. L., & Amirkhanyan, V. R. 2012, Astrophys. Bull., 67, 438
[3] Haser L. (1957) Bull. Soc. R. Sci. Liege, 43, pp. 740-750
[4] Larson, S. M., & Sekanina, Z. (1984), AJ, 89, 571
[5] Samarasinha, N. H., & Larson, S. M. (2014), Icarus, 239, 168
How to cite: Shubina, O. and Ivanova, O.: Complex study of hyperbolic comet C/2013 X1 (PANSTARRS), Europlanet Science Congress 2022, Granada, Spain, 18–23 Sep 2022, EPSC2022-216, https://doi.org/10.5194/epsc2022-216, 2022.
Introduction
Only two interstellar objects have been observed passing through our Solar System to date. The first one, 1I/‘Oumuamua, discovered in 2017 in its post-perihelion phase, showed mostly asteroidal characteristics with some potential evidence of comet-like behaviour, but 2I/Borisov has showed clear evidence of comet activity since its discovery in 2019, prior to its perihelion passage in December of that year. This made it the first confirmed interstellar comet, so naturally many different observations were conducted by astronomers around the world to learn more about the peculiar object.
Methodology
In this work we present the analysis of polarimetric observations of the interstellar comet 2I/Borisov conducted with the FORS2 instrument located on the European Southern Observatory's Very Large Telescope Unit 1 (Antu). A series of polarimetric observations was performed between December 2019 and March 2020 using three different broadband filters in the visible regime in order to ascertain the physical characteristics of the coma dust particles.
Results & Conclusions
We find that polarisation of 2I/Borisov is higher than is usually measured for Solar System comets. This distinguishes the interstellar comet from all dynamically evolved comets in our Solar System. This evidence of 2I/Borisov being more pristine than the observed Solar System comets is corroborated by the fact that the comet with the closest polarimetric properties is C/1995 O1 (Hale–Bopp), which is believed to have approached the Sun only once before its apparition in 1997. Furthermore, and unlike both Hale–Bopp and many other comets, interstellar comet 2I/Borisov shows a polarimetrically homogeneous coma, unchanging with cometocentric distance, again suggesting it is even more pristine than the observed comets from our own Solar System. It is thus likely that it has never passed very close to its native star.
How to cite: Bagnulo, S., Cellino, A., Kolokolova, L., Nežič, R., Santana-Ros, T., Borisov, G., Christou, A., Bendjoya, P., and Devogèle, M.: Unusual polarimetric properties for interstellar comet 2I/Borisov, Europlanet Science Congress 2022, Granada, Spain, 18–23 Sep 2022, EPSC2022-1111, https://doi.org/10.5194/epsc2022-1111, 2022.
Comets formed from the material surrounding the young Sun, about 4.6 billion years ago. After their formation, the nuclei were scattered and stored in their current reservoirs [1,2], where they remained mainly unaltered, preserving most of the chemical and physical properties linked to their formation site.
Cometary nuclei contain a mix of various silicates (mainly olivine and pyroxene that can be found in the amorphous and/or crystalline form), organic refractory material and other minor elements [3]. Comet dust appears different from comet-to-comet, and partially different from the one observed in the interstellar medium [4]. These differences may correlate in principle with some of the processes that were in act in the protoplanetary disc at the time and in the region where the nuclei formed. A detailed study of the cometary dust can thus improve our understanding of the formation and evolution of matter in the early Solar System, and test the most recent theoretical models of cometary nuclei [5].
Mid-infrared spectroscopy in the wavelength range between 7 to 40 μm can give information on the temperature and chemical compostition of the dust, and help inferring dust grains size and structure [3,4,6]. Spectral maps of active comets in this spectral range allow measurements of the chemical and temperature variations within a large portion of the coma. If observed, these fluctuations can be in principle associated to different processes (e.g., fragmentation processes), and can help to put some constraints on the physical properties of the observed dust, more stringent than the ones retrieved just observing in proximity of the nucleus.
The coma of 67P was mapped with the InfraRed Spectrometer (IRS) on board of the Spitzer telescope between the 28thand 30thof November, 2008. At the observing epochs, the comet was at about 1.65 au from the Sun and about 1.00 au from the spacecraft. The maps were taken using both the short-wavelength (7-14 μm) and the long-wavelength (14-38 μm) IRS spectrometers.
We reduced the data using the official pipeline CUBISM [7] that performs all the basic reduction and calibration steps (i.e., background subtraction, bad pixels removal, flux calibration for extended sources comprising aperture correction and slit loss correction). The spectral cubes produced by CUBISM were re-sampled to eliminate some residual aliasing effects resulting from the reduction process, and spectral cubes from different settings (short and long wavelengths) were combined together. In this way, we were able to extract the full 7-38 μm spectrum for each pixel in a FOV of about 27”x38”.
In general, we observe smoothed spectra and no signs of crystalline silicates; we identify clearly an amorphous silicate band around 11 μm. Smoothed spectra could be indicative of a low abundance of crystalline silicates or related to the presence of larger and/or less porous dust grains in the coma. The thermal analysis of the extracted spectra, performed with the model developed by [8], do no show any particular temperature variation, nor visible signs of fragmentation. Finally, we investigated the coma morphology, searching for the presence of jets and/or anisotropies.
Acknowledgements: This work has received funding from the European Research Council (ERC) - program grant CAstRA, agreement ID 757390. Data were downloaded from the Spitzer Heritage archive, and collected under the program ID 50022, ’Creating Synergy Between Spitzer and Rosetta: The Coma of Comet 67P’, PI - M. Kelley.
References: [1]. Gomes, R., et al., 2005, Nature, 435, 446 – [2]. Morbidelli, A., et al., 2007, AJ, 134, 1790 – [3]. Hanner, M. S., 1999, Space Science Reviews, 90, 99 – [4]. Wooden, D. H., et al., 2017, Phil. Trans. R. Soc. A 375 – [5]. Ciarniello, M. et al., 2022, Nat. Astron., 262 – [6]. Kelley, M. S. & Wooden, D. H., 2009, Planetary and Space Science, 57, 1133, and ref. therein – [7]. Smith, J. D. T., et al., 2007, PASP, 119.1133S – [8]. Markkanen, J. & Agarwal, J., 2020, A&A, 643, A16.
How to cite: Lippi, M., Markkanen, J., and Agarwal, J.: Spitzer-IRS spectral maps of 67P/Churyumov-Gerasimenko, Europlanet Science Congress 2022, Granada, Spain, 18–23 Sep 2022, EPSC2022-503, https://doi.org/10.5194/epsc2022-503, 2022.
Remote observations of the light scattered by cometary comae make it possible to constrain the physical properties of the dust particles lifted into the comet atmosphere. Ground-based photometric and polarimetric observations of the light scattered by comet 67P/Churyumov-Gerasimenko (67P) present a unique opportunity to directly compare remote measurements to those performed in-situ by the ESA/Rosetta mission. The polarisation of the light scattered by cometary dust varies as a function of phase-angle (the Sun-comet-Earth angle), as well as properties of the dust particles: their size, structure and composition. Therefore, our polarimetric maps can be used to monitor the spatial and temporal evolution of the coma dust properties up to fifty thousand kilometres, while the phase-angle dependence of linear polarisation can be compared to that of other comets, and measurements from light scattering experiments and cometary models. Here, we present photometric and polarimetric observations of 67P from 2021 performed between 1-6 months pre-perihelion with FORS2 @ VLT, as well as 6 months post-perihelion observations from 2015-2016 with FORS2 @ VLT and ISIS @ WHT. This data, of unprecedentedly high S/N ratio, covers a phase-angle range of ~4-50° and heliocentric distances from 1.2-2.5 AU. Complementing previous measurements with these data points we can see that the polarimetric phase curve of 67P resembles that of a high-polarisation dusty comet. Various jet-like structures in the inner coma are visible in processed intensity images. Polarimetric maps, however, show a homogenous distribution of polarisation throughout the coma and tail, and show no evidence of dust particle evolution over the entire observing run.
How to cite: Gray, Z., Bagnulo, S., Boehnhardt, H., Muñoz, O., Jones, G., Gutiérrez, P. J., Kolokolova, L., Kwon, Y., Lara, L., Martikainen, J., Moreno, F., Nezic, R., and Snodgrass, C.: The Return of Rosetta's Comet: Photometric and Polarimetric Observations of Comet 67P/Chruyumov-Gerasimenko in its 2021-22 Apparition., Europlanet Science Congress 2022, Granada, Spain, 18–23 Sep 2022, EPSC2022-1094, https://doi.org/10.5194/epsc2022-1094, 2022.
Abstract
The results of imaging photometric, polarimetric, and long-slit spectroscopic observations of active asteroids (248370) 2005 QN173 are presented. Average values of the polarization respect to the typical value of polarization observed for C-type asteroids. Using our observations of the asteroid, we attempted to model the physical characteristics of the dust particles in the coma and tail.
Introduction
Comets, asteroids, and meteoroids compose the population of small bodies in the Solar System. Comets and asteroids are traditionally considered as remnants of the matter that were left from the initial and subsequent stages in the epoch of Solar System formation, and investigations of these objects are necessary for understanding the circumstances of the early history of the Solar System. A classical notion of asteroids presumes that they are non-active objects mainly composed of non-volatile material. Now a group of small bodies named “active asteroids” was observed. This group goes beyond the classical definition and includes objects of the transitional class, which are observed in the Main belt (MB) of asteroids [1]. A specific feature of these objects is that their dynamic characteristics are typical of asteroids (their orbits belong to the asteroid-type), while they exhibit signs of cometary activity, i.e., the cometary coma with dust or gas tails [1-3]. These signs may appear periodically or on a non-recurring basis. Several ways of mass loss were considered for eleven objects of this type by Jewitt [1], who called these objects active asteroids, although some of them are not members of MB asteroid [4-6]. Usually, the following activity-inducing mechanisms are proposed: meteoroids bombardment of the surface of asteroids, instability of their rotation, thermal effects, matter release due to electrostatic forces, and the sublimation of volatile compounds [1,2,7]. Moreover, for some primitive MB asteroids, which have orbits typical of asteroids, sublimation activity during their perihelion passages was confirmed [8]. To date, cometary activity has been observed in almost 20 small bodies of the Solar System, which are known as active asteroids [1, 9].
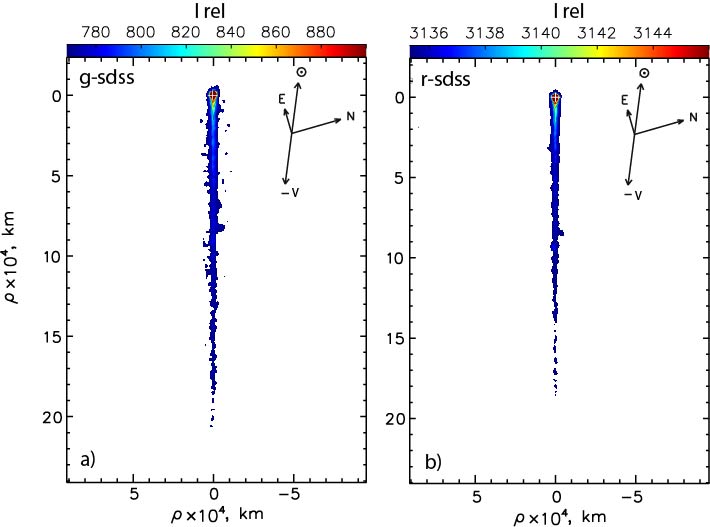
Figure 1: Intensity images of the asteroid in g- and r-sdss filters.
In this work, we study one of the distant asteroids (248370) 2005 QN173, with perihelion distance q= 2.373 au.
Observations
The observations of (248370) 2005 QN173 were made with the 6-m telescope BTA SAO and the 2.5-m telescope of the CMO SAI MSU from July to November 2021, when heliocentric and geocentric distances of the comet were 3.08-3.26 and 3.82-2.95 au, and phase angle was 8-23 degrees. Imaging polarimetric, photometric, and long-slit spectroscopic observations of the asteroid were performed. The observations were taken with a multimode focal reducer SCORPIO-2 of the SAO. A 1024×1024 CCD with a full field of view of 6.1'×6.1' and a pixel scale of 0.18 arcsec/px was used as a detector. Photometrical observations were acquired using the broadband filters.
Results
The analysis of spectra and the spatial distribution of intensity, color, and linear polarization over the coma revealed the following features.
Spectroscopy
No emission lines were detected. We determined upper limits to the emission fluxes of the main neutrals of comets and ion CO+ and upper limits to the production rates of the molecules CN, C3, C2 using Haser model [10].
Photometry and polarization
The active asteroid showed long-lasting activity with a compact coma and long dust tail from July to November 2021 (Fig.1). The dust production was estimated as Afρ~20 cm in the r-sdss filter. Polarization maps of this asteroid show spatial variations of polarization over the coma from about 0.5% up to 1.5% at phase angles α=23° and about -0.7% to -1.3%, which may be related to changes in physical properties of the dust particles. Average values of the polarization correspond to the typical value of polarization observed for C-type asteroids. Our photometrical observations of the asteroid allowed us to use g–r color map to analyze dust properties in the dust coma and tail. From the color map, the dust color is ~0.43m near the optocenter. The color increases with distance from the optocenter.
Acknowledgements
OI, MH are supported, in part, by the Slovak Academy of Sciences (grant Vega 2/0059/22) and the Slovak Research and Development Agency under the Contract no. APVV-19-0072. Authors are grateful Shablovinskaya E. (SAO), Voziakova O. and Safonov B. (SAI MSU) for obtained observation of the asteroid at 6-m and 2.5-m telescopes, respectively.
References
[1] Jewitt, D.: The active asteroids, Astron. J., 2012, vol. 143, pp. 66–80.
[2] Neslushan, L. et al: Dust productivity and impact collision of the asteroid 596 (Scheila), Planet. Space Sci., 2016, vol. 125, pp. 37–42.
[3] Kokhirova, G.I. et al.: Results of complex observations of asteroid (596) Scheila at the Sanglokh International Astronomical Observatory, Sol. Syst. Res., 2018, vol. 52, pp. 495– 504.
[4] Jewitt, D. et al.: Main belt of asteroids comet P/2008 (Garradd), Astron. J., 2009, vol. 137, pp. 4313–4321
[5] Hsieh, H. et al.: Physical properties of Main-Belt Comet P/2005 U1 (Read), Astron. J., 2009a, vol. 137, pp. 157–168.
[6] Hsieh, H. et al.: Albedos of mainbelt comets 133P/Elst-Pizarro and 176P/LINEAR), Astrophys. J. Lett.: 2009b, vol. 694, pp. L111–L114.
[7] Hsieh, H.: Active asteroids: Main-belt comets and disrupted asteroids, Proc. IAU, 2016, vol. 29A, pp. 237–240.
[8] Busarev, V.V., Detection of the influence of solar activity on the sublimation activity of primitive asteroids, Phys. Curr. State Pros. 2018, vol. 2, pp. 47–50.
[9] Jewitt, D. et al.: The active of asteroids, in Asteroids IV, Michel, P., DeMeo, F., and Bottke, W., Eds., Tucson: Univ. Arizona Press, 2015, pp. 221–241.
[10] Haser, L.: Distribution d’intensite dans la tete d’une cometes, Bull. Soc. R. Sci. Liege, Vol. 43, pp. 740–750, 1957.
How to cite: Ivanova, O., Luk’yanyk, I., and Husárik, M.: Dust environment of active asteroid (248370) 2005 QN173, Europlanet Science Congress 2022, Granada, Spain, 18–23 Sep 2022, EPSC2022-203, https://doi.org/10.5194/epsc2022-203, 2022.
Polarimetry is a powerful technique to study the surfaces of Solar System objects, especially at small phase angles where the so-called the negative polarization branch (NPB) is observed. The NPB can have different shape and polarization values for different composition of the surfaces. For rocky surfaces, it has a parabolic shape with a minimum around 10° and inversion point (the angle where the polarization changes from negative to positive) around 20°. However, for icy surfaces (satellites of giant planets, cometary nuclei, and Trans-Neptunian objects), the NPB becomes very asymmetric, and its minimum shifts to smaller phase angles. The cause of this has been attributed to Coherent Backscattering Mechanism (CBM), which is known to be very sensitive to the size of particles and porosity of the medium.
Recently, we have been able to accurately determine the NPB of jovian satellites Europa, Ganymede, and Io. The NPBs for Europa and Ganymede are very similar (despite the difference in their geometric albedo, 0.67 for Europa and 0.44 for Ganymede). Their NPBs appeared to be strongly shifted to small phase angles with a single narrow minimum (unlike a bimodal curve with a deep and narrow and broad and shallow overlapping NPBs as was suggested in Rosenbush et al. 2015). Io, unlike Ganymede and Europa, has a more extended, although still asymmetric, NPB, despite a similarity of Io’s albedo (0.63) to Europa’s albedo. As an example, we show the observed polarization phase curve for Europa (Fig. 1). Its NPB is evidently formed by CBM. To find the properties of the regolith particles, we accomplished computer modeling of the polarimetric curves using the radiative-transfer coherent-backscattering (RT-CB) method (e.g., Muinonen et al. 2015). The best fit for Europa, shown in Fig. 1, was achieved for a regolith layer of single-scattering albedo ~0.985 and extinction mean-free-path-length ~16 microns. We will also present the results for Io and Ganymede.

Figure 1. Phase-angle polarization dependence for Europa, observations in the R filter (open circles) and the best fit result for the RT-CB modeling (solid line).
References
Rosenbush, V., Kiselev, N., Afanasiev, V. Icy moons of the outer planets. In: Polarimetry of Stars and Planetary Systems. (Eds. L. Kolokolova, J. Hough, A-Ch. Levasseur-Regourd), Cambridge University Press, Cambridge, 340-359. 2015.
Muinonen, K., Penttilä, A., and Videen. Multiple scattering of light in particulate planetary media. In: Polarimetry of Stars and Planetary Systems. (Eds. L. Kolokolova, J. Hough, A-Ch. Levasseur-Regourd), Cambridge University Press, Cambridge, 117-129. 2015.
How to cite: Rosenbush, V., Kiselev, N., Muinonen, K., Kolokolova, L., Savushkin, A., and Karpov, N.: Polarization of Jupiter's large moons, Europlanet Science Congress 2022, Granada, Spain, 18–23 Sep 2022, EPSC2022-809, https://doi.org/10.5194/epsc2022-809, 2022.
Introduction: Various minerals have been detected on Ceres and their abundance and spatial distribution has been mapped in the near infrared spectral domain [i.e. 1, 2]. In this work we study the 1 µm absorption to map Ceres mineralogy at a global scale. It is based on the determination of the whole 1 µm absorption from VIR spectra. VIR is the imaging spectrometer on board the NASA mission Dawn in orbit around Ceres and still operating. VIR is composed of two channels: the VIS channel working in the visible wavelengths between 0.26-1.07 μm and the NIR channel operating in the near infrared between 1.02-5.1 µm. The 1 µm absorption is, indeed, in between the instrument channels.
Method: To study the 1 micron spectral range, an automatic method to co-register the VIR and NIR channels, where they overlap, has been implemented, thus allowing the study of this band. After the spatial co-registration, a residual difference in the I/F at 1 µm between the two channels can still remain due to the difference in the PSF’s. To avoid this problem, each VIS spectrum is rescaled to the value of the I/F at ~1 µm of the corresponding NIR spectrum. The exact wavelength at which the two VIR channels are matched, inside the overlapping range between 0.92–1.8 µm, is selected for each spectrum on the basis of the best match. The difference between the VIS and NIR reflectance at ~1 µm (ΔR) is usually 1-2% and only about 1% of data show a ΔR>10%. The spectra with the largest mismatch between the two channels are located along the walls of the craters and valleys where the influence of PSF differences is expected to be larger. In this study the data with ΔR>10% are discarded. The maps have global longitudinal coverage, latitudinal coverage from 66°S to 66°N, and a spatial resolution of ~1.86 km/pixel at the equator.
Each spectrum of the surface is the result of areal or intimate mixing of different minerals, and the resulting spectral reflectance properties are a complex combination of the spectra of each mineral end-member. Several studies have shown that it is possible to explore Ceres mineralogical diversity utilizing specific spectral parameters [1,2].
In order to extract compositional information from the spectra, we have introduced some spectral indices and studied the correlations between them all over the VIR data set. Global maps of the 1 µm signature on Ceres have been derived from various spectral indices, such as band centers, depths, integrated areas, etc.
Results: A better understanding of the spatial distribution and the content of the different mineral phases can thus be obtained by investigating the spectral characteristics of the 1 µm band.
In general, the VIR spectrum of Ceres is dominated by a broad absorption at about 1.2 µm. It is mostly uniform across the surface, but some differences can be seen in the map of the band parametres, like the band depth. Variation in the band depth could be due to various factors, such as relative abundance and grain size of the present minerals.
However, the spectral properties of the 1 µm band have been related to other spectral parameters in the NIR domain where mineralogy is known. For example, the attribution of the 3.1 µm band to ammonia-bearing species [1] show that this mineral phase dominant where we see for low values of 1 micron band. Infact, the spatial variability in the 1.0 µm band intensity is anticorrelated respect to the 3.1 µm band.
Some terrains show a different behavior of the 1 micron band respect to 3.1 band. This suggests the presence of a distinctive mineralogy.
This work, together with the results of other authors [1,2], completes the global mapping of the Ceres mineralogy.
Acknowledgments: We thank the Italian Space Agency (ASI). The Visible and Infrared Mapping Spectrometer (VIR) was funded and coordinated by the Italian Space Agency, with the scientific leadership of the Institute for Space Astrophysics and Planetology, Italian National Institute for Astrophysics, Italy.
References: [1] E. Ammannito et al. (2016) Science, 353, issue 6303. [2] Carrozzo et al. (2018), Science Advances, vol. 4, 3, e1701645.
How to cite: Carrozzo, F. G., De Sanctis, M. C., Raponi, A., Ciarniello, M., Ammannito, E., Tosi, F., and Ferrari, M.: MINERALOGY OF THE SURFACE OF CERES FROM 1 µm ABSORPTION, Europlanet Science Congress 2022, Granada, Spain, 18–23 Sep 2022, EPSC2022-1096, https://doi.org/10.5194/epsc2022-1096, 2022.
Comets are among the oldest populations in the Solar System, thus providing information about the conditions of the environment where it was formed. The European Space Agency's Rosetta mission, which escorted comet 67P/Churyumov-Gerasimenko (hereafter 67P) for approximately two years, represented a milestone in the study of these bodies, providing the most detailed data of the nucleus and inner regions of the coma to date. In particular, images taken by OSIRIS, the main imaging system on board Rosetta, provided the opportunity to study dust particles present in the coma. While the smallest particles have the biggest contribution to the coma brightness observed in these images, larger particles can be detected and analyzed individually.
In this work, the motion of individual dust particles in the coma of the comet 67P is investigated. This is done by analyzing sets of images taken by OSIRIS in which these large dust particles can be seen as bright tracks instead of points sources as result of the combination of motions of both particles and spacecraft. Since the distance from the particles to the camera is unknown, most of their physical and dynamical properties such as size and velocity cannot be uniquely determined. Previous works dealing with the same issue focused on obtaining the distance to individual detected particles in the image, which could be done in specific cases, reducing the number of analyzed particles.
In this work we use a different approach to analyze the dynamics of the dust. It is based on the statistical comparison between the images obtained by OSIRIS and synthetic images generated from dynamical modelling of the dust in the coma. The main advantage of this approach is to bypass the distance determination to the particles, which lifts the strict requirement on the observation conditions that were imposed by the earlier methods and allows us to analyze a much larger set of tracks. The dynamics of the particles, and then the distribution of tracks in the synthetic images, depend on certain parameters as dust size, density and initial velocity, so the comparison between observations and different synthetic images can help to constrain the properties of the dust.
The main steps involved in the method are: (i) detection of dust tracks on the OSIRIS images using an algorithm based on the Hough transform method, (ii) dynamical modelling of the trajectories of dust particles and generation of synthetic images using information about spacecraft position and orientation and (iii) solving the inverse problem by finding the dust parameters that generate synthetic images most similar to real ones. We present results from several image sets taken at different moments during the orbit of 67P using different dynamical models, in order to analyze the evolution of the dust properties and compare the relevance of different forces in the particles trajectories.
How to cite: Lemos, P.: Modelling dust particle dynamics in the coma of 67P/Churyumov-Gerasimenko, Europlanet Science Congress 2022, Granada, Spain, 18–23 Sep 2022, EPSC2022-455, https://doi.org/10.5194/epsc2022-455, 2022.
Please decide on your access
Please use the buttons below to download the presentation materials or to visit the external website where the presentation is linked. Regarding the external link, please note that Copernicus Meetings cannot accept any liability for the content and the website you will visit.
Forward to presentation link
You are going to open an external link to the presentation as indicated by the authors. Copernicus Meetings cannot accept any liability for the content and the website you will visit.
We are sorry, but presentations are only available for users who registered for the conference. Thank you.
Posters: Thu, 22 Sep, 18:45–20:15 | Poster area Level 2
We present our preliminary results of searching for short-term variations of four long-period comets C/2016 M1 (PANSTARRS), C/2015 O1 (PANSTARRS), C/2014 W2 (PANSTARRS), C/2016 N4 (MASTER), and a hyperbolic comet C/2021 A1 (Leonard). All the comets reveal red color of their dust coma with slight variations, i.e., without changes of the color to blue or neutral. The observed dust productivity of the comets is quite high. Dust production respects to measurements of other long-period comets at the similar heliocentric distances. Comet C/2021 A1 (Leonard) was significantly redder comparing with the other comets and possessed weaker activity.
Introduction
In our research, we are looking for rapid variations of photometric color of comets at heliocentric distances beyond 3 au. The color reflects mainly the size distribution and also depends on the composition of dust particles (1; 2).
Variations of photometric color can be observed when we change the aperture size. It can be explained by differences in sizes and/or compositions of particles on different cometocentric distances, which can be caused by sublimation and/or fragmentation of dust particles (3; 4). On the second hand, except variations with the aperture size, the color was believed to be a constant characteristic of a cometary coma, but further studies have demonstrated changes of color during a long time (5; 6; 7). Furthermore, recent studies reveal much shorter variations of photometric color, i.e. days or months, which can be induced by changes of dust properties (3; 8; 9).
We analyze monitoring observations of 4 comets with highly eccentric elliptical orbits and a hyperbolic comet in order to find rapid color variations.
Observations
Observations of the comets were taken at the Skalnaté Pleso observatory (IAU Code – 056) using the 61-cm telescope. As CCD detector the FLI PL-230 camera have been taken. The pixel size of the camera is 15 µm, the field of view of 40.3 arcmin×40.6 arcmin, and the pixel scale was 1.18 arcsec/px. the Bessel B, V, R broadband filters were used. Images were taken without binning. During observations of comet C/2021 A1 (Leonard) in 2021 the telescope was equipped with the SBIG ST-10XME Dual CCD camera, having a pixel size of 6.8 µm, the field of view of 19.5 arcmin×13.1 arcmin and the pixel scale is 1.07 arcsec/px. We used a 2×2 binning mode. R and V filters of the Johnson-Cousins photometric system were used.
The reduction procedure (bias subtraction, dark and flat field corrections, and cleaning cosmic-ray tracks) was performed in in the standard manner, using the IDL routines (10; 8; 11). We used only photometric nights for analysis.
Results
At heliocentric distances bigger than 3 au, where the comets were observed, the coma is mostly formed by the sublimation of more volatile species, e.g., CO/CO2. Furthermore, at such distances gaseous emissions of daughter molecules are rarely observed in the optical region (12). Therefore, we assume that the observations obtained with the broadband filters allow us to study features of a dust coma.
We have not found significant variations of color from red to blue or neutral (or vice versa) in the selected comets. All the comets possessed red color of the dust coma with slight variations. Dust production of most long-period comets is similar to other comets of these family and is significantly bigger than for the Jupiter family comets. Only comet C/2016 N4 (PANSTARRS) has possessed lower activity.
Color of hyperbolic comet C/2021 A1 (Leonard) was usually bigger than for the other sampled comets, but dust production was on contrary smaller.
Acknowledgments
Our work was supported by the Slovak Grant Agency for Science VEGA No. 2/0059/22. Also, we were supported by the Slovak Research and Development Agency under the Contract no. APVV-19-0072.
References
1. Sen, A. K., et al. The effect of porosity of dust particles on polarization and color with special reference to comets. Journal of Quantitative Spectroscopy and Radiative Transfer. 2017, Vol. 198, pp. 164 - 178.
2. Jewitt, D. The active Centaurs. The Astronomical Journal. 2009, Vol. 137, 5, pp. 4296 - 4312.
3. Betzler, A. S., et al. An analysis of the BVRI colors of 22 active comets. Advances in Space Research. 2017, Vol. 60, pp. 612 - 625.
4. Farnham, T. L. Coma morphology of Jupiter-family comets. Planetary and Space Science. 2009, Vol. 57, pp. 1192-1217.
5. Jewitt, D. and Meech, K. J. Cometary Grain Scattering versus Wavelength, or, "What Color is Comet Dust?". Astrophysical Journal. 1986, Vol. 310, p. 937.
6. Li., J.-Y., et al. Constraining the Dust Coma Properties of Comet C/Siding Spring (2013 a1) at Large Heliocentric Distances. The Astronomical Journal Letters. 2014, Vol. 797, 1, p. 7.
7. Weiler, M., et al. The dust activity of comet C/1995 O1 (Hale-Bopp) between 3 AU and 13 AU from the Sun. Astronomy&Astrophysics. 2003, Vol. 403, pp. 313 - 322.
8. Ivanova, O., et al. Colour variations of Comet C/2013 UQ4 (Catalina). Monthly Notices of the Royal Astronomical Society. 2017, Vol. 469, 3, pp. 2695-2703.
9. Luk`yanyk, I., et al. Rapid variations of dust colour in comet 41P/Tuttle–Giacobini–Kresák. Monthly Notices of the Royal Astronomical Society. 2019, Vol. 485, 3, pp. 4013-4023.
10. Ivanova, O. V., et al. Photometric and spectroscopic analysis of comet 29P/Schwassmann-Wachmann 1 activity. Planetary and Space Science. 2016, Vol. 121, pp. 10-17.
11. Picazzio, E., et al. Comet 29P/Schwassmann-Wachmann 1 dust environment from. Icarus. 2019, Vol. 319, pp. 58-67.
12. Kulyk, I., et al. Physical activity of the selected nearly isotropic comets with perihelia at large heliocentric distance. Astronomy&Astrophysics. 2018, Vol. 611, p. A32.
How to cite: Voitko, A. and Ivanova, O.: Search for short-term color variations of five distant comets, Europlanet Science Congress 2022, Granada, Spain, 18–23 Sep 2022, EPSC2022-218, https://doi.org/10.5194/epsc2022-218, 2022.
Abstract
The comet 17P/Holmes underwent an enormous outburst in October 2007 leaving vast amount of dust particles, which spread into elliptic orbits around the Sun [1, 2]. During February-March 2022 dust trail observations were forecasted to be possible with amateur sized telescope when outburst dust particles were in second revolution orbiting the Sun [1]. Observations were compared to the new dust trail particle model ‘Dust Trail kit’ implemented in Orekit.
1. Introduction
Cometary Dust Trail kit model was developed between 1999-2013 and latest dust trail observations were referenced to model at 2015 [1]. More recent observations were needed to ensure and validate model accuracy and these new observations were part of the announced comet 17P dust trail observation campaign that started in 2013 [1].
2. Observations
2.1 February 26th and 28th 2022
The 17P/Holmes dust trail was observed 26.2.2022 18:26UT and 28.8.2022 18:31UT based to the modeled position reported in [1]. 40 x 90 second exposures were taken at both nights with 305mm aperture telescope and clear filter using CCD bin2 mode and tracking stars. Stacked images were astrometrically plate solved and then subtracted and inverted to highlight the dust trails. Figure 1 shows the dust trails with their positions. The upper dark dust trail was observed on 26.2.2022 and lower light dust trail on 28.2.2022.
2.2 March 1st and 2nd 2022
The 17P/Holmes dust trail was observed on 1.3.2022 18:25UT and 2.3.2022 18:35UT based to the model position. CCD bin3 mode was used to get more sensitivity with exposure times 50 x 45 second at both nights. Images were then stacked, plate solved and subtracted. Figure 2 shows dust trails with positions, the upper dark dust trail is an observation made on 1.3.2022 and the lower light dust trail on 2.3.2022.
3. Comparison to the model
Observations 2.1 and 2.2 were compared with the results of the ‘Dust Trail kit’ model implemented in Orekit by Markku Nissinen. Figure 3 show a good correlation between the model calculations and the four observations.
4. Equipment and software
4.1 Equipment
The telescope used was 305mm aperture and 1205mm focal length F4 Newton with coma corrector. Mount was iOptron CEM60 and autoguider was configured to track stars during each exposure. The telescope was placed in Viestikallio Remote Controlled Observatory at Artjärvi, Finland under Bortle 3 rural sky conditions.
CCD-camera was cooled QSI690wsg having Sony ICX814 CCD-sensor. Exposures 90s and 45s were used with CCD binning 2x2 and 3x3, giving 1.3 and 1.9 arcsec/px resolution. Baader Clear filter was used.
4.2 Software
Image processing software used was PixInsight (PI), images were registered and stacked with PI Star registration and PI Integration functionality. PI PixelMath was used in image subtraction.
ASTAP software was used for plate solving and astrometric analysis.
5. Figures
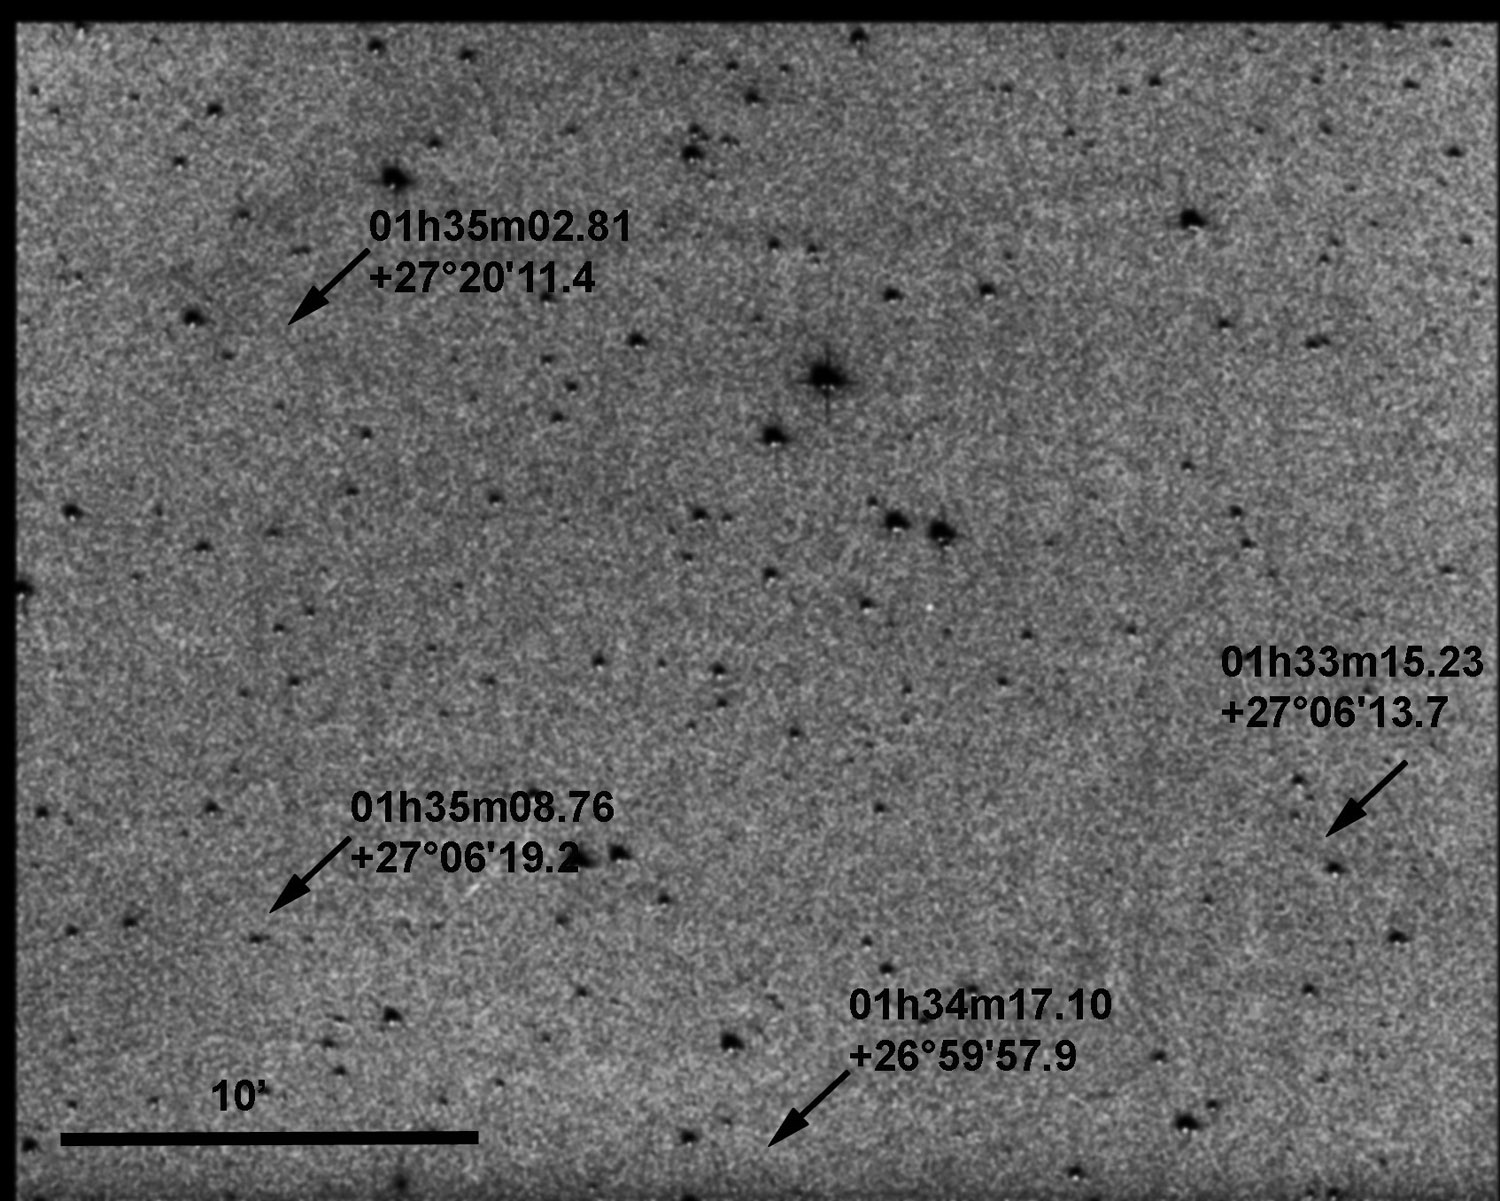
Figure 1: Subtracted image of 17P/Holmes dust trails with measured positions, upper dust trail 28.2.2022, lower trail 26.2.2022, Jorma Ryske. Observations separation is 48 hours.
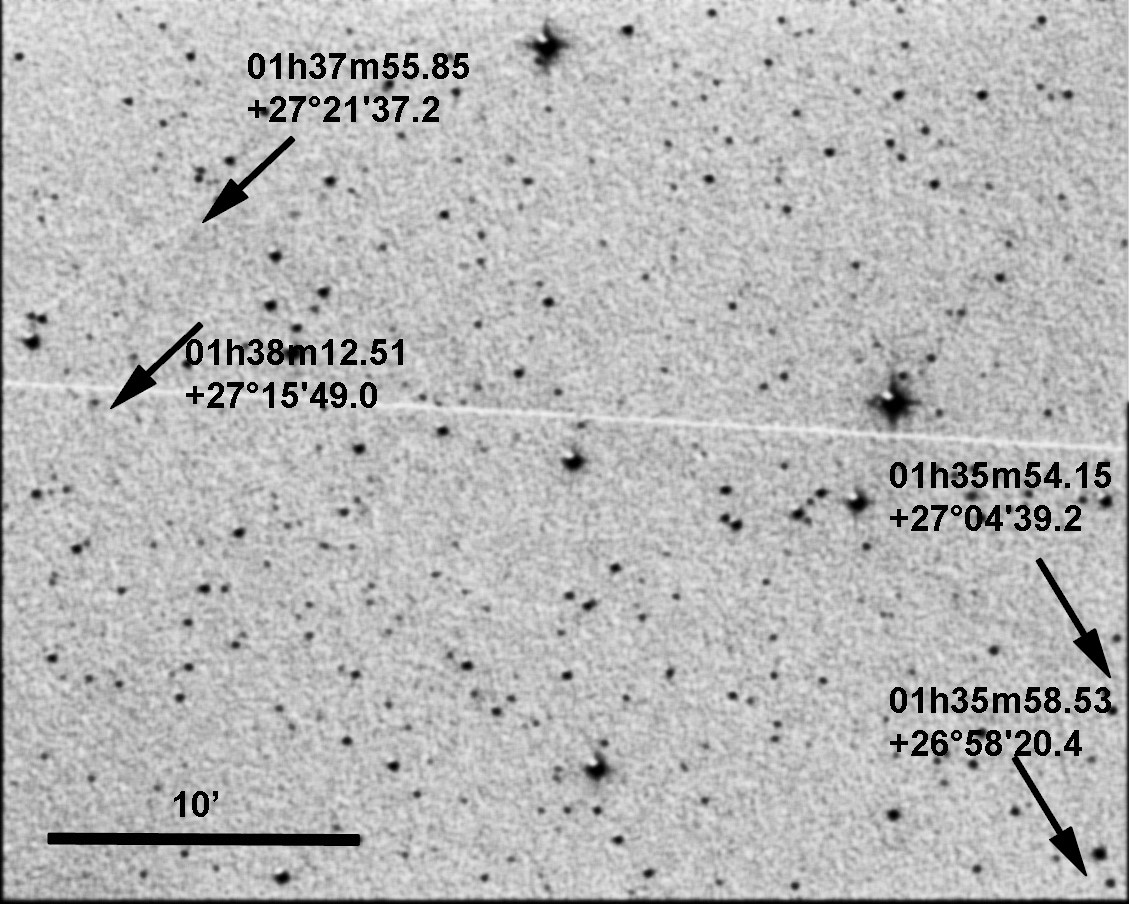
Figure 2: Subtracted image of 17P/Holmes dust trails with measured positions, upper dark dust trail 1.3.2022, lower light dust trail 2.3.2022, Jorma Ryske. Observations separation is 24 hours. Two satellite tracks in image.
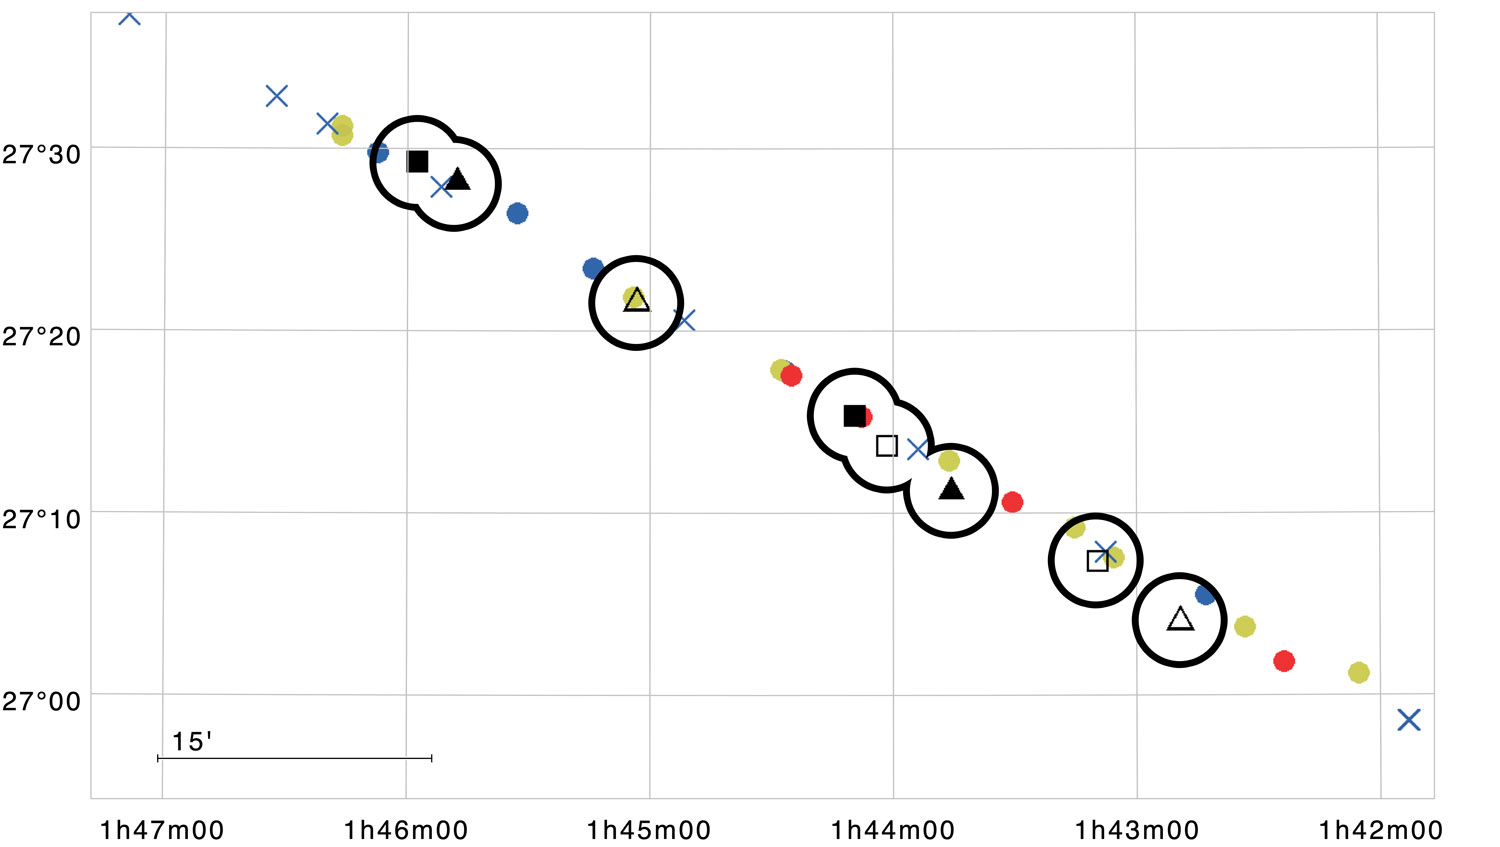
Figure 3: 17P Dust Trail kit model positions (markers with no circles as small, medium, big and toward the Sun particles) [1] and observations positions (square and triangle markers with circles) for dates 26.2. & 28.2.2022 and 1.3. & 2.3.2022. The X-axis shows RA and the Y-axis DEC. Model calculations M. Nissinen, M. Gritsevich, observations J. Ryske.
6. Summary and Conclusions
The particles released by the comet 17P/Holmes during the 2007 outburst formed a dust trail which is still possible to observe with relatively small aperture amateur sized telescopes using modern CCD-camera and image processing technology giving useful research data by amateur astronomers. Observations ensure that the developed dust particle model is producing the realistic results and can be used to forecast dynamics of meteoroid streams.
Acknowledgements
Special thanks to Arto Oksanen, Jyväskylän Sirius ry, image verification and Harry Lehto, University of Turku, image photometric guidance.
References
[1] Evolution of the Dust Trail of Comet 17P/Holmes, Maria Gritsevich, Markku Nissinen, Arto Oksanen, Jari Suomela, Elizabeth A. Silber. MNRAS Monthly Notices of the Royal Astronomical Society, 513(2), pp. 2201–2214, https://doi.org/10.1093/mnras/stac822
[2] Dust Trail Observations of Comet 17P/Holmes and Predictions for 2021-2022, Nissinen, Markku; Gritsevich, Maria; Oksanen, Arto; Suomela, Jari. Europlanet Science Congress 2021, EPSC2021-86.
How to cite: Ryske, J., Gritsevich, M., and Nissinen, M.: Validation of the Dust Trail kit model with the recent observations of the comet 17P/Holmes dust trail (February –March 2022), Europlanet Science Congress 2022, Granada, Spain, 18–23 Sep 2022, EPSC2022-60, https://doi.org/10.5194/epsc2022-60, 2022.
Background
After landing on Ryugu, The Mobile Asteroid surface SCOuT (MASCOT) settled in front of a rock that was a bit larger than itself. Multispectral imaging of the rock revealed a dark matrix with numerous small, bright, multi-colored inclusions (Jaumann et al. 2019; Schröder et al. 2021). While these inclusions appear similar to those in carbonaceous chondrite (CC) meteorites, the rock is not easily associated with any particular CC group (Schröder et al. 2021; Otto et al. 2021). Now we can directly compare the MASCOT observations with particles from Ryugu. The samples are considered representative for the asteroid surface (Tachibana et al. 2022), but the particles harbor no chondrules and Ca-Al-rich inclusions larger than a millimeter (Yada et al. 2021). Is the MASCOT rock perhaps unusual for Ryugu? We put the in-situ MASCOT observations in the context of remote observations of the landing site by the Hayabusa2 instruments. The optical navigation camera (ONC), near-infrared spectrometer (NIRS3), and thermal infrared imager (TIR) mapped virtually the entire surface multiple times over the course of the mission (Sugita et al. 2019; Kitazato et al. 2019; Okada et al. 2020).
Hayabusa2 observations of the landing area
MASCOT was aimed to land in an area just south of the equator that was chosen for its high potential for spectroscopic diversity (Lorda et al. 2020). Of particular interest is "blue" terrain, which features a neutral to negative spectral slope and is thought to expose fresh material (Sugita et al. 2019; Morota et al. 2020). The lander came to rest in the area indicated by the white rectangle in Fig. 1, which appears almost devoid of blue terrain. Figure 2 zooms in on the landing area, showing color composites of three separate ONC image sets. Composite (a) is made from images acquired two months before the release of MASCOT and shows the landing site at relatively low resolution. Composite (b) is made from images acquired just after landing and has a bright spot at the landing site that corresponds to the lander's highly reflective, white top side. The lander has the size of a single pixel in the original, unprojected images, so neither its shape nor orientation can be distinguished. Composite (c) is made from images acquired half a year after landing, and shows the lander on its side (Scholten et al. 2019). The inset in Fig. 2c shows MASCOT in close-up. The lander appears no longer white but has assumed an orange color, which derives from the foil that covered its sides. In addition to the ONC data, we analyzed two NIRS3 spectral data sets and six TIR data sets, as our presentation will show in detail.
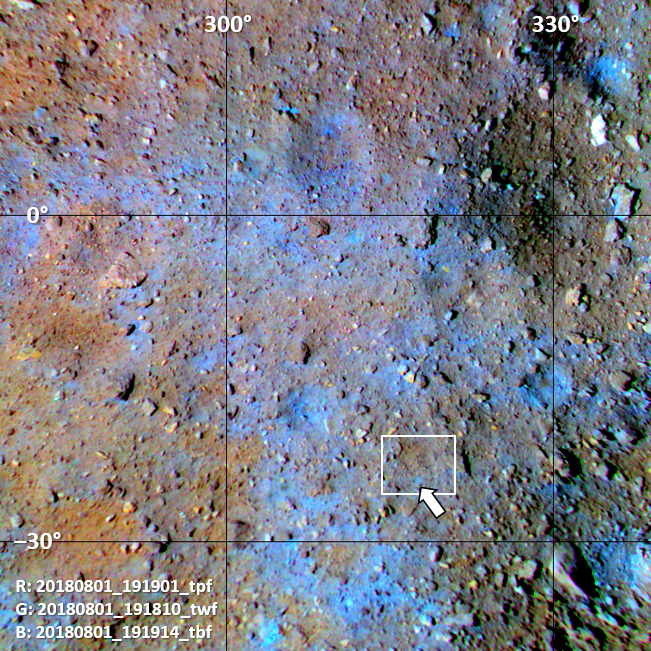
Figure 1. Composite of projected ONC images acquired prior to the MASCOT landing, with colors saturated. The white rectangle is the area detailed in Fig. 2. The arrow points at a small, distinctly blue feature that we identified as an impact crater.
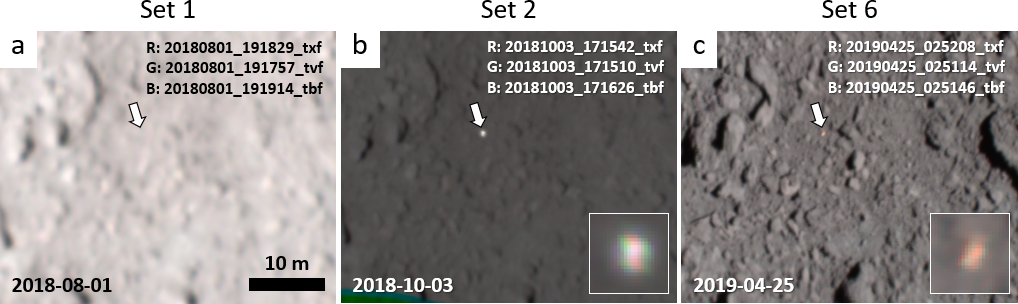
Figure 2. Color composites of identically projected ONC images of the MASCOT landing area. The arrows point at the landing site. (a) Before landing. (b) Right after landing, with MASCOT in the nominal orientation. (c) Half a year after landing, with MASCOT in the final orientation. The brightness in each composite is scaled from zero to the maximum reflectance over all color channels. The insets show close-ups of MASCOT.
Implications
Our analysis of data from Hayabusa2 instruments reveals that the MASCOT landing site has spectral and thermophysical properties very close to those of average Ryugu. While the Ryugu particles lack inclusions, the MASCOT rock features bright and strongly colored spots (Fig. 3). The apparent discrepancy between the rock and the Ryugu samples may simply illustrate the diversity of rocks present on the surface (Tatsumi et al. 2020; Sakatani et al. 2021). Alternatively, it may derive from the sampling method, which involved shooting a pellet into the surface (Morota et al. 2020). The samples display compositional heterogeneities at sub-mm scale. Among the bulk of dark particles, there are several bright particles of about 0.5 mm size that harbor carbonates or NH-rich compounds (Pilorget et al. 2021). Some carbonate-rich grains feature a steep red slope at wavelengths <1.6 µm. These characteristics well match those of the inclusions in the rock (Fig. 3). Such bright particles may be embedded in rocks on Ryugu, ending up as individual particles in the samples after being dislodged upon pellet impact or during atmospheric entry. Some rocks on the surface of Ryugu are thought to be breccias (Sugita et al. 2019), and the MASCOT rock may be one of them.
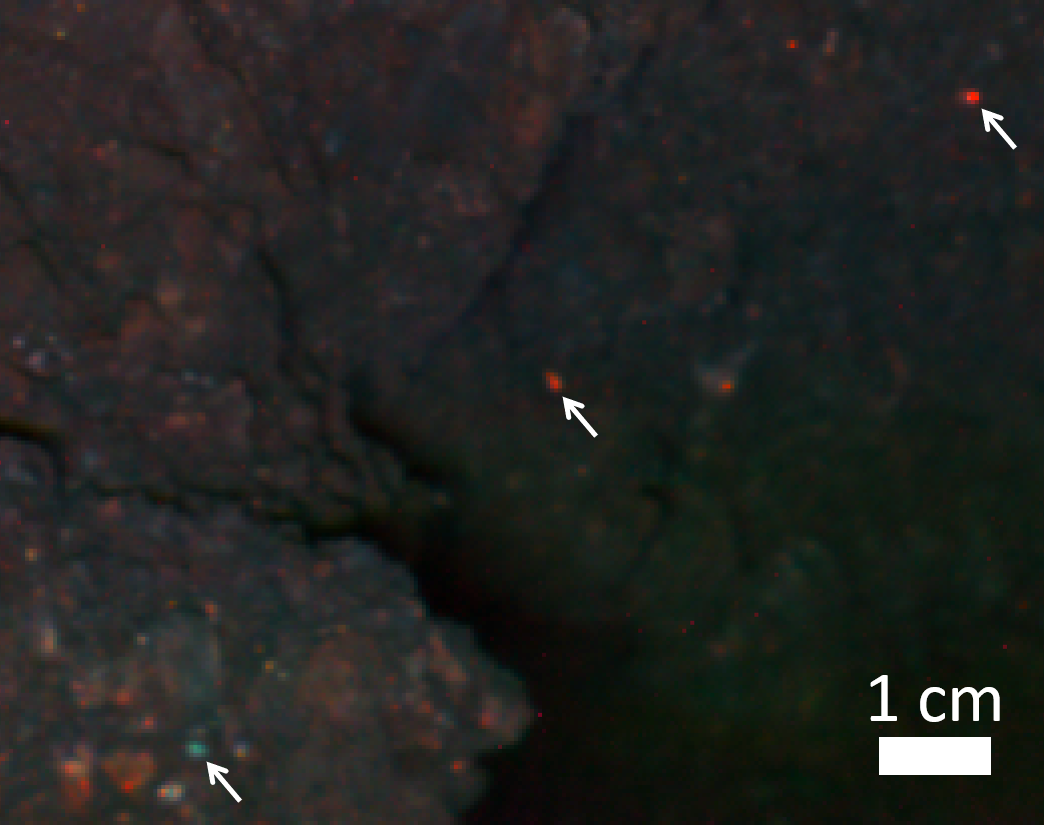
Figure 3. Inclusions in a rock on Ryugu as seen in a MASCOT color composite. The arrows point at a few brightly colored examples. Colors are saturated (Schröder et al. 2021).
References
Jaumann, R. et al. 2019, Science, 365, 817
Kitazato, K. et al. 2019, Science, 364, 272
Lorda, L. et al. 2020, Planet. Space Sci., 194, 105086
Morota, T. et al. 2020, Science, 368, 654
Okada, T. et al. 2020, Nature, 579, 518
Otto, K. A. et al. 2021, Planetary Science Journal, 2, 188
Pilorget, C. et al. 2021, Nature Astronomy, 6, 221
Sakatani, N. et al. 2021, Nature Astronomy, 5, 766
Scholten, F. et al. 2019, A&A, 632, L5
Schröder, S. et al. 2021, Planetary Science Journal, 2, 58
Sugita, S. et al. 2019, Science, 364, 252
Tachibana, S. et al. 2022, Science, 375, 1011
Tatsumi, E. et al. 2020, Nature Astronomy
Yada, T. et al. 2021, Nature Astronomy, 6, 214
How to cite: Schröder, S., Sakatani, N., Honda, R., Tatsumi, E., Yokota, Y., and Domingue, D. and the Hayabusa2 and MASCOT teams: Characterizing the MASCOT landing area with Hayabusa2: Linking the MASCOT rock to the Ryugu samples, Europlanet Science Congress 2022, Granada, Spain, 18–23 Sep 2022, EPSC2022-204, https://doi.org/10.5194/epsc2022-204, 2022.
Planetary community knows Ukraine as a country that has a prominent history of polarimetric studies of Solar system objects. Ukrainian planetary polarimetry has been counting since 1926 when academician M. Barabashov (Kharkiv) observed polarization of the Moon. It got a significant impetus in late 1950th since then concentrating in Kharkiv, Kyiv, and Crimea, and gradually moving its focus from polarimetric studies of Mars and Venus to comets and asteroids, at the same time keeping the leading role in the lunar polarimetry. In parallel with building polarimetric instrumentation and observing, Ukrainian polarimetric school also has had notable achievements in theory, specifically in studies of planetary and cometary atmospheres and surfaces of the Moon and asteroids, and in laboratory studies of light scattering by particulate surfaces. The devastating events of this year made it impossible for the Ukrainian polarimetrists to participate in the EPSC meeting. This poster intends to compensate for their absence by describing the history of the Ukrainian Polarimetric School and reminding the planetary community about leading Ukrainian polarimetrists and their contribution to the polarimetry of small bodies.
How to cite: Kolokolova, L., Sosonkin, M., and Levasseur-Regourd, A.-C.: Ukrainian School of Planetary Polarimetry, Europlanet Science Congress 2022, Granada, Spain, 18–23 Sep 2022, EPSC2022-263, https://doi.org/10.5194/epsc2022-263, 2022.
Introduction: ESA’s upcoming Comet Interceptor (CI) mission will be the first to visit a long period, potentially dynamically new, comet that will consist of some of the most primitive material from the beginning of our Solar System [1]. Part of CI’s payload includes the Modular InfraRed Molecular and Ices Sensor (MIRMIS) which aims to map the thermal and compositional variation of the comet’s nucleus and coma. MIRMIS is compromised of a near-infrared hyperspectral imager (NIR, 0.9-1.6 µm), a mid-infrared point spectrometer (MIR, 2.5 – 5 µm) and, the focus of this study, a multispectral thermal imager (TIRI, 6-25 µm).
TIRI’s instrument design includes one central broadband thermal imaging channel (6-25 µm) and 2 identical sets of eight narrow-band channels situated orthogonal to each other to accommodate the instrument orientation as it changes upon closest approach to the comet (Fig.1). This configuration will allow for optimal comparison between views of the comet, and analysis of photometric effects.
To maximize the science return pertinent to the mission objectives, we investigated TIRI’s ability to retrieve both temperature and composition using its originally proposed filter set, described in Table 1, and new alternative filter sets.
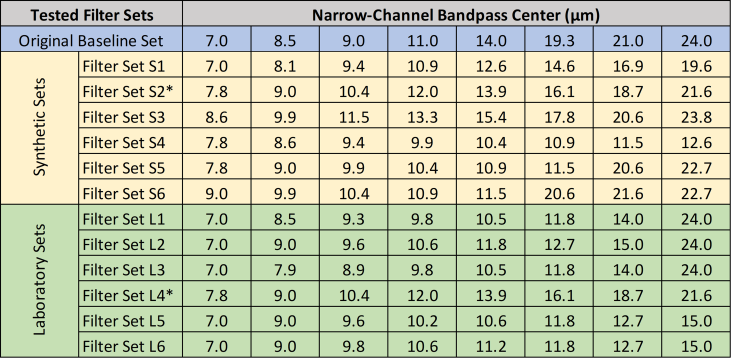
Table 1: Summation of bandpass centers for filter sets. In blue is the original baseline filter set, and those underneath (yellow and green) show proposed filter sets tested for improved science return. Starred set is the proposed ‘new baseline’.
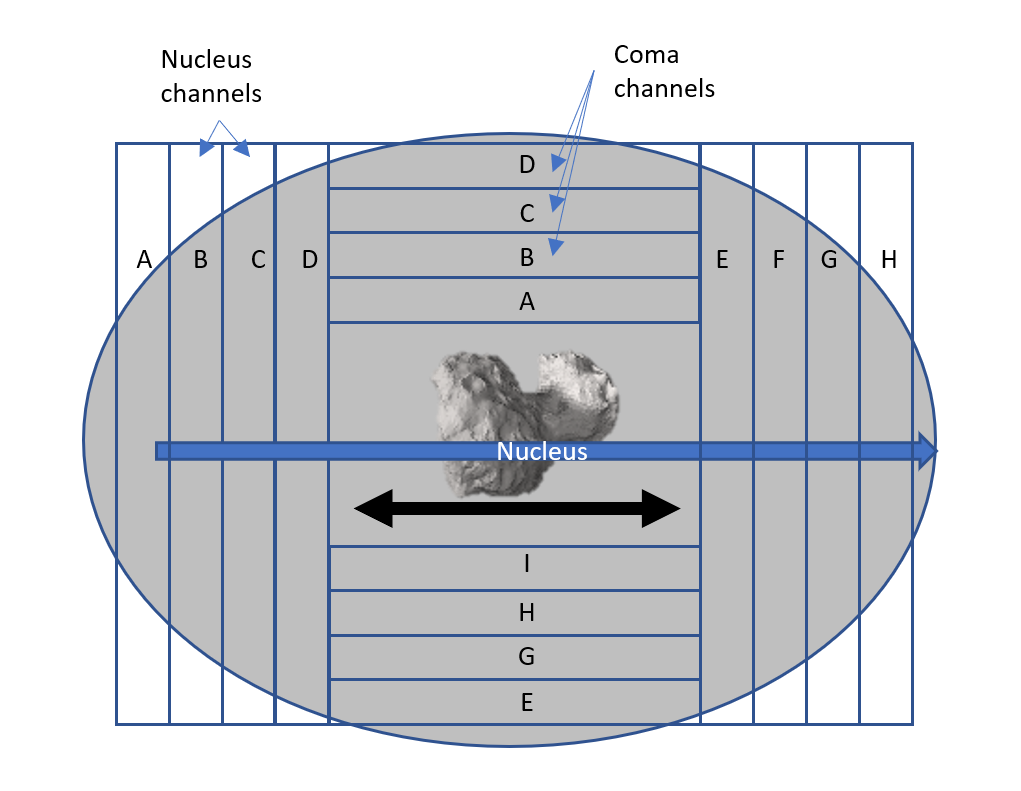
Figure 1 : Filter layout on TIRI
Methods: To optimize TIRI’s narrow-band filter set, we used both synthetic nucleus spectral targets and laboratory measured analogue minerals and meteorite spectra to understand TIRI’s detection capabilities. In addition to the proposed baseline filter set, several others were proposed that consisted of band-centers evenly spaced along TIRI’s range; band-centers concentrated near 9-11 µm (a region rich in silicate features); or a mix of the two.
Synthetic Spectral Analysis: Twelve synthetic spectra were generated with the Planetary Spectrum Generator (PSG) [2]. These included six featureless spectra made of single or mixed temperature blackbodies and six spectral mixtures composed of crystalline (fayalite or enstatite) and amorphous (pyroxene) silicates convolved with single or mixed temperature blackbodies. Mixed temperature blackbodies were used to account for nucleus roughness and/or pixel anisothermality. The silicate endmembers used in this study were chosen based on identified minerals of comets Tempel 1 and Hale-Bopp [3-5]. For these simulations we assumed fixed resolving power to create synthesized spectra with a specific pixel-width that already accounted for TIRI noise performance. Six filter sets were tested as defined in Table 1 (yellow).
The simulated retrievals included realistic instrument noise (noise-equivalent-power) and were performed using the Retrieval Module of the PSG [5]. We used this tool to test the ability of each filter set to retrieve a sequence of information about each original synthetic spectrum: 1) temperature; 2) temperature + amorphous pyroxene; 3) temperature + crystalline fayalite; 4) temperature + crystalline enstatite; 5) temperature + crystalline fayalite and enstatite; and 6) temperature + all three silicates (Fig. 2).
These retrievals showed that temperature of the featureless spectra was always reliably determined independent of filter set. For the silicate spectra, temperature was always retrieved (±1 K) if >250 K, but spectral shape determination, had a dependence on filter set. Filter set S2 (Table 1, Fig.2 blue) was determined to most accurately identify compositional features.
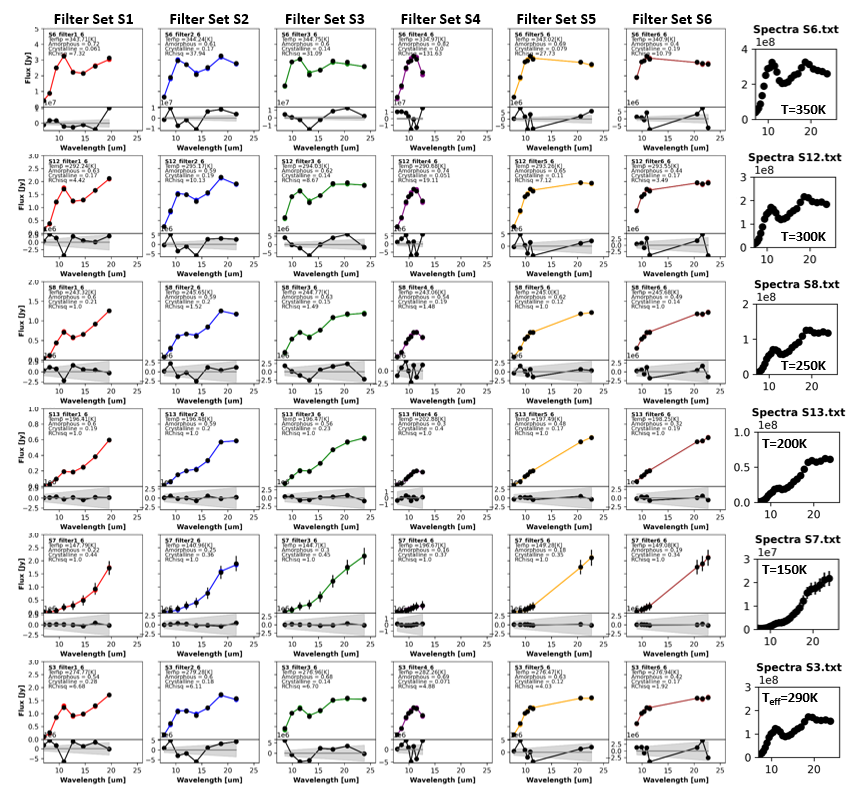
Figure 2. Summary of the final retrieval of temperature and composition (T & three silicates) for the 6 spectra with spectral shape (rows) using the 6 filter sets (columns) defined in Table 1. The last column on the right shows the original high-resolution spectra.
Laboratory Spectral Analysis: We examined laboratory spectra of minerals and meteorites likely to be present/analogous to the anticipated primitive comet. These include minerals used in the OSIRIS-REx collection [6] and carbonaceous meteorites from [7]. From these, we identified several key features for compositional determination generally centered within 8-12 µm (Subset in Table 1).
We included a set of mineral mixtures with known amorphous content from [8] to test the filter set ability to identify crystalline content of the material. Differences were subtle at low amorphous content and unlikely to be captured at this spectral resolution. Another set included hydrated/altered meteorites from [7]. Tested filter sets captured the overall spectral shape of the meteorite composition and including longer wavelengths (12-15 µm region) improved differentiation of hydrous alteration. It was determined that TIRI alone would be unable to quantify surface ice content, but hydration of surface mineralogy may be detectable.
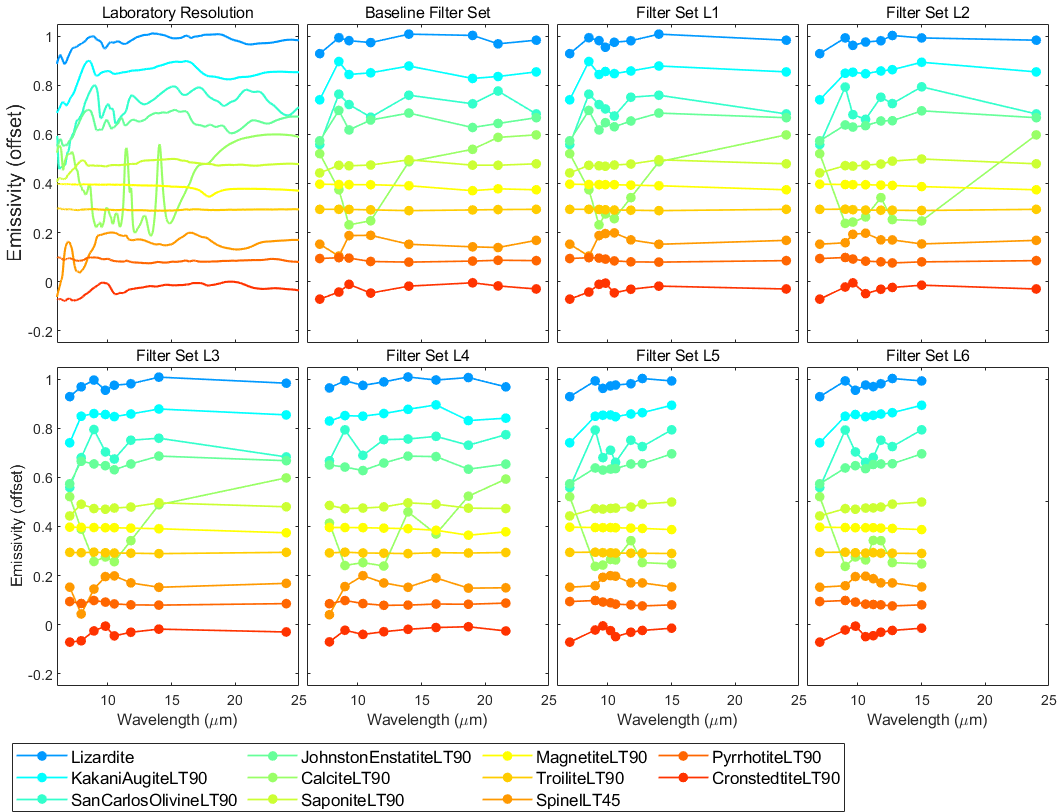
Figure 3. Minerals from the OSIRIS-REx collection [6] and lizardite (unpublished) at laboratory resolution, TIRI baseline, and filter sets defined in Table 1.
Discussion: The synthetic analysis showed that filters covering a large range is necessary to capture both temperature and spectral shape of the target comet. The laboratory analysis showed that, while a concentrated filter set was better at distinguishing minute differences between compositions, a wider range of filters can still provide adequate qualitative spectral information to achieve TIRI’s science objectives. We thus propose shifting to the new filter set that encompasses a slightly smaller range (8-22 µm) to retrieve temperatures and to better capture mid-range compositional features (Table 1, starred set).
Investigations will continue to incorporate a larger range of compositional spectra into the synthetic analysis model to better understand possible instrument performance and further explore the challenges of compositional unmixing for our target comet.
Acknowledgments: We thank the entire Comet Interceptor team for their inputs into this analysis, and the use of online databases including PSG & RELAB.
References: [1] Snodgrass C. et al (2019) Nat Commun 10, 5418. [2] Villanueva G. L. et al., (2018) JQS&RT 217, 86-104. [3] Lisse C. M. et al., (2006) Icarus, 313, 635-640 [4] Lisse C. M. et al., (2007) Icarus, 191(2), 223-240. [5] Lisse C. M. (2008) Icarus 195(2), 941-944. [6] Donaldson Hanna K. L. et al. (2021) JGRP 126(2) [7] Bates H. J. et al. (2021) JGRP 126 [8] Donaldson Hanna K. L. et al. (2018) LPSC 49 #1867
How to cite: Shirley, K., Warren, T., Faggi, S., Villanueva, G., Protopapa, S., Donaldson Hanna, K., Kohut, T., Bowles, N., Nasila, A., and Thirumangalath, S.: Optimizing Filter Bandpass Selection for the Thermal Infrared Imager on ESA’s Comet Interceptor Mission, Europlanet Science Congress 2022, Granada, Spain, 18–23 Sep 2022, EPSC2022-486, https://doi.org/10.5194/epsc2022-486, 2022.
The Rosetta mission revealed the extraordinary complexity of the surface of comet 67P/Churyumov-Gerasimenko (67P) nucleus. The images and spectra from the OSIRIS and VIRTIS instruments showed a great variety of morphology structures as well as some variability of spectral features and slopes [1][2][3].
The study of water ice in comets is paramount for understanding the water content and evolution of those bodies. The surface of 67P is mainly covered by a mantle of organic-rich dust. When warmed by the solar thermal waves, the volatiles trapped in the subsurface layers start sublimating, and sometimes the upper dust mantle is disrupted, revealing the volatile-rich nature of the subsurface. These spots of exposed water ice show a flatter (“bluer”) spectral slope in the range 500-800 nm with respect to the average slope of the nucleus (11%/100 nm at 1.3° phase angle) [4][5]. The exposed ice spots can show diurnal variations or be stable over months [6], and the sublimation-triggered exposure mechanism has been demonstrated in the laboratory under comet-like conditions [5]. Observations showed that water vapor can also recondense on the shadowed regions, where the surface temperature is lower [7]. The recondensed frost becomes visible when the shadow retreats and disappears within minutes. Thermal modeling indicates that the ice thickness must be about 10 µm or lower [8], suggesting that the ice in these regions is most probably inter-mixed with dust particles.
We are investigating in the laboratory the detection of frost condensation on asteroid simulants (CR-type from [9]). We use the POLarimeter for ICE Samples (POLICES) at the University of Bern, installed inside a black airtight enclosure. The sample is in the middle of the enclosure, illuminated by an optical fiber connected to a monochromator and held by a motorized arm that illuminates the sample with different incidence angles. A camera is placed on the other side of the arm looking at the sample at an angle of 45°. Finally, a full-Stokes polarimeter (Dual PEM II/FS42-47) is placed on top of the enclosure above the sample, measuring the polarization state of the light scattered by the sample. The dust sample is actively kept at a temperature of approximately 150 K through liquid nitrogen circulation. At the beginning of the experiment, the dust layer is uncovered and air with 15% relative humidity is pushed into the enclosure while keeping the sample cold. The phase angle is fixed, and the sample is alternatively illuminated every 30 seconds with blue (450 nm) and red (750 nm) light. At each wavelength, the reflectance and polarization state of the sample are measured over time, while the frost grows on top of the cold grains.
In Fig. 1 we show an example of experimental results obtained following this procedure, with the sample illuminated with an incidence angle of 12°. In the first 20 minutes of condensation, the small particles of ice deposited on top of the sample are transparent and the overall reflectance increases by 0.4% in the blue and 0.2% in the red, while the linear polarization decreases from the initial value of -0.45% to a value of -1.15% in the blue and -0.67% in the red. The polarization continues to decrease until a minimum is reached in both wavelengths (after 45 and 65 minutes from the beginning of the experiment). At this point, the ice thickness makes it opaque and the reflectance increases more steeply, while the linear polarization decreases because of the increase in multiple scattering. The 450 – 750 nm spectral slope decreases by 1%/(100 nm) in the first 20 minutes. We would like to stress that a change in linear polarization of 1% at 450 nm is very significant, changing the shape of the whole polarization phase curve drastically. The polarization phase curve at small phase angles reflects important properties of the surface materials, and its sensitivity can be used to distinguish different classes of asteroids.
We simultaneously observed the ice deposition with a long-distance microscope (~10 µm resolution) and in the first 30 minutes of the experiment, no visible changes affected the sample, confirming that at the beginning the frost layer is smaller than 10 µm and mainly transparent.
We demonstrated that variations of linear polarization over time (especially at the shortest visible wavelengths) are a viable way to detect thin layers of frost depositing on top of dark dust layers when the spectral slope is still not affected significantly. Measuring the frost deposition with additional wavelengths and phase angles is a future extension of this work, and will allow us to compile the full spectropolarimetric properties of this process.
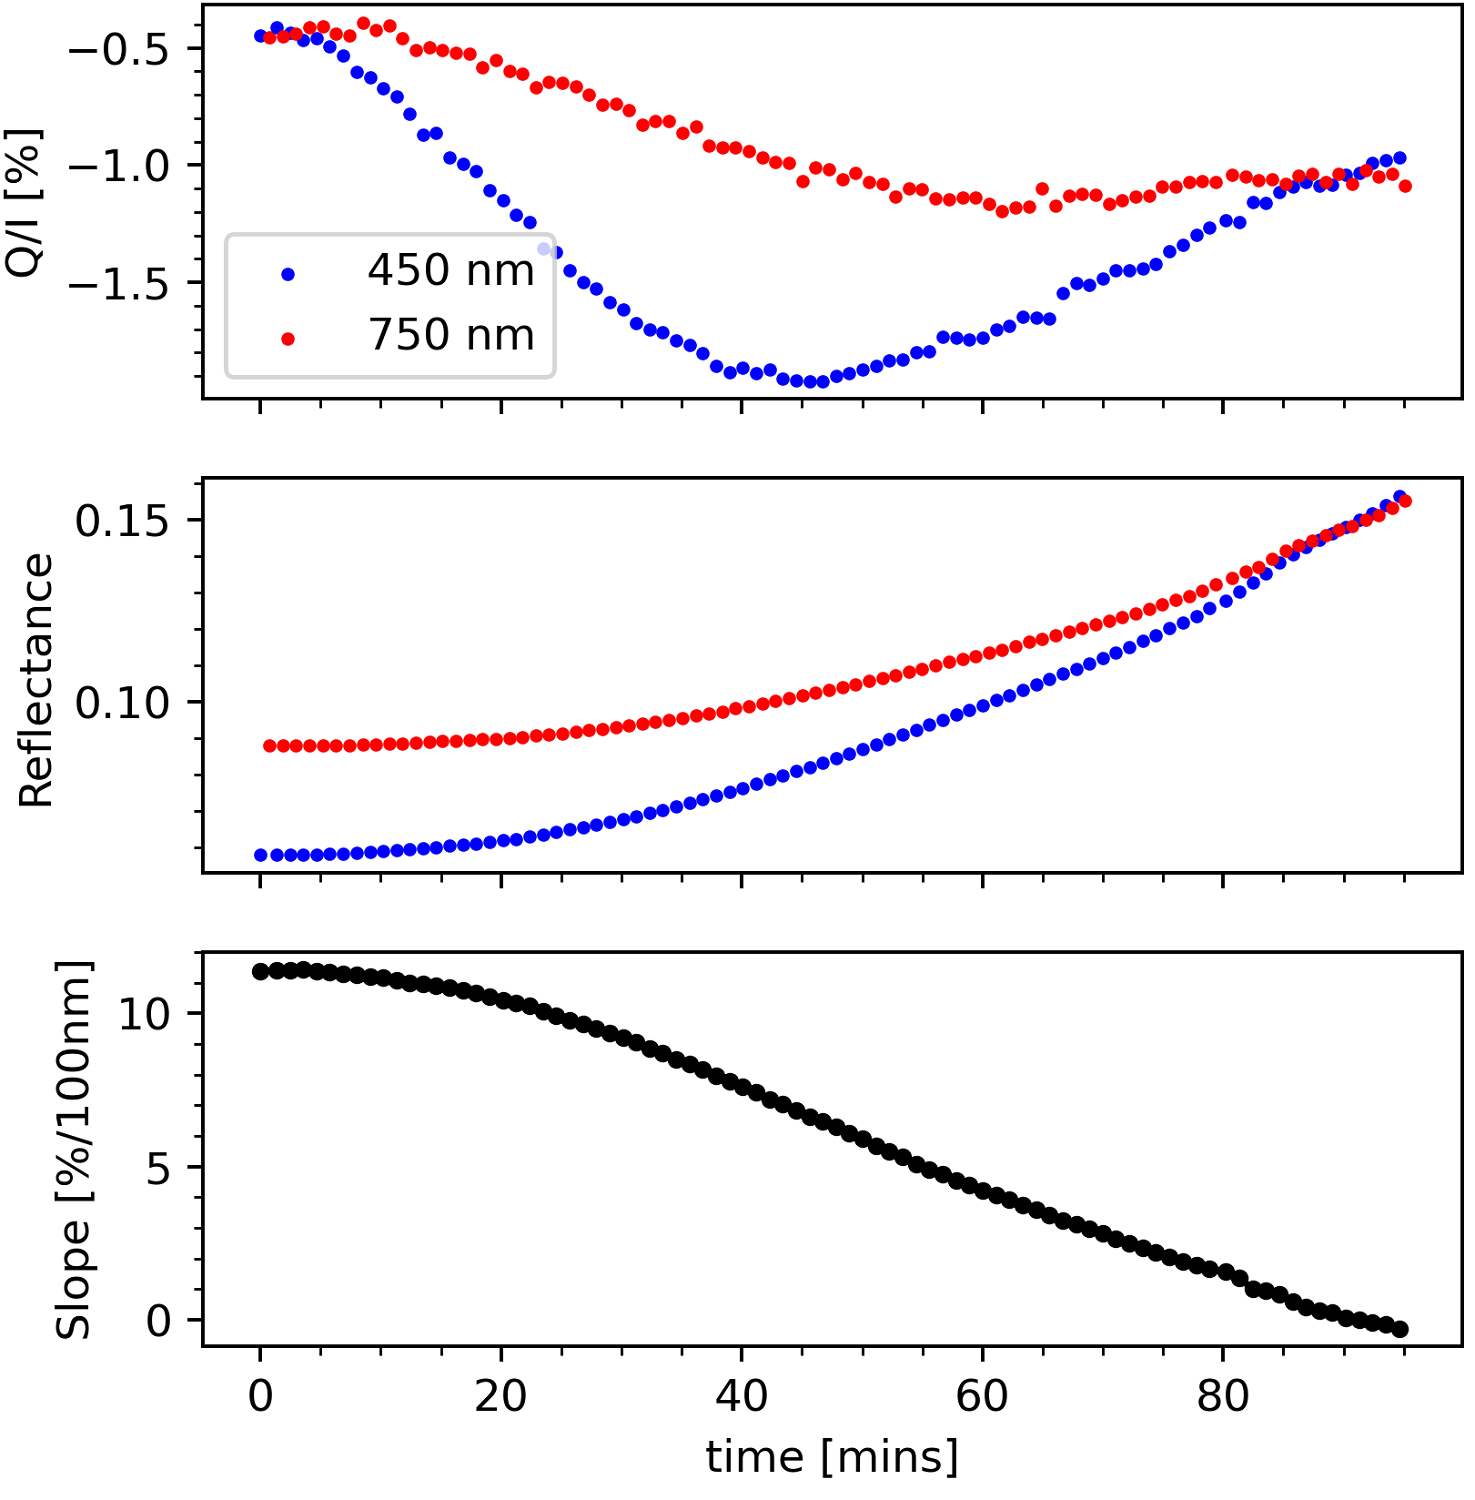
[1] Sierks, Holger, et al. "On the nucleus structure and activity of comet 67P/Churyumov-Gerasimenko." Science 347.6220 (2015): aaa1044.
[2] Thomas, N., et al. "The morphological diversity of comet 67P/Churyumov-Gerasimenko. Science 347: aaa0440." (2015).
[3] Capaccioni, Fabrizio, et al. "The organic-rich surface of comet 67P/Churyumov-Gerasimenko as seen by VIRTIS/Rosetta." Science 347.6220 (2015): aaa0628.
[4] Fornasier, Sonia, et al. "Spectrophotometric properties of the nucleus of comet 67P/Churyumov-Gerasimenko from the OSIRIS instrument onboard the ROSETTA spacecraft." Astronomy & Astrophysics 583 (2015): A30.
[5] Pommerol, Antoine, et al. "OSIRIS observations of meter-sized exposures of H2O ice at the surface of 67P/Churyumov-Gerasimenko and interpretation using laboratory experiments." Astronomy & Astrophysics 583 (2015): A25.
[6] Filacchione, Gianrico, et al. "An orbital water-ice cycle on comet 67P from colour changes." Nature 578.7793 (2020): 49-52.
[7] De Sanctis, Maria Cristina, et al. "The diurnal cycle of water ice on comet 67P/Churyumov–Gerasimenko." Nature 525.7570 (2015): 500-503.
[8] Fornasier, Sonia, et al. "Rosetta’s comet 67P/Churyumov-Gerasimenko sheds its dusty mantle to reveal its icy nature." Science 354.6319 (2016): 1566-1570.
[9] Britt, Daniel T., et al. "Simulated asteroid materials based on carbonaceous chondrite mineralogies." Meteoritics & Planetary Science 54.9 (2019): 2067-2082.
How to cite: Spadaccia, S., Patty, L., Thomas, N., and Pommerol, A.: Detection of frost formation on regolith-like materials - polarization and spectral variations, Europlanet Science Congress 2022, Granada, Spain, 18–23 Sep 2022, EPSC2022-496, https://doi.org/10.5194/epsc2022-496, 2022.
Introduction: Spectroscopic data is rich and powerful to study surfaces. Besides, planetary surfaces are often made of intimately mixed components [1, 2], so modelling a reflectance spectrum will mean fitting a relatively large number of inter-related parameters: at least, one proportion and one grain size for each component in the case of a granular mixture, plus structure parameters (roughness, porosity). In these large parameters spaces, it is highly possible that multiple solutions give an equally satisfactory fit [3]. It is crucial to evaluate the ability of a method to retrieve multiple solutions when setting up an inversion strategy.
Data: This work was done in the context of revisiting the Europa Galileo NIMS dataset. We compared the solutions of different methods on a radiative transfer model, based on Hapke modeling [1] and an observation of a bright region of Europa NIMS cube 14e006ci [4] with 4 components : crystalline ice, hexahydrite, magnetite and sulfuric acid octahydrate. The uncertainty on the data is assumed to be gaussian with a standard deviation at 10% with a minimum at 0.01 in reflectance.
Method: The parameters space is on dimension 9, with 8 independent parameters: 4 abundances, 4 grain sizes and the surface roughness. We noted early in our work that while reproducing the data equally well, two minimisations algorithm would give different results for the parameters, meaning the solution is not unique. To explore the set of possible solutions, four methods were compared: (i) home-made Markov Chain Monte-Carlo (MCMC) method with metropolis hasting sampler [5] (ii) home-made MCMC method with improved metropolis-hasting sampler [this work] (iii) open-source multi-chain MCMC algorithm with "snooker" sampler [6] (iv) multiple minimizations, using ”L-BFGS-B” bound-constrained algorithm with random initialisations [7].
To be able to compare the efficiency of the different methods, we limited the number of direct model evaluations to 1.5.106. This number was chosen for 2 reasons: (i) each algorithm tested seemed to have reached "convergence": increasing the number of iterations did not change significantly the result, and (ii) identical and affordable computational cost between the methods. This means that for MCMC methods, we set the number of iterations to 1.5.106. For the multiple minimizations method, each minimization resulted in approximately 1500 model evaluations to reach the result. So we performed 1000 minimisation with 1000 different random initialisations. For each of the model evaluation, a likelihood is computed, making the comparison between this method and the bayesian ones possible.
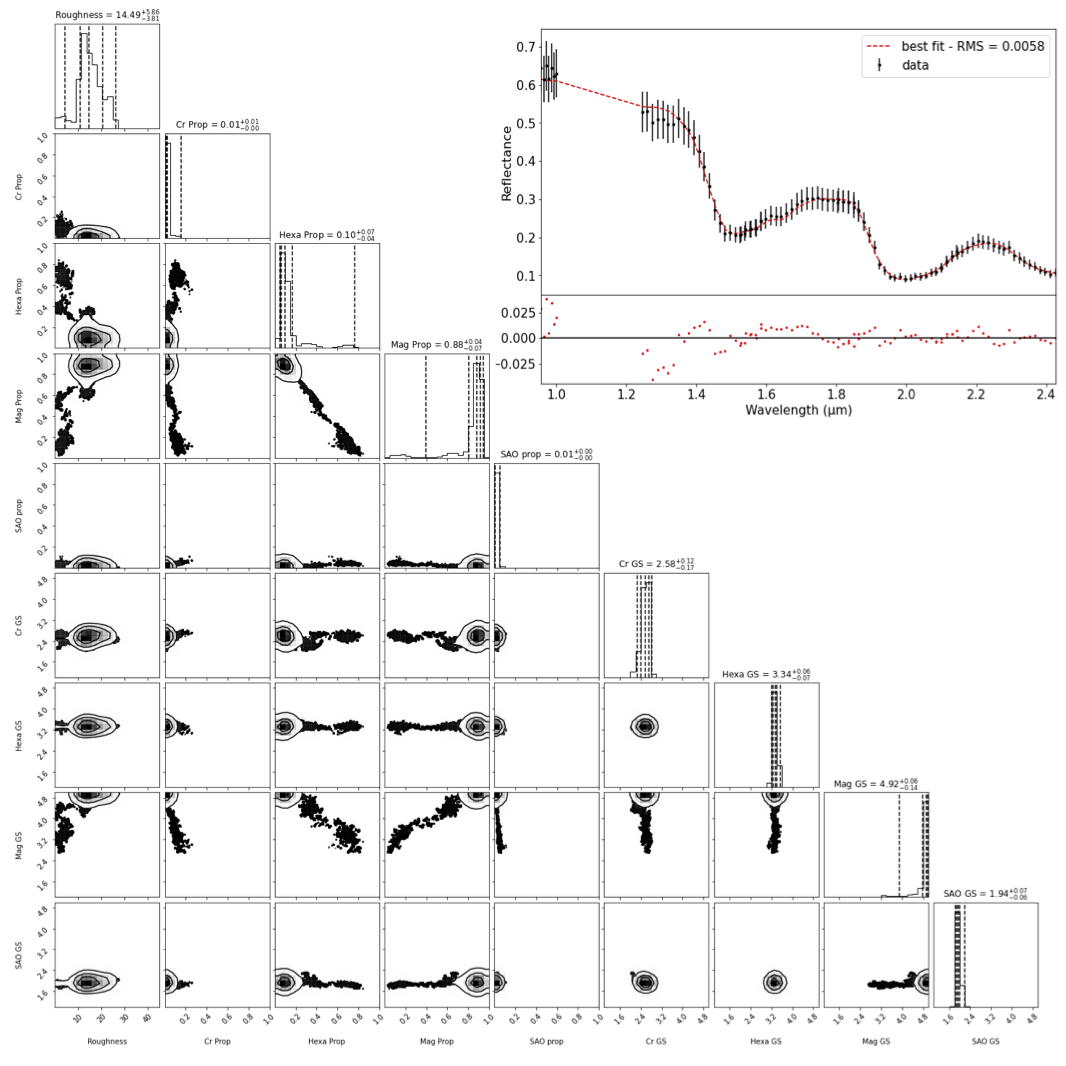
Figure 1: Corner plot and best fit for home-made MCMC method with Metropolis-Hasting sampler with a converged chain of 1.5 106 iterations. The sampling is done with 3 cases: agnostic uniform distribution over the full prior space, in far neighbourhood, in close neighbourhood. The corner plot represents the pairwise posterior distributions, and the marginal posterior distributions for each parameter. Parameters are from left to right roughness, 4 abundances, 4 grain sizes and from top to bottom 4 abundances and 4 grain sizes. Acceptance rate is 0.217.
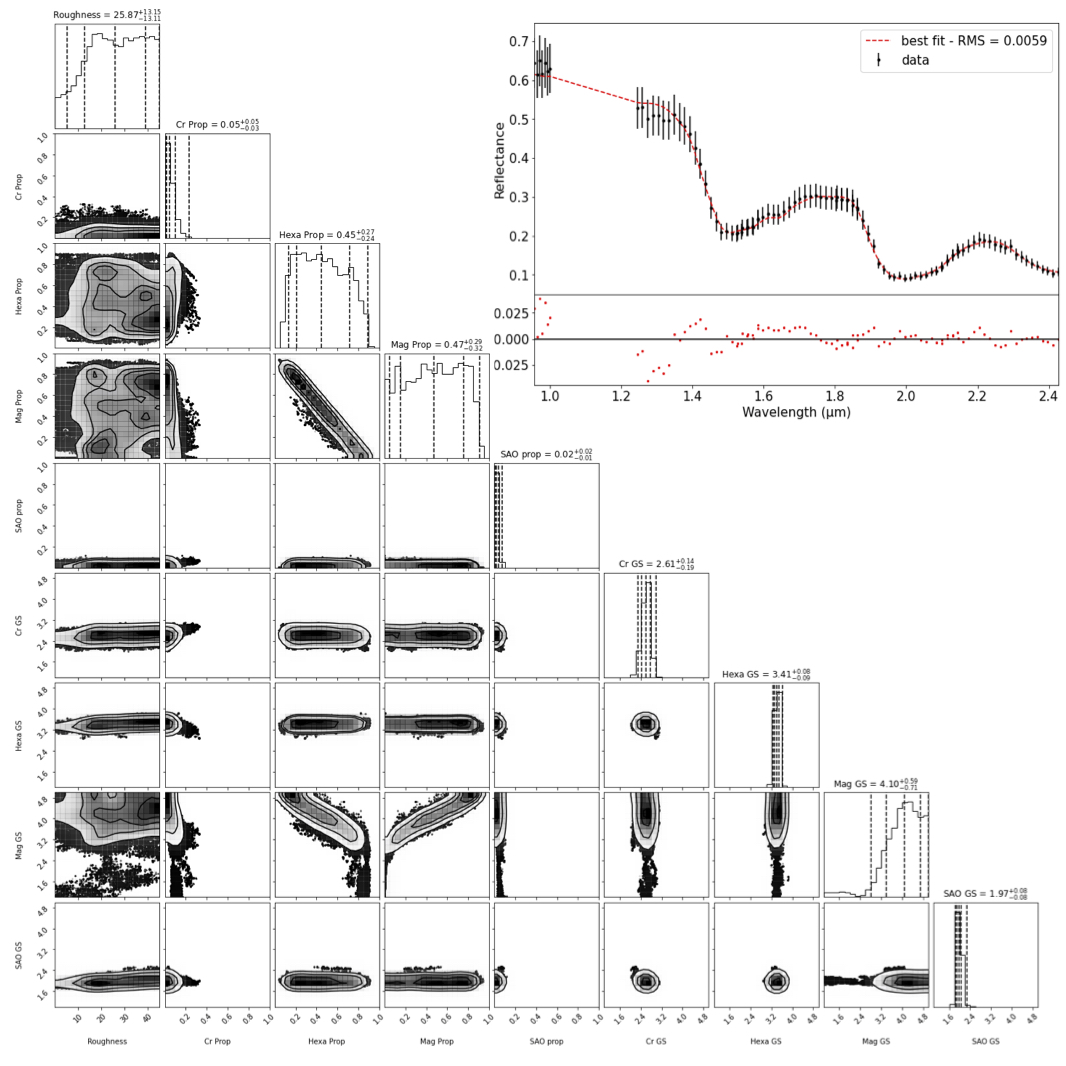
Figure 2: Same as fig 1 but in this case the sampling is done with 4 cases: agnostic uniform distribution over the full prior space, in far neighbourhood, in close neighbourhood, 1 single parameter modification. Acceptance rate is 0.288.
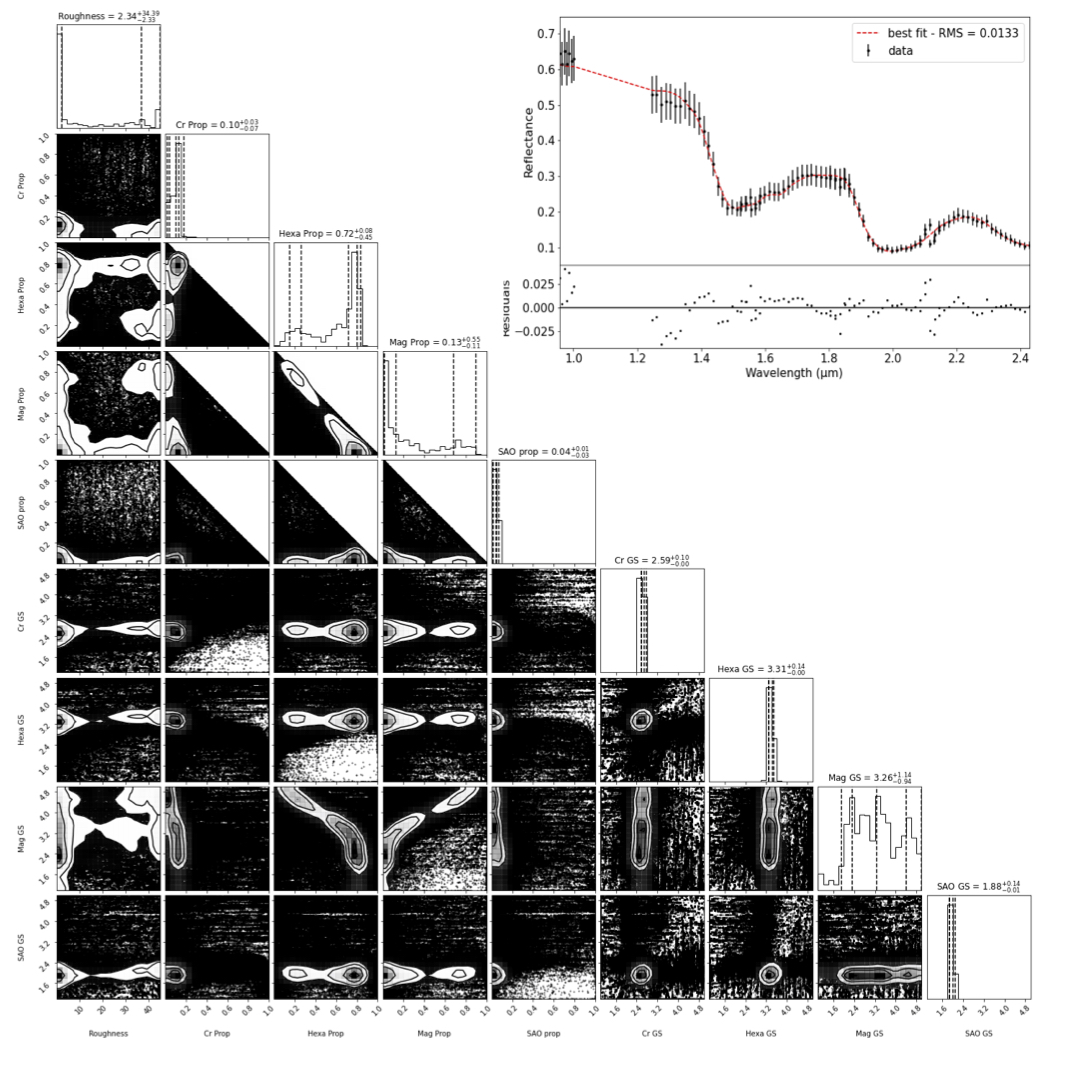
Figure 3: Same as Fig1 but for 1000 multiple RMS minimisations with random initialisations. The 1500 points for each path has been recorded and converted into likelyhood to build the posterior distribution.
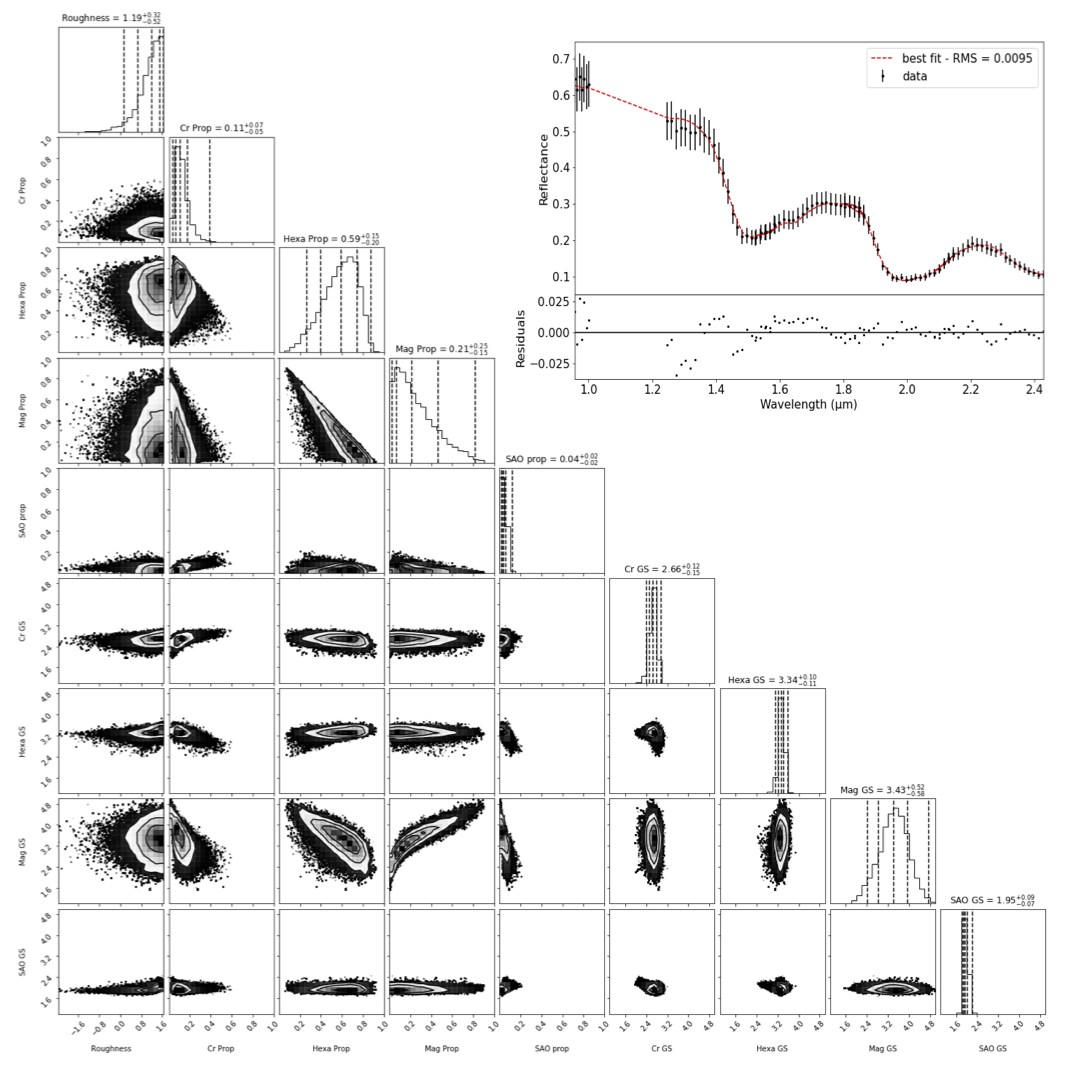
Figure 4: Same as Fig. 1 using the SNOOKER algorithm. Acceptance rate is 0.217.
Results: Three proxies must be compared when evaluating the perfomance of each method: quality of the best fit, posterior distribution, and computational efficiency. The results for the best fits and posterior distributions are displayed in figures 1-4: all methods manage to reproduce the data equally well. Nevertheless, the posterior densities are different. On these corner plots, each black dot is a point in the parameter space that has been computed (1.5 106), but only the densities (solid lines) are relevant (with a non-negligible likelihood). The first method with home-made MCMC clearly fails to find a posterior distribution in agreement with others methods. It mean it "gets stuck" in a local solution, and the sampler fails to explore properly the parameters space. The three other methods show a relatively good agreement. On the numerical cost, we showed that lowering the number of model evaluations for the home-made MCMC with improved metropolis hasting sampler, and for the multiple minimisations method would significantly alter the results, while increasing the number of model evaluation, would not, meaning both methods are of equivalent numerical performance. The results of the open source multi chain MCMC method with snooker sampler were not significantly altered down to 2.105 iterations, meaning it is almost 10 times more efficient than the other methods to retrieve surface properties.
Conclusion: Four inversion strategies have been compared to retrieve surface properties of Europa using a radiative transfer model inversion. This work showed the significant improvements of the multi-chain MCMC method using the SNOOKER sampler, compared to others. This method will be used in future work. In addition, this work stresses the fact that even MCMC sampler are by construction asymptotically sampling the posterior distribution, they may present an apparent converged chain that is actually biased.
This study may be extrapolated to other datasets, and other models, with large parameters spaces (at high dimension), and correlated parameters, such as photometric inversions.
References:
[1] Hapke, 2012 Cambridge Univ. Press [2] Douté & Schmitt, 1998 JGR. [3] Schmidt & Fernando, Icarus, 2015 [4] Cruz-Mermy et al., 2022 EPSC. [5] Schmidt & Bourguignon , Icarus 2019 [6] Cubillos et al. (2016), The Astr. Jour. [7] Byrd et al., 1995 SIAM
How to cite: Andrieu, F., Schmidt, F., Cruz-Mermy, G., Belgacem, I., and Cornet, T.: Benchmarking Bayesian methods for spectroscopy, Europlanet Science Congress 2022, Granada, Spain, 18–23 Sep 2022, EPSC2022-502, https://doi.org/10.5194/epsc2022-502, 2022.
Introduction:
The properties of icy surfaces in the Solar System evolve under the effect of numerous processes either external, internal or induced by the climate. Thanks to spaceborne remote sensing data, we have access to the current microphysical and compositional state of ices (see for instance Cruz Mermy et al 2022, EPSC [1]) but quantifying the numerous mechanisms involved remains challenging. To study these surfaces hard to access, our goal is to build a one-dimensional numerical model of planetary ices evolving over time.
This task consists in creating an unprecedented innovative tool general to many icy surfaces in the solar system, similar to what the SNOWPACK model does for Earth snow evolution (Tuzet et al., 2017 [2]). These simulations would predict ice microphysics within a depth of a few meters evolving on multiple seasons. They will integrate multiple physical processes (heat transfers, phase changes, surface energy balance, ice grains metamorphism and spatial weathering) acting on the ice layers and couple them with each other.
The numerical scheme will be designed to be versatile enough to activate/deactivate each physical process parametrization. When possible, several approximations of each process will be designed in order to better control numerical efficiency versus realism. Several pieces are already present in the literature, but the novelty and extremely promising nature of the present approach is to encompass them all, since they all contribute to the evolution of ices with potentially similar time and length scales.
We would like to present the thermic module which gives the evolution of the temperature profile of the ice for different layers of variable properties. Previous models have been designed to estimate the thermal transfer in the subsurface, such as LMD 1D (Forget et al, 1999 [3]), KRC (Kieffer et al., 2013 [4]), THERMPROJRS (Spencer et al. 1989 [5]). Among them, some have been designed to model Earth snow evolution, such as SNTHERM (Jordan, 1991 [6]) and SNOWPACK (Tuzet et al., 2017 [2]). Here, we propose to follow the standard heat equation but solve it numerically for non-constant heat properties, especially with time and depth dependent thermal inertia.
Methods:
In this model, the boundary condition is given by the energy equilibrium at the surface: the incoming absorbed solar flux is balanced by the black body emission and the heat flux from the ground. The thermic properties of the materials can be depth and time dependent. We have discretized the heat equation in these conditions and solved the system of equations with an implicit solver.
The spatial grid representing space is discretized as a vector which starts at the planet’s surface and ends such that the zero-flux condition at the bottom is respected. In terms of time discretization, we run the algorithm several sideral days, with a thousand timesteps each. The aim is to validate the algorithm by comparing with analytical and standard numerical solutions.
Results
Validation of our algorithm by comparison with well-known analytic solutions of the heat equation is possible in specific conditions. For a material of constant conductivity, density and heat capacity, the one-dimensional heat equation can be solved analytically for a given set of initial and boundary conditions. In particular, for an initial step function profile bounded in a box with no flux at the boundaries, the solution can be expressed as a Fourier Series which is obtained through separation of variables. Results show a perfect fit between the numerical and analytical solutions which proves that our model works well for a material with constant properties (see figure 1).
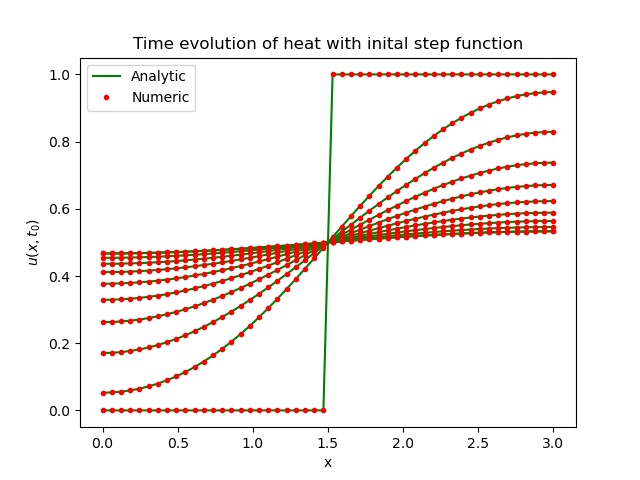
Figure 1: Comparative evolution of the temperature profiles.
In more complex cases, in particular when the heat conductivity is depth dependent, analytical solutions of the heat equation do not exist. In these cases, validation of the model comes from comparison with experimental data or from other previously well-established numerical algorithms. Here we choose to compare our method with Spencer’s explicit algorithm for realistic planetary surface conditions (Spencer et al. 1989).
To compare these two models, one must make sure that the initial conditions are the same. Notably, the solar flux responsible for the temperature evolution must be equal. In this fairly simple insolation model Spencer chose to approximate the heating of a planet surface by the Sun throughout a sidereal day by a sinusoidal function. The resulting total surface flux is the equilibrium between the solar flux and the surface black body emission. Results show that the two flux are identical (see figure 2).
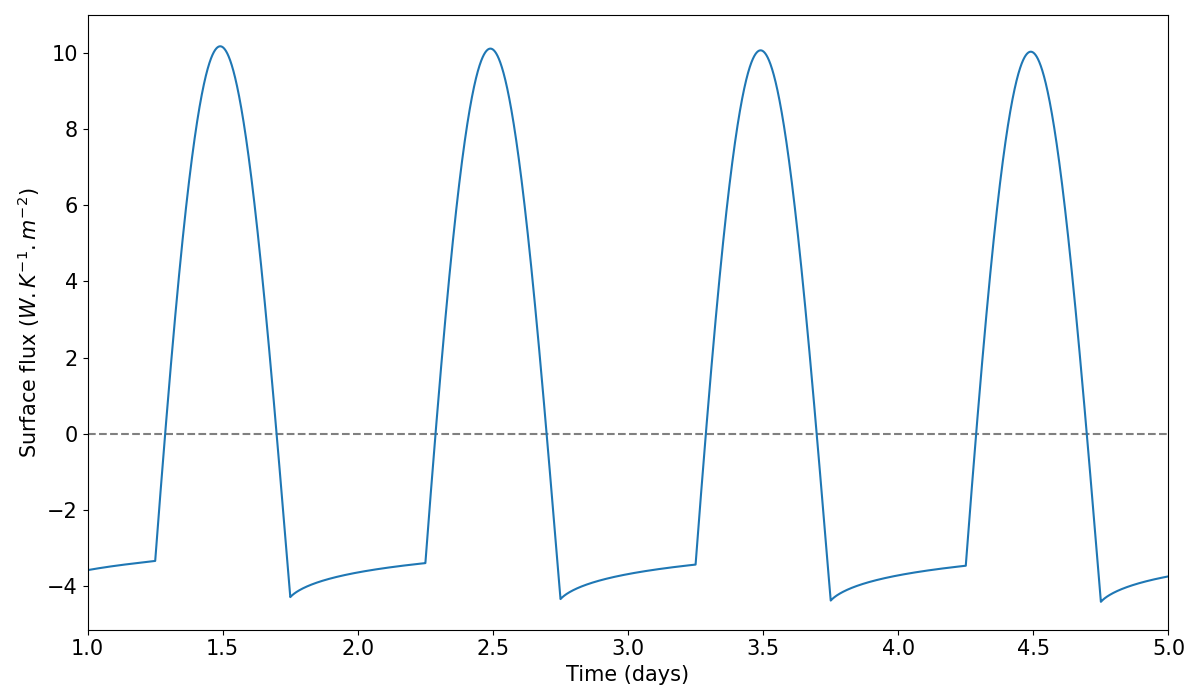
Figure 2: Evolution of the surface flux during multiple days (Blue).
For the sake of validation, values of density, heat capacity and conductivity were varied as a function of depth by the largest scales allowed by Spencer’s explicit scheme stability criteria (see figure 3).

Figure 3: Depth dependant properties profiles.
These results show that our implicit model is fully compatible with Spencer’s explicit algorithm, without the restrictions of stability (see figure 4). Using an implicit model will greatly help us to choose our own set of parameters.
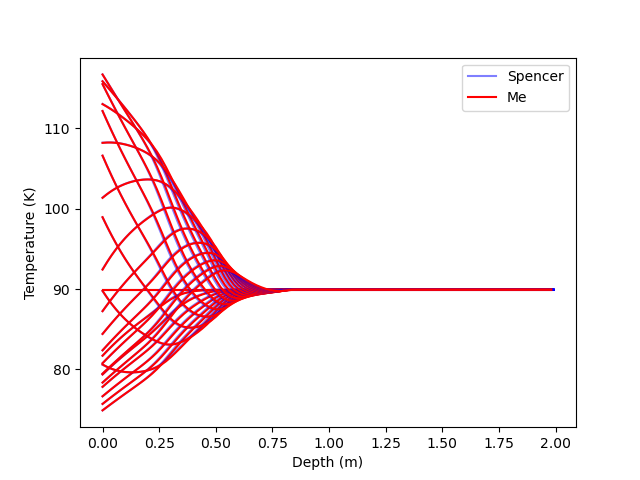
Figure 4: Comparative evolution of Spencer’s temperature profile (Blue
lines), and our implicit scheme temperature profiles (Red lines).
Conclusion and Perspectives
We implemented an implicit numerical scheme in Python to solve the heat transfer equation in a layered medium. It has been validated by comparison with analytical solutions and a reference numerical implementation. Our implicit scheme solver of the heat equation has the advantage of ensuring stability and convergence regardless of the material’s properties.
Now we plan to extend our simulation by coupling other processes acting on ice microphysics like ice grains metamorphism. We also plan to use this algorithm to retrieve surface properties in infrared and radar wavelength.
References:
[1] Cruz-Mermy et al., 2022, EPSC 2022
[2] Tuzet et al., 2017, The Cryosphere, 11
[3] Forget et al, 1999, JGR, 104
[4] Kieffer et al., 2013, JGR, 118
[5] Spencer et al. 1989, Icarus, 78
[6] Jordan, 1991, Documentation SNTHERM, 89
How to cite: Mergny, C. and Schmidt, F.: Numerical modeling of thermal wave in layered icy surface, Europlanet Science Congress 2022, Granada, Spain, 18–23 Sep 2022, EPSC2022-592, https://doi.org/10.5194/epsc2022-592, 2022.
Introduction: DART mission will be the first to undertake an orbital deflection experiment against a Near-Earth Asteroid. The smallest member of the binary Didymos-Dimorphos system will be impacted by the 660-kg spacecraft at the velocity of 6.6 km/s, leading the orbital period to change in return. The expected baseline kinetic energy is 9.7 GJ [1], about half the input energy of Deep Impact[2], and >10^5 kg of mass is to be released [3].
The impact will produce an ejecta plume, lasting for several minutes [3], that will be observed by ASI/LICIACube camera up to about 4 m/px resolution [4,5] and phase angles ranging from 45 to 120 deg. The plume is therefore expected to be resolved during several frames and its phase function studied in order to retrieve properties such as albedo, grain size frequency distribution and optical depth. Therefore, we put forth a light scattering model that relies on previous knowledge about the Dydimos binary system composition [6] and the Deep Impact event [7].
LICIACube Observations: The Light Italian Cubesat For Imaging Asteroids is a 6C Cubesat hosted by DART spacecraft. LICIACube will detach from DART spacecraft 10 days from the nominal impact date of 26th September 2022 to start the trajectory correction to be positioned in fly-by mode. LICIACube payload holds two optical cameras, LUKE and LEIA, designed for color imaging studies [5]. At 167 sec after the impact, the Italian Cubesat will reach the closest approach and obtain the highest resolution images from the binary system.
Methodology: grain size range. To provide support and analyze the broad grain’s size distribution range expected in the plume, we relied two numerical codes covering two different size regimes: (i) The Mishchenko et al., [8,9] radiative transfer code for Mie-Lorentz scatters distribution (~0.5-80 microns size in visible range) with Percus-Yevick filling factor correction (called RTT-PM, [10]) to model the thick portion of the plume; (ii) and the Muinonen et al. [11] ray optics code for diverse particle shapes and sizes higher than 100 microns.
model conditions. The plume boundaries are considered much similar to an atmospheric cloud, with particles sparse, many mean radii separated from each other, and the observations in far-field, removed several kilometers from the object of study. Furthermore, we imposed that the number of large particles (>100 microns) is much smaller than the number of Mie-Lorenz particles, therefore limiting the interactions among the large particles, but not with the small particles. Hence, the validity regime for the radiative transfer equation is conserved. Furthermore, coherent effects, shadowing, and opposition effect mechanisms are out of the scope of our calculations and observational conditions with LICIACube.
interaction. The interactions are only resolved between the thick cloud and the >100 microns particles. In the first approach, we compute the particles hovering over the radiative transfer semi-infinite plane of the thick plume, as it gets backlit in varied distances up. In reverse, the thick plume is forward-lit by the particle scattering. In the second approach, the large particles are embedded in the thick plume up to optical depth = 5, again, the medium is considered sparse.
Preliminary Results: Given that Didymos is an S-type asteroid, with visible spectra profile very similar to L/LL Chondrites [6], we selected the Itokawa sample size frequency distribution obtained by the Hayabusa mission as analog [12]. L/LL Chondrite most abundant minerals are Fayalites and Ferrosilites. However only VIS optical constants for Fayalites were recovered [13], thus we stick with it in our simulations. In Fig. 1, we present the bi-directional reflectance distribution factor (BRDF) for the layers composing the plume in our simulation: (I) thick “core”, multiple-scattering Mie RTT-PM; (ii) “scattered small particles'', single-scattering-only Mie-Lorenz particle volumes; (iii) “scattered large particles”, single-scattering-only >100 microns particle volumes. The BDRF can therefore vary as the volumes become less opaque, leading to less reflectiveness for middle phase angles.
In future developments of our modeling, we will use results from ejecta dynamics to constrain the number of particles and population for different zones and lines of sights through the plume [14, 15, 16].
Furthermore, the interaction of the large particles and the thick Mie particle cloud is under refinement, as we test the codes for different binning, distances and depths. Nonetheless, first tests indicate a magnification of the overall BRDF for large azimuth angles, due to coupling with the overall forward scattering behavior of the large particles.
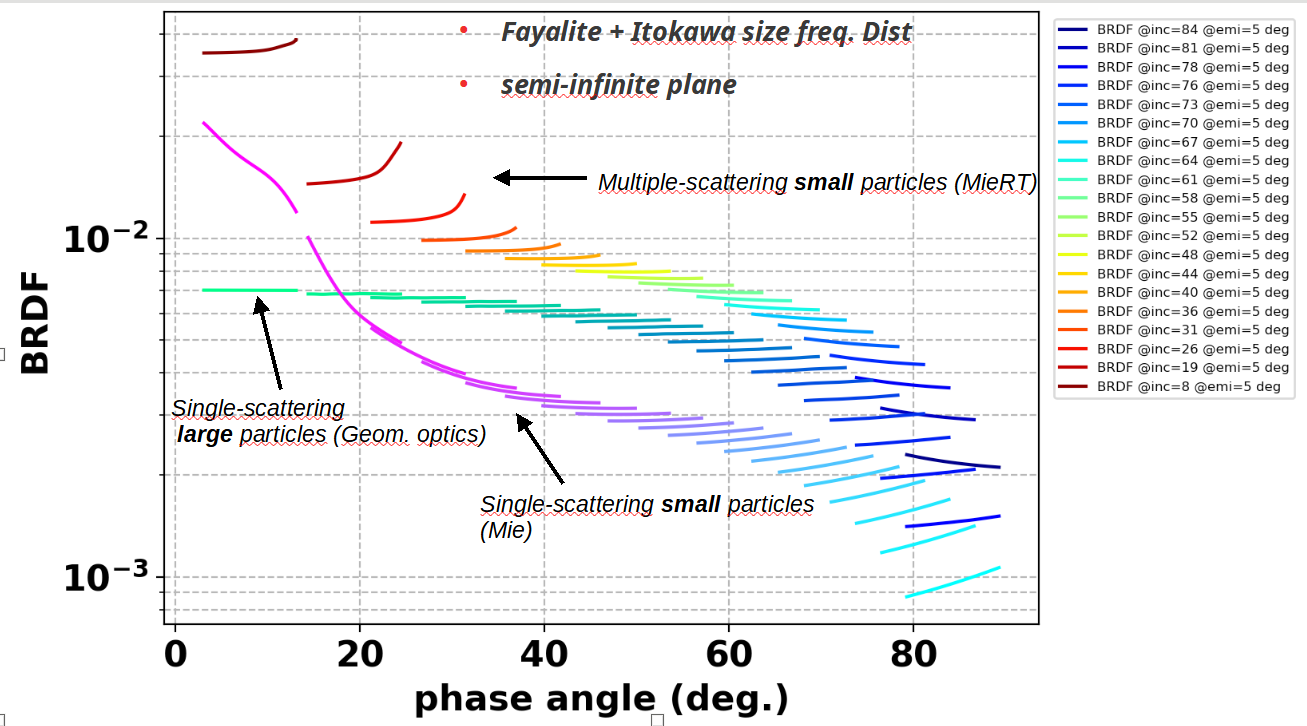
Fig. 1. bi-directional reflectance distribution factor for different layers of the plume, separately. Fayalite’s optical constants at 550 nm (Re(m)=1.6, Im(m)=5e-3) are used, together with Itokawa sample size frequency distribution (Nakamura et al., 2012). Filling factor for RTT-PM is fixed at 0.1%.
Acknowledgements: This research was supported by the Italian Space Agency (ASI) within the LICIACube project (ASI-INAF agreement AC n. 2019-31-HH.0).
References: [1] Sarli et al., 2017, AAS/AIAA 17-206.[2] Groussin et al., 2010, Icarus 205, 627–637.[3] Cheng et al., 2020, Icarus 352, 113989.[4] Dotto et al., 2021, PSS, Volume 199, 10518.[5] Poggiali et al., 2022, PSJ Focus Issue (submitted).[6] Ieva et al., 2022, PSJ Focus Issue (submitted).[7] A’Hearn, 2006, 229th IAU Sym. ACM Proc., 33-40.[8] Mishchenko et al., 1999, JQSRT, 63, 409-432.[9] Mishchenko et al., 2015, JQSRT 156, 97-108.[10] Ito et al;, 2018, JGRE 123, 5, 1203-1220[11] Muinonen et al., 2009, JQSRT 110, 14-16, 1628-1639.[12] Metzger & Britt, 2020, Icarus 350, 113904.[13] Fabian et al., 2001, A&A 373, 1125–1138.[14] Rossi, A. F. et al., 2022, PSJ, Focus Issue (in press).[15] Zanotti, G., and M. Lavagna, 2020, IAC 71.[16] Ivanovski et al., 2022, PSJ Focus Issue (submitted).
How to cite: Hasselmann, P. H., Bertini, I., Zanotti, G., Rossi, A., Ivanovski, S., Gai, I., Deshapriya, J. D. P., Mazzotta Epifani, E., Dotto, E., Della Corte, V., and Zinzi, A. and the LICIACube Team: DART mission ejecta plume: Modeling the reflectance through radiative transfer and geometric optics in support to LICIACube observations, Europlanet Science Congress 2022, Granada, Spain, 18–23 Sep 2022, EPSC2022-615, https://doi.org/10.5194/epsc2022-615, 2022.
Please decide on your access
Please use the buttons below to download the presentation materials or to visit the external website where the presentation is linked. Regarding the external link, please note that Copernicus Meetings cannot accept any liability for the content and the website you will visit.
Forward to presentation link
You are going to open an external link to the presentation as indicated by the authors. Copernicus Meetings cannot accept any liability for the content and the website you will visit.
We are sorry, but presentations are only available for users who registered for the conference. Thank you.
Please decide on your access
Please use the buttons below to download the presentation materials or to visit the external website where the presentation is linked. Regarding the external link, please note that Copernicus Meetings cannot accept any liability for the content and the website you will visit.
Forward to session asset
You are going to open an external link to the asset as indicated by the session. Copernicus Meetings cannot accept any liability for the content and the website you will visit.
We are sorry, but presentations are only available for users who registered for the conference. Thank you.