- 1Planetary Science Institute, Tucson, United States of America (jyli@psi.edu)
- 2Luleå University of Technology, 98128 Kiruna, Sweden
- 3Istitut Für Planeterkundung DLR, Berlin, Germany
Introduction: Results from the Dawn mission showed us an aqueously altered cryovolcanic world of Ceres, maybe a relict Ocean World [1, 2]. Geological studies suggested brine-driven features, including the cryovolcanic dome Ahuna Mons [3] and the Cerealia and Vinalia Faculae, which are carbonate- and chloride-rich evaporites [4] formed from brine extrusion with evidence of recent activity [5]. In addition, the Haulani crater is among the youngest impact features on Ceres [6], potentially excavating relatively fresh, volatile-rich subsurface materials with distinctly bright and blue spectral characteristics [7]. In this study, we focus on the spectrophotometric properties of the geologically young features, aiming to characterize Ceres’s regolith evolution and better understand the cryovolcanic processes. Here we report the preliminary results of the Haulani crater (latitude -3º to 14º, longitude 0º to 20º) and Ahuna Mons regions (latitude -17º to -3º, longitude 308º - 322º).
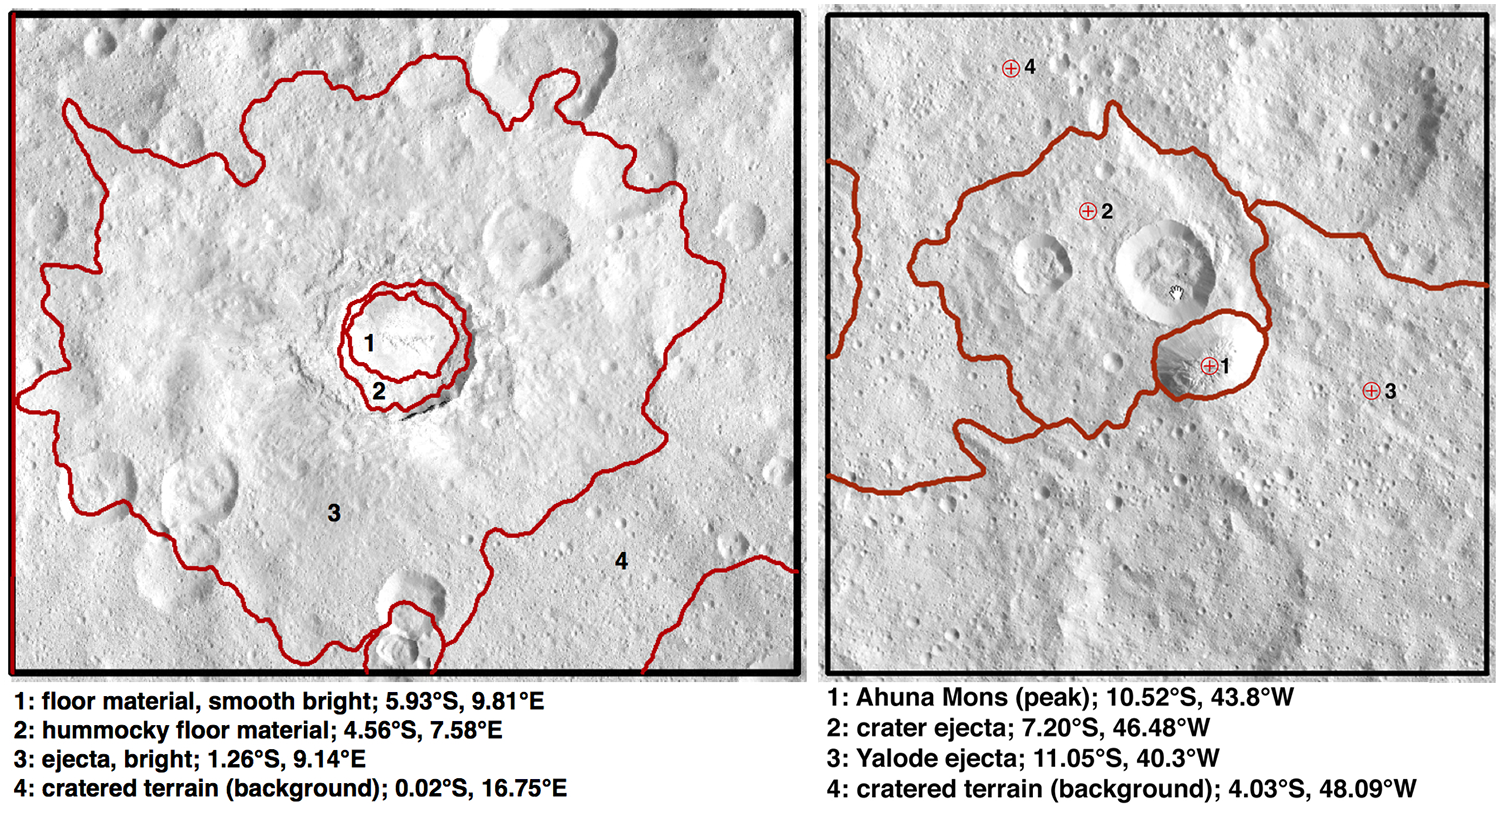
Data: We used the multiband images of Ceres collected by the Dawn Framing Camera with pixel scales <150 m/pixel and calibrated them to radiance factor (RADF) following [8, 9], including infield straylight removal for all color images. The scattering backplanes were calculated with the USGS ISIS software using the high-resolution digital terrain models from the Planetary Data System [10]. The alignment between the backplanes and the corresponding images was checked and adjusted. For each region, we defined four regions of interest (ROIs; Fig. 1) based on the geological context. Our photometric modeling was performed independently for each ROI in each of the seven color filters.

Figure 1. ROI of the Haulani crater region (left) and the Ahuna Mons region (right).
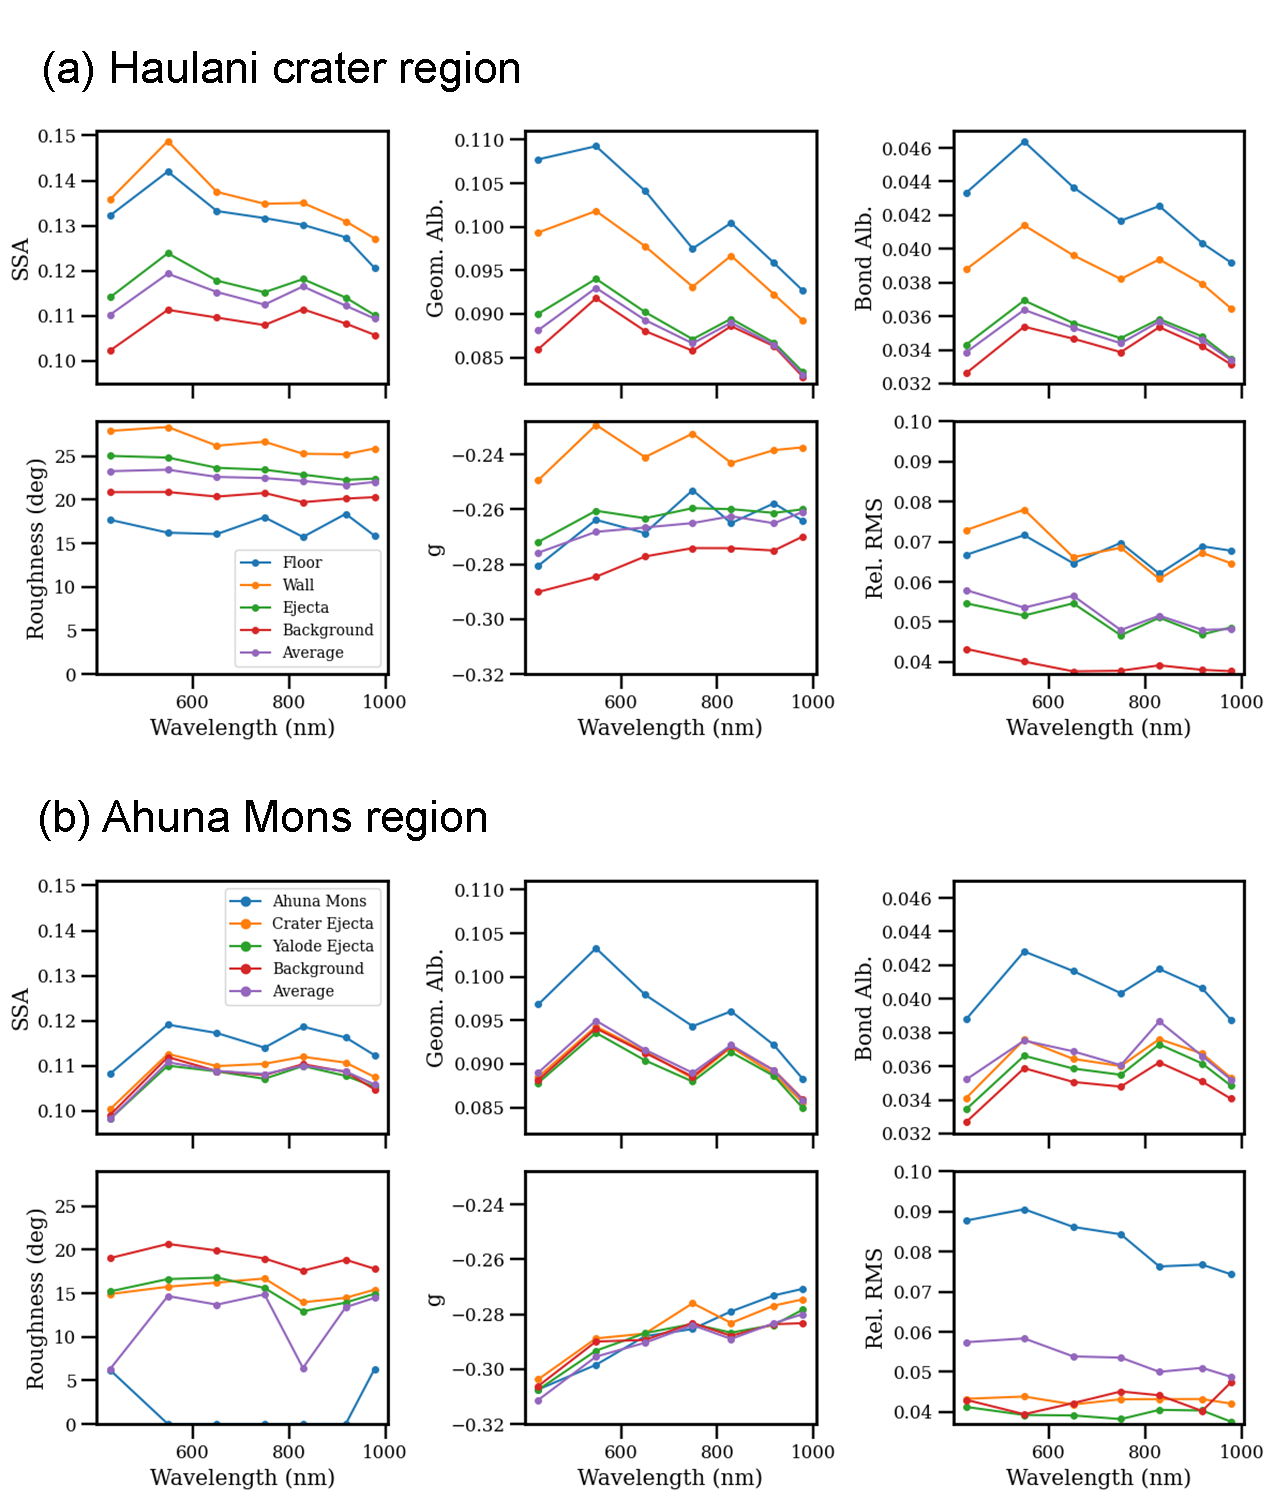
Photometric Modeling: We adopted the five-parameter version of the Hapke model as used by [11]. Without data at phase angles <20º, we assumed an amplitude parameter B0=1.6 and a width parameter h=0.06 for the shadow-hiding opposition effect [12]. The other three parameters, including the single-scattering albedo (SSA), asymmetry factor, g, of the single-term Henyey-Greenstein function for the single-particle phase function, and the roughness parameter are free for fitting. The best-fit model parameters were retrieved in a least-χ2 sense following [11]. Fig. 2 shows the spectra of the best-fit parameters. Overall the relative root-mean-squared, which is defined as rel.RMS=√[Σ(rmeasure-rmodel)2/N]/<rmeasure>, with rmeasure and rmodel being the measured and modeled reflectance, respectively, N being the number of data points, and <rmeasure> being the average measured reflectance, is 4-9%, compared to 4-6% of the global model [11], suggesting a reasonably good fit. The similar results for the background ROIs in all bands in the two regions indicate consistent model fitting across all ROIs. However, the 0º roughness parameter retrieved for the Ahuna Mons ROI in some bands is probably problematic, as also indicated by the relatively high model RMS for this ROI.

Figure 2. Modeled Hapke parameters for all ROIs in the Haulani crater region (a) and the Ahuna Mons region (b).
A comparison of all ROIs suggests that: 1) The photometric properties in the Haulani crater region are more diverse than those in the Ahuna Mons region. 2) The albedo spectra of all ROIs show a spectral feature centered in the 750 nm filter with varying characteristics. The nature of this feature is unclear. We further calculated the spectral slopes of the SSA and the g-parameter (excluding 440 nm) to quantify the color and phase reddening of all ROIs.
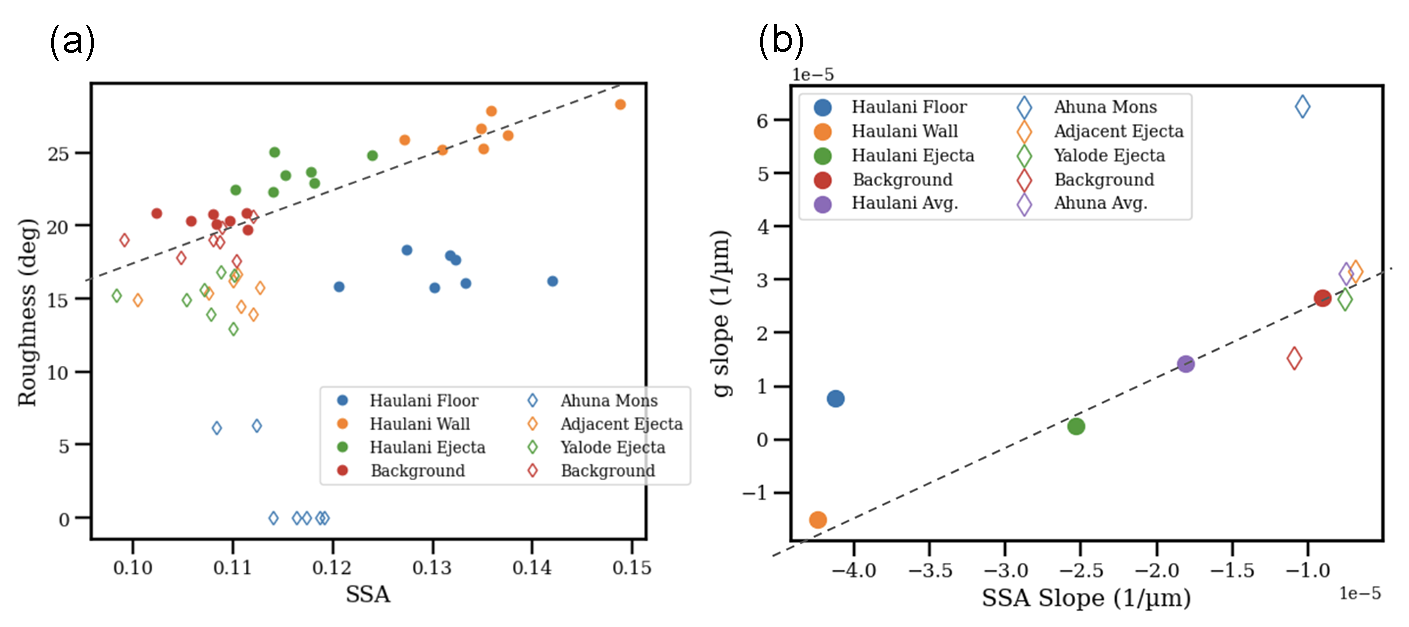
Conclusion and Discussion: Our results suggest that these ROIs likely form a trend, with the Haulani crater floor and Ahuna Mons as exceptions (Fig. 3). The apparent trendline of roughness vs. SSA is opposite of what was usually observed in asteroids caused by multiple scattering into shadows. What this trend means to Ceres’s regolith is still under investigation. On the other hand, the Haulani crater floor material is clearly below the trendline. Ahuna Mons is below the trendline, but the fitted 0º roughness is dubious. Fig. 3b shows that the trendline is primarily formed by the ROIs in the Haulani crater region. The points of the Ahuna Mons region ROIs cluster near the background. The Haulani crater floor and Ahuna Mons are clearly out of the trendline. Given the much younger geological age of the Haulani crater region of ~2 Ma [6] than that of the Ahuna Mons region (~200 Ma for Ahuna Mons [3], ~600 Ma for Yalode ejecta [13]), if the trendline represents an evolutionary sequence, then the corresponding timescale is around several Ma.

Figure 3. Roughness parameter vs. SSA for all ROIs at all bands (a) and the spectral slope of the g-parameter vs. that of the SSA (b). The dashed lines represent eye-balled trendlines.
We note that our results presented here are preliminary. The statistical significance of the trendline needs to be further accessed from the model uncertainties. But overall, such an evolutionary trend is in line with the previous results about the regolith evolution caused by the devolatilization of ice-rich materials near young craters [14, 15].
Acknowledgments: This research is supported by NASA Grant #80NSSC21K1017 and partially by the SSERVI16 Cooperative Agreement (#NNH16ZDA001N), SSERVI-TREX.
References: [1] Hendrix, A.R., et al., 2019, Astrobiology 19, 1; [2] De Sanctis, M.C., et al. 2020a, SSR 216, 60; [3] Ruesch, O., et al., 2016, Science 353, 1005; [4] Raponi, A., et al., 2019. Icarus 320, 83; [5] De Sanctis, M.C., et al. 2020b, Nature Astron. 4, 786; [6] Krohn, K., et al., 2018, Icarus 316, 84; [7] Schröder, S.E., et al., 2017, Icarus 288, 201; [8] Schröder, S.E., et al., 2013, Icarus 226, 1304; [9] Schröder, S.E., et al., 2014, Icarus 234, 99; [10] Roatsch et al. 2017, DAWN-A-FC2-5- CERESLAMODTMSPG-V1.0, NASA Planetary Data System; [11] Li, J.-Y., et al., 2019, Icarus 322, 144; [12] Helfenstein, P., Veverka, J., 1989, In: Asteroids II, 557; [13] Crown, D.A. et al. 2018, Icarus 316, 167; [14] Stephan, K., et al., 2017, GRL 44, 1660; [15] Schröder, S.E., et al., 2021, Nature Comm. 12, 274.
How to cite: Li, J.-Y., Zou, X.-D., Mest, S. C., Schröder, S. E., Mottola, S., and Kargel, J. S.: Spectrophotometric Properties of Geologically Young Regions on Ceres, Europlanet Science Congress 2022, Granada, Spain, 18–23 Sep 2022, EPSC2022-96, https://doi.org/10.5194/epsc2022-96, 2022.

