
 1,1,
1,1,- 1University of Leicester, Department of Physics and Astronomy, Leicester, United Kingdom of Great Britain – England, Scotland, Wales (ortk1@le.ac.uk)
- 2University of Oxford, Department of Physics, Clarendon Laboratory, Parks Road, Oxford, United Kingdom
Introduction: The Galilean satellites’ surfaces and subsurfaces will be explored by robotic spacecraft in the early 2030s, but significant advances from ground-based astronomical facilities will be possible in the coming decade. Ganymede’s surface is composed of regions of brighter young terrain with similar composition to Europa’s young surface, and older dark terrain that has a higher abundance of potentially silicate-rich material (Pappalardo et al., 2004). Infrared spectra from the Galileo orbiter Near-Infrared Mapping Spectrometer (NIMS) provided high-spatial-resolution IR spectra of Ganymede but with limited spatial coverage in many locations. In recent years, ground-based adaptive optics observations in the infrared with Keck/OSIRIS (Brown & Hand, 2013) and VLT/SINFONI (Ligier et al., 2019), along with orbital visible wavelength observations using HST (Trumbo et al. 2021) have provided new insights into the distributions of surface materials on the Galilean satellites.
Datasets: Near-IR observations with almost complete longitudinal coverage of Ganymede were taken with the ground-based VLT/SPHERE in 2015 and 2021, producing spectral cubes covering 0.95 to 1.65 μm (at R∼30) and dual band images at 2.11 and 2.25 μm. SPHERE has a high spatial resolution, with a pixel size of 7.46 mas/px, corresponding to ∼25 km/px at Jupiter. Accounting for diffraction, this allows features ∼150 km across to be easily resolved. Galileo/NIMS observations with similar spatial coverage have also been analysed to provide a direct comparison to the SPHERE dataset.
Visible wavelength observations of Ganymede with VLT/MUSE were acquired in 2019, covering the trailing and anti-jovian hemispheres. MUSE produces high spectral resolution spectra from 480 nm (R=1740) to 930 nm (R=3450). MUSE has a spatial sampling of 25 mas/px and a spatial resolution of ~80mas, corresponding to ~275 km on Ganymede’s surface.
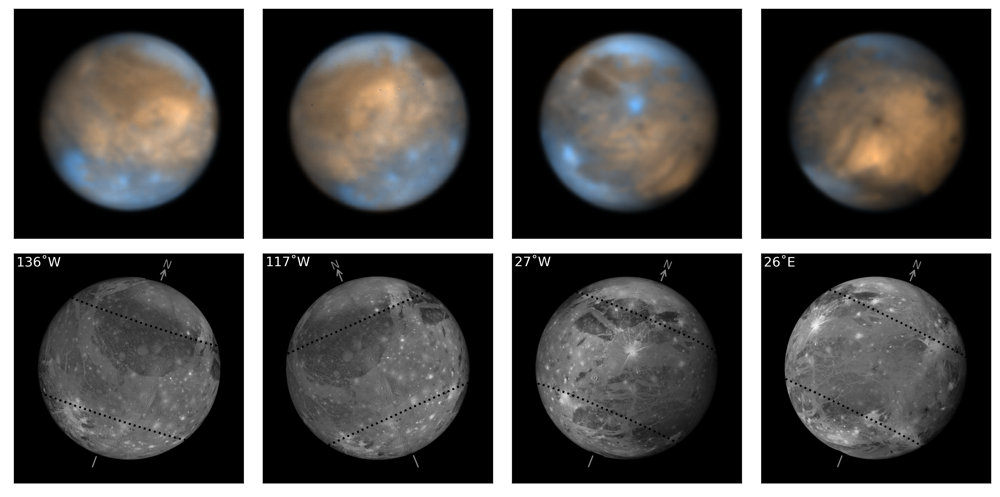
Figure 1: VLT/SPHERE dual band images of Ganymede (top) compared to simulated visible light images using the USGS reference basemap (bottom). The two colour images show the 2.11 µm filter in orange and the 2.251 µm filter in blue. Water ice has a broad absorption around 2 µm, so blue areas are icy and orange areas are contaminated. (King & Fletcher, in review)
MCMC spectral modelling: We analyse the mapped near-IR cubes from VLT/SPHERE by fitting to laboratory spectra from reference cryogenic libraries, including water ice, sulphuric acid, hydrated salts, and spectrally flat ‘synthetic’ spectra. Our fitting routine uses Markov Chain Monte Carlo (MCMC) techniques to model observed spectra, producing a posterior distribution of fitted abundance values for each endmember at each observed location (King et al., 2022). These posterior distributions can be sampled to calculate the best estimate abundance and its associated uncertainty for each endmember and class of endmembers, allowing more detailed investigation of the confidence of different detections.
Results: Spectral modelling results of the VLT/SPHERE observations confirm previous results, showing Ganymede’s surface consists of contrasting ancient dark terrain and young bright terrain (King & Fletcher, in review). The dark terrain (e.g. Galileo Regio) has high abundances of a spectrally flat darkening agent which appears to have a uniformly low albedo (~15%) across Ganymede’s surface. Water ice is most abundant in young bright terrain (e.g. sulci) and appears most abundant in large impact craters. The water ice grain size distribution shows strong latitudinal and longitudinal trends, which appear to be caused by thermal and radiation gradients respectively (see Figure 2). Lower abundances of hydrated salts and sulphuric acid were detected, with modelling uncertainties making it difficult to identify the exact mixture of salts present on Ganymede’s surface.
Absorption bands and spectral slopes were analysed in the visible wavelength VLT/MUSE spectra of Ganymede. One of the most distinguishing features of Ganymede’s visible spectrum is the molecular oxygen absorption at 577.3 nm (see Figure 3). The spatial distribution of this absorption band shows latitudinal and longitudinal trends, with the strongest absorptions found at low to mid latitudes on the trailing hemisphere in Ganymede’s closed magnetic field line region.
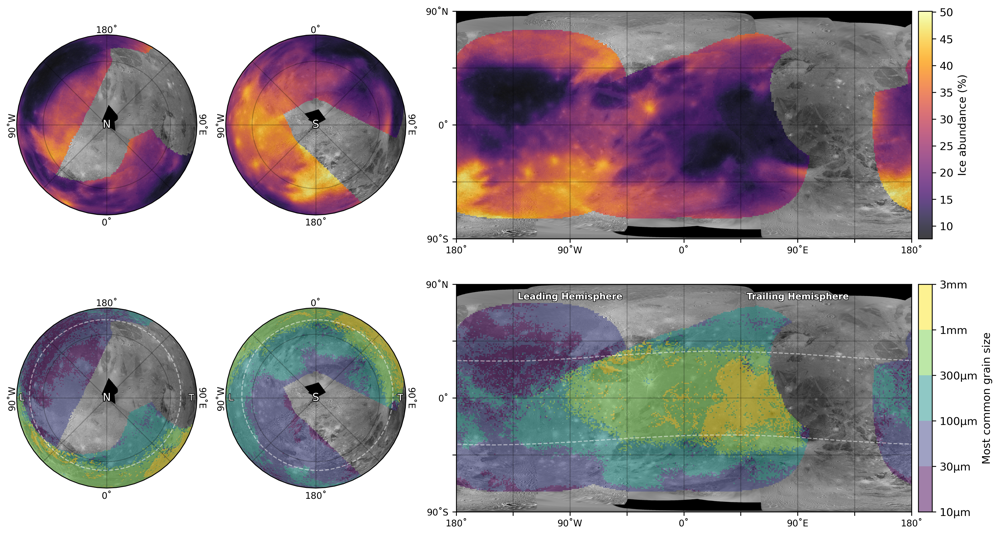
Figure 2: Modelled water ice best estimate spatial distributions using MCMC modelling of near-IR VLT/SPHERE observations. Total water ice abundance (top) is highest in young bright terrain, while the grain size (bottom) shows strong latitudinal and longitudinal trends. (King & Fletcher, in review)
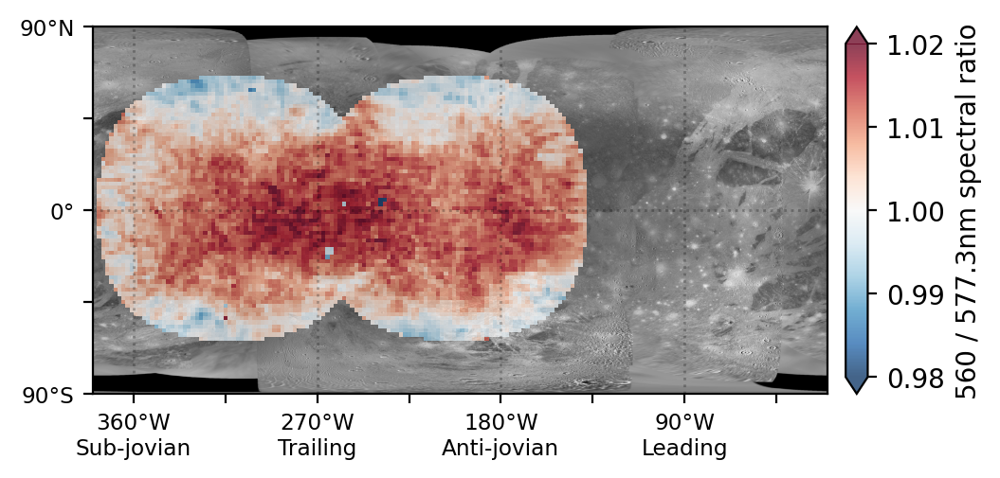
Figure 3: Molecular oxygen absorption on Ganymede, as measured by the 560 nm / 577.3 nm spectral ratio using the VLT/MUSE observations. Stronger O2 absorption (red) occurs at low to mid latitudes, mainly on the trailing hemisphere.
How to cite: King, O., Fletcher, L., Clarke, F., and Hidalgo, A.: Spectroscopy and compositional mapping of Ganymede with VLT, Europlanet Science Congress 2022, Granada, Spain, 18–23 Sep 2022, EPSC2022-987, https://doi.org/10.5194/epsc2022-987, 2022.