Europlanet Science Congress 2022
Palacio de Congresos de Granada, Spain
18 – 23 September 2022
Europlanet Science Congress 2022
Palacio de Congresos de Granada, Spain
18 September – 23 September 2022
OPS6
Aerosols and clouds in planetary atmospheres

OPS6

Aerosols and clouds in planetary atmospheres
Co-organized by TP/EXOA
Convener: Panayotis Lavvas | Co-conveners: Nathalie Carrasco, Anni Määttänen
Orals
| Thu, 22 Sep, 10:00–11:30 (CEST)|Room Andalucia 2
Posters
| Attendance Thu, 22 Sep, 18:45–20:15 (CEST) | Display Wed, 21 Sep, 14:00–Fri, 23 Sep, 16:00|Poster area Level 1

Session assets

Discussion on Slack

Orals: Thu, 22 Sep | Room Andalucia 2

10:00–10:15
|
EPSC2022-197
|
solicited
Patrick Irwin, Nicholas Teanby, Leigh Fletcher, Daniel Toledo, Glenn Orton, Michael Wong, Michael Roman, Santiago Pérez-Hoyos, Jose Franciso Sanz Raquena, Arjuna James, Charlotte Alexander, and Jack Dobinson

Many observations have been made in recent years of the visible/near-IR spectra of the Giant Planets: Jupiter, Saturn, Uranus and Neptune (Fig. 1).  Spectroscopic observations in reflected sunlight are complemented by studies of aerosol opacity at thermal wavelengths, from 5 µm into the mid- and far-infrared.  Observations in reflected sunlight can be inverted to infer vertical atmospheric structure using retrievals algorithms such as NEMESIS. In this paper, we will review recent observations and compare and contrast the aerosol structures derived to be present in these planetary atmospheres. Common themes that will be explored are:

  • Cloud condensation requires cloud condensation nuclei (CCN), small particles that can ‘seed’ the condensation process. Such materials are common in Earth’s atmosphere, blown up from the surface or ocean, but to understand formation in Ice Giant atmospheres, which have no surface, we are reliant on photochemistry in the upper atmosphere to photolyse gases such as ammonia and methane to generate hydrocarbon and nitrile hazes. This has a strong effect on where clouds/hazes can form.
  • These photochemically-produced hazes are significantly absorbing at some wavelengths, which affects the observed colours of these planets and also how the reflectance varies with solar and observing zenith angle, i.e., limb-darkening.
  • Moist convection on the giant planets is very different from that in the Earth’s atmosphere. Moist air in the Earth’s atmosphere is naturally buoyant since water vapour has a lower molecular weight than the surrounding N2/O2 air. On giant planets, however, moist air containing ammonia, water vapour or methane, has a significantly higher molecular weight than the surrounding H2/He air and hence tends to sink. Precipitation of condensed phases of ices, such as ammonia-water ‘mushballs’ on Jupiter, can be responsible for changing the vertical distributions of condensable species considerably, compared to equilibrium condensation models.
  • Regions of cloud condensation can lead to a significant decrease of mean molecular weight with height, leading to regions of significant static stability that may help suppress convection, and potentially separate atmospheric circulation into multiple stacked layers of differing properties.

While reviewing these recent measurement and retrieval studies we will also outline how degenerate the solutions are: since we have very little prior knowledge and limited data there are a wide range of solutions that can fit the observations equally well. Fortunately, we have found that the Minnaert limb-darkening model gives us a means of reducing this degeneracy and we shall show how this approach has greatly improved the robustness and reliability of our recent retrievals.

Figure 1. Visible appearance of the giant planets in our solar system: Jupiter (upper-left), Saturn (upper-right), Uranus (lower-left) and Neptune (lower-right)


How to cite: Irwin, P., Teanby, N., Fletcher, L., Toledo, D., Orton, G., Wong, M., Roman, M., Pérez-Hoyos, S., Sanz Raquena, J. F., James, A., Alexander, C., and Dobinson, J.: Aerosols in the atmospheres of the Giant Planets, Europlanet Science Congress 2022, Granada, Spain, 18–23 Sep 2022, EPSC2022-197, https://doi.org/10.5194/epsc2022-197, 2022.

10:15–10:25
|
EPSC2022-244
Regional mapping of aerosol population and surface albedo of Titan by the massive inversion of the Cassini/VIMS dataset
(withdrawn)
Rodriguez Sébastien, Es-sayeh Maël, Cornet Thomas, Maltagliati Luca, Appéré Thomas, Rannou Pascal, Coutelier Maélie, Le Mouélic Stéphane, Sotin Christophe, Barnes Jason W., and Brown Robert H.
10:25–10:40
|
EPSC2022-990
|
solicited
Jerome Lasne

The current context of space exploration missions is extremely favourable, especially regarding rocky planets. Several orbiters and rovers currently investigate the surface and atmosphere of Mars; more are planned in the future. Three Medium-class missions have been approved by NASA and ESA to study Venus in the coming years. Space telescopes, recently launched or scheduled, will be able to determine the composition of exoplanet atmospheres. Rocky (exo)planets are preferred targets, because they hold similarities with our own planet. Past and present signs of habitability are eagerly scrutinized, in the first place as atmospheric biomarkers.

Descriptions of planetary atmospheres based on gas-phase (homogeneous) chemistry are globally robust. Nonetheless, recent key detections remain hotly debated, in part because they remain unexplained by gas-phase chemistry alone. The most illustrative example of this is the controversial detection of methane on Mars. Recent work has shown that this apparent contradiction may be lifted by heterogeneous photo-induced reactions1.

Different types of aerosols exist in planetary atmospheres: dust, clouds, hazes,… They exist as liquids and solids, depending on the physical and chemical parameters (T, P, chemical composition) characterizing the atmosphere. Models of planetary atmospheres usually describe gas-phase reactions and photochemistry, but overlook heterogeneous reactions. Meanwhile, these interactions are key to account for crucial atmospheric processes; the most famous example of this is the “hole” in the stratospheric ozone layer of our planet.

In this talk, I will focus on heterogeneous processes on solid surfaces, and on their influence on the atmosphere of rocky bodies. Mineral dust and ice surfaces represent chemical factories for reactions to take place. Important heterogeneous reactions are known in the atmosphere of Earth, but heterogeneous chemistry is an (almost) virgin field when it goes to other planets. This talk will be an opportunity to discuss the current knowledge on atmospheric heterogeneous processes, which will be illustrated with recent examples. The need for dedicated experimental setups to study heterogeneous reactions under conditions of relevance for planetary atmospheres will be stressed, and perspectives for the study of exoplanets will be drawn2.


1 Zhang, X. et al., Icarus 376, Article number 114832 (2022)

2 Lasne, J. ACS Earth Space Chem. 5, 149 (2021)

How to cite: Lasne, J.: Heterogeneous Reactivity in the Atmosphere of Rocky Planets, Europlanet Science Congress 2022, Granada, Spain, 18–23 Sep 2022, EPSC2022-990, https://doi.org/10.5194/epsc2022-990, 2022.

10:40–10:50
|
EPSC2022-448
|
ECP
Zoé Perrin, Nathalie Carrasco, Nathalie Ruscassier, Julien Maillard, Isabelle Schmitz Afonso, Thomas Drant, Ludovic Vettier, and Guy Cernogora

1 - Introduction

In the atmosphere of the satellite Titan, the photochemistry of its two main components N2 and CH4 leads to the formation of complex organic molecules, up to the production of solid aerosols, in the form of an orange haze. Observations from the Cassini-Huygens mission [1], as well as models [2] and laboratory experiments [3], strongly suspect that once formed in the ionosphere, the haze will reside for some time in Titan's atmosphere until settling on the surface. Our aim is to investigate experimentally the interaction of the haze particles with their atmospheric chemical environment, focusing on possible reactive molecules produced by gas phase photochemistry of N2 and CH4 such as HCN, HC3N, C2N2, C2H2, C2H6. We more specifically addressed the absorption processes of the gases on the particle (uptake coefficients).


2 - Experimental method

In this experimental study, a dusty plasma reactor is used to simulate the atmospheric chemistry of Titan [3], as well as the synthesis of Titan’s aerosols analogues (tholins). The gaseous precursors formed by electronic dissociation were monitored in-situ by mass spectrometry, simultaneously with the formation and growth of the haze particles. The properties of the tholins are analyzed by scanning electron microscopy (morphology and size) and high resolution mass spectrometry, LDI-FTICR (chemical composition). In this study, the injection gas flow rate was optimized in order to increase as much as possible the residence time of the gas mixture in the reactor. The chemical growth of the solid particles is thus favored, allowing to follow simultaneously the formation and the evolution of the particles, as well as the co-evolution of the composition of the gas mixture until reaching a stationary gas chemistry, which will not change any more during the whole experiment.

3- Results

3.1 - Temporal evolution of the gas phase by mass spectrometry

In a previous study [4], MID monitoring by mass spectrometry was performed for CH4 and HCN (Figure 1).  From these results, we distinguish two kinetic regimes of gas-particle interaction: a transient regime corresponding to the production and consumption of gases and correlated to the evolution of tholins solid particles, and a stationary regime where the gas mixture ratio is stabilized. In this study, the MID monitoring is carried out for gas-phase molecules suspected to participate to the tholins chemical growth (so called “precursors”) : C2H2, C2H6, HC3N, C2N2.

Figure 1 - Time evolution of the masses m/z 16 (CH4), 27 (HCN), obtained with a mass spectrometer [4].


3.2 - Microphysical evolution by scanning electron microscopy

The samples were observed by scanning electron microscopy. The images show two growth phases, each corresponding to a gas-particle kinetic regime distinguished by the MID monitoring. Tholins during the transient regime exhibit nanoscale spherical monomers, not exceeding ~200 nm in diameter (Figure 2.A). Tholins formed in the stationary regime show an evolution of spherical monomers up to diameters of a few µm, and the formation of aggregates (Figure 2.B et 2.C).

Figure 2- Morphologies of Titan's tholins obtained with SEM. Figure 2.A : Tholins formed during the transient regime have an average diameter of 200 nm. Figure 2.B : Evolution of spherical nanometric to micrometric particles. Figure 2.C : Tholins formed during the strationnary regime, have an average diameter of a few µm.


3.3 - Kinetic modeling of the gas-particle interaction

 Based on a kinetic model performed by Pöschl et al. in 2007 [5], the two kinetic regimes observed in the experiment are fitted. From it, the absorption coefficient γ (uptake coefficient) of Titan tholins was deduced for each monitored precursor.. For each regime, an absorption coefficient γ is calculated taking into account the different interactions between gas-surface of the particles, as well as between surface-bulk of the particles, i.e. adsorption, desorption and diffusion effects.


[1] : Israël G. et al., Nature 438 : 796-99 (2005).

[2] : Lavvas P. et al., The Astrophysical Journal (2011).

[3] : Szopa C. et al., Planetary and Space Science 54 (2006).

[4] : Perrin et al.  Processes, MDPI (2021)

[5] : Pöschl U. et al., Atmospheric Chemistry and Physics 7 (2007)


How to cite: Perrin, Z., Carrasco, N., Ruscassier, N., Maillard, J., Schmitz Afonso, I., Drant, T., Vettier, L., and Cernogora, G.: Heterogeneous chemistry on Titan : Evolution of Titan’s tholins through time with gas phase chemistry, Europlanet Science Congress 2022, Granada, Spain, 18–23 Sep 2022, EPSC2022-448, https://doi.org/10.5194/epsc2022-448, 2022.

10:50–11:00
|
EPSC2022-246
|
ECP
Julia Shouse, Thibault Launois, Naïla Chaouche, Cédric Wolters, Philippe Boduch, Eric Quirico, Fabien Stalport, Laurène Flandinet, François-Régis Orthous-Daunay, Hervé Cottin, and Véronique Vuitton
  • Introduction

The Saturn system has been explored for 13 years (2004-2017) by the Cassini-Huygens mission that revealed the extraordinary chemical diversity of Titan and Enceladus. In particular, O+ ions (1 - 100 keV), originating from Enceladus' geysers, precipitate in Titan's upper atmosphere where molecules reaching mass-on-charge (m/z) of several thousand atomic mass units have been detected. These aerosol embryos have been attributed to polycyclic aromatic (nitrogen bearing) hydrocarbons (PANHs) that most likely result from the ionization and dissociation of the major atmospheric compounds, N2 and CH4 by solar photons [Hörst, 2017]. It is to be expected that the small fraction of energetic O+ ions, implanting themselves in organic aerosols, would modify their optical properties and chemical composition. If complex oxygenated molecules are formed, the aerosols, by sedimenting towards the surface, can then provide it with prebiotic material, adding a dimension with strong exobiological implications to the carbon / nitrogen / hydrogen chemistry endogenous to Titan [Hörst et al., 2012]. The objective of this project is thus to study the impact of oxygen ions from 1 to 100 keV on Titan aerosol analogues (tholins) and model materials by characterizing their effect on the chemical, structural and optical properties of the targets.

  • Experimental Methodology

Preliminary experiments were performed with adenine samples. Adenine was chosen because (i) it is a PANH, (ii) it has been identified in Titan’s tholins [Hörst et al. 2012; Sebree et al., 2018], (iii) there is some existing literature on its irradiation by UV photons and ions over a wide energy range showing that it does form a solid residue probably of macromolecular nature [Gerakines et al. 2012; Vignoli Muniz et al. 2017; Poch et al. 2014], (iv) some protocols to deposit it as a thin film on windows were available at LISA [Poch et al. 2014; Saïagh et al. 2014]. The samples consist of a thin (150 – 500 nm) adenine deposit on a MgF2 or ZnSe window. 8 samples were irradiated in the IGLIAS set-up at the ARIBE beam line at GANIL (Caen, France) with 35 or 70 keV 17O4+, 18O5+, or 20Ne3,4+ at a total fluence ranging from 9x10¹⁴ to 5x10¹⁵ ions cm-2. Samples were kept at 300 or 150 K and under ultra-high vacuum. Using the Stopping and Ranges of Ions in Matter (SRIM) software, we calculated that ions stop at a depth of 100 and 200 nm, for 35 and 70 keV incident ions, respectively, ensuring that they are implanted well within the sample. IR absorption spectra were obtained in situ during the irradiation with a Brüker V70 FTIR spectrometer.

  • Results and Conclusions

During energetic ion irradiation of the adenine films, their overall IR absorption intensity decreases (Fig. 1). The adenine molecule disappearance is caused by both destruction and sputtering. The projected stopping range being lower than the sample thickness, a part of the sample is not irradiated and the evolution of a given peak area A as a function of the ion fluence F can be written as

A(F) = a*exp(-bF)+Y*F+c,

where a is the initial absorption of the peak area, b is the destruction cross section, Y characterizes the sputtering yield and c gives the number of molecules in the non-irradiated layer at the end of the experiment.

Figure 1: Infrared absorption spectra of adenine at 300 K under irradiation of 35 keV 18O5+ at different fluences.

Table 1 displays the destruction cross section and sputtering yield (v7, 1609 cm-1) for different projectiles and temperatures. Our destruction cross sections are similar to that obtained for 1 keV and 0.8 MeV H+ [Gerakines et al. 2012; Vignoli Muniz et al. 2017]. The sputtering yield often has a large error but a rough approximation is that 15% to 35% of the sample is sputtered away. Further experiments with in situ mass spectrometry measurements of the gas phase could determine whether the sputtered material is intact adenine or some other molecules.  Samples irradiated at 150 K have the largest destruction cross section and sputtering yield. This behavior has also been observed in previous experiments performed in the MeV range where the decay rate increased with decreasing temperature [Gerakines et al. 2012; Vignoli Muniz et al. 2017].

Projectile

T

b

Y

35 keV 18O5+

300

(1.71±0.08)e-15

6±1

35 keV 18O5+

150

(3.6±0.9)e-15

11±26

35 keV 20Ne3+

300

(2.5±0.1)e-15

13±1

Table 1: Destruction cross section (cm2) and sputtering yield (molecules/ion) for different projectiles and temperatures (K).

Beyond adenine destruction, a new broad IR absorption band clearly arises between 2050 and 2250 cm-1 that may be attributed to nitriles or isonitriles. However, we could not find any evidence for absorption bands from oxygen-bearing molecules. More sensitive ex situ analysis of the irradiated samples by mass spectrometry are ongoing to characterize the macromolecular residue.

Acknowledgements

We thank the Programme National de Planétologie (PNP) for supporting this work.

References

Gerakines, P.A. et al. « In situ measurements of the radiation stability of amino acids at 15–140 K ». Icarus 220, 647 (2012).

Hörst, S. M. et al. Formation of amino acids and nucleotide bases in a Titan atmosphere simulation experiment ». Astrobiology 12, 809 (2012).

Hörst, S. M. « Titan’s atmosphere and climate ». J. Geophys. Res. Planets 122 (2017): doi:10.1002/2016JE005240.

Poch, O. « Laboratory insights into the chemical and kinetic evolution of several organic molecules under simulated Mars surface UV radiation conditions ». Icarus 242, 50 (2014).

Saïagh, K. « VUV and mid-UV photoabsorption cross sections of thin films of adenine: Application on its photochemistry in the solar system ». Planet. Space Sci. 90, 90 (2014).

Sebree, J. A. et al. « Detection of prebiotic molecules in plasma and photochemical aerosol analogs using GC/MS/MS techniques ». ApJ 865, 133 (2018).

Vignoli Muniz, G. S. et al. « Radioresistance of adenine to cosmic rays ». Astrobiology 17, 298 (2017).

How to cite: Shouse, J., Launois, T., Chaouche, N., Wolters, C., Boduch, P., Quirico, E., Stalport, F., Flandinet, L., Orthous-Daunay, F.-R., Cottin, H., and Vuitton, V.: Exploring in the Laboratory the Impact of Low Energy Oxygen Ions on Titan’s Aerosols, Europlanet Science Congress 2022, Granada, Spain, 18–23 Sep 2022, EPSC2022-246, https://doi.org/10.5194/epsc2022-246, 2022.

11:00–11:10
|
EPSC2022-665
|
ECP
zachary flimon, justin erwin, Ann Carine vandaele, lori Neary, arianna piccialli, loic trompet, yannick willame, sophie bauduin, frank daerden, ian thomas, bojan ristic, jon mason, cedric depiesse, manish patel, giancarlo bellucci, and jose juan lopez moreno

Dust climatology from NOMAD UVIS channel

  • Flimon1, J. Erwin1, A.C. Vandaele1, L. Neary1, A. Piccialli1, L. Trompet1,Y. Willame1, F. Daerden1, S. Bauduin2, I. R. Thomas1, B. Ristic1, J. Mason3, C. Depiesse1, M. R. Patel3, G. Bellucci4, J.-J. Lopez-Moreno5

1 Royal Belgian Institute for Space Aeronomy, BIRA-IASB

2 Université libre de Bruxelles (ULB), Spectroscopy, Quantum Chemistry and Atmospheric Remote Sensing (SQUARES), Brussels, Belgium

3 School of Physical Sciences, The Open University, Milton Keynes, UK

4 Instituto de Astrofisica e Planetologia Spaziali, INAF, Rome, Italy

5 Instituto de Astrofìsica de Andalucía, Consejo Superior de Investigaciones Científicas (CSIC), Granada, Spain

Introduction: 

Aerosols present in the atmosphere of Mars have a major effect on it. They are mainly composed of dust, water ice or CO2 ice. Dust is confined to lower altitudes during the aphelion season and can reach higher altitudes during the perihelion, especially during dust storms that frequently arise on Mars. These storms can sometime grow up to cover the entire planet and are then called a global dust storm.

The NOMAD (“Nadir and Occultation for MArs Discovery”) spectrometer suite on board the ExoMars Trace Gas Orbiter (TGO) is composed of three spectrometers, two in IR (LNO and SO) and one in UV-visible (UVIS). The UVIS channel spectral range extends from 200nm to 650nm with a spectral resolution about 1.5nm. UVIS can operate in nadir and occultation modes. In this work, we use observations taken in occultation mode to investigate the vertical distribution of aerosols.

Method:

To compute aerosol’s extinction, from the transmittances of UVIS. We use first the ASIMUT code (Vandaele, et al., 2006.) to make a fit on ozone and Rayleigh scattering and then subtract them from the original transmittances. In the result should remain only the background of the spectra. Extinction can be computed from the transmittance after subtraction of ASIMUT’s fit using the formula from (Wilquet et al., 2012): ) and (. With τ the optical depth , T the transmittance, I the solar irradiance attenuated through the atmosphere and I0 the reference irradiance of the solar spectrum outside the atmopshere. β represents the extinction and N the number of layer above the current layer n. λ represents the wavelength and dZ represents the pathlength of light through the atmosphere to the point and i represent the upper layer.

The extinction is fitted using the refractive index for Mars dust from (Wolff et al., 2009). The extinction efficiency, Qext is computed using a Mie code (Bohren, et al., 1998) with a log normal size distribution. Given the Qext for each size distribution, the number density ”n” is fitted using the relation β = n * Qext, with β the extinction derived from the UVIS spectra. The fit is made for each effective radius and each standard deviation. The best fit finally selected will be the one with the smallest reduced chi square. The number density error is calcultated based on the extinction error with a Monte Carlo algorithm.

Results:

Using only the spectral range of UVIS, the dust, water ice and CO2 ice cannot be differentiated because the three aerosols have similar spectral features in the UV-visible. Therefore, only dust will be assumed in this work. Detection of CO2 and water ice will be investigated in a future work. Dust in the Martian atmosphere is sensitive to seasonal variations. During perihelion (LS 250), the atmosphere of Mars becomes warmer, and dust can be transported to higher altitudes. In the contrary, at the aphelion (LS 70) dust remains confined at lower altitudes.


Figure 4: Dust vertical extinction profiles versus solar longitude for Mars year 34 to 36

We can see on Figure 4 that at the perihelion dust is present at higher altitudes and the extinction is stronger than during the aphelion. In this work we will further compare the vertical distribution of dust for Mars year 34 (with global dust storm) and Mars year 35 (without global dust strom), as well as latitudinal variations.

Acknowledgements:

The NOMAD experiment is led by the Royal Belgian Institute for Space Aeronomy (IASB-BIRA), assisted by Co-PI teams from Spain (IAA-CSIC), Italy (INAF-IAPS), and the United Kingdom (Open University). This project acknowledges funding by the Belgian Science Policy Office (BELSPO), with the financial and contractual coordination by the ESA Prodex Office (PEA 4000103401, 4000121493), by Spanish Ministry of Science and Innovation (MCIU) and by European funds under grants PGC2018-101836-B-I00 and ESP2017-87143-R (MINECO/FEDER), as well as by UK Space Agency through grants ST/V002295/1, ST/V005332/1 and ST/S00145X/1 and Italian Space Agency through grant 2018-2-HH.0. This work was supported by the Belgian Fonds de la Recherche Scientifique – FNRS under grant number 30442502 (ET_HOME). The IAA/CSIC team acknowledges financial support from the State Agency for Research of the Spanish MCIU through the ‘Center of Excellence Severo Ochoa’ award for the Instituto de Astrofísica de Andalucía (SEV-2017-0709). US investigators were supported by the National Aeronautics and Space Administration. Canadian investigators were supported by the Canadian Space Agency. This project has received funding from the European Union’s Horizon 2020 research and innovation programme under grant agreement No 101004052.

References:

Bohren, Craig F. and Donald R. Huffman,Absorption and scattering of light by small particles, New York : Wiley, 1998, 530 p., ISBN 0-471-29340-7, ISBN 978-0-471-29340-8 (second edition)

Vandaele, A.C., Kruglanski, M., Mazière, M.D., n.d. MODELING AND RETRIEVAL OF ATMOSPHERIC SPECTRA USING ASIMUT 6.

Wilquet, V., Drummond, R., Mahieux, A., Robert, S., Vandaele, A.C., Bertaux, J.-L., 2012. Optical extinction due to aerosols in the upper haze of Venus: Four years of SOIR/VEX observations from 2006 to 2010. Icarus 217, 875–881. https://doi.org/10.1016/j.icarus.2011.11.002

Wolff, M.J., Smith, M.D., Clancy, R.T., Arvidson, R., Seelos, F., Murchie, S., Savijärvi, H., 2009. Wavelength dependence of dust aerosol single scattering albedo as observed by the Compact Reconnaissance Imaging Spectrometer. J. Geophys. Res. 114, E00D04. https://doi.org/10.1029/2009JE003350


How to cite: flimon, Z., erwin, J., vandaele, A. C., Neary, L., piccialli, A., trompet, L., willame, Y., bauduin, S., daerden, F., thomas, I., ristic, B., mason, J., depiesse, C., patel, M., bellucci, G., and lopez moreno, J. J.: Dust climatology from NOMAD UVIS channel, Europlanet Science Congress 2022, Granada, Spain, 18–23 Sep 2022, EPSC2022-665, https://doi.org/10.5194/epsc2022-665, 2022.

11:10–11:20
|
EPSC2022-1087
|
ECP
Sushuang Ma, Quentin Changeat, Ahmed Al-Refaie, Yuichi Ito, and Giovanna Tinetti

Transit spectroscopy is an effective method for the atmospheric study of exoplanets. However, clouds impose uncertainties in constraining the atmospheric parameters. The current exoplanetary study is awaiting improvement in analysing clouds in transit spectra with the retrieval technique and within reasonable computational time. Therefore, we developed YunMa, an optimised cloud microphysics model for transit spectroscopy. We took advantage of TauREx 3 (Al-Refaie et al. 2019, 2021), an open code framework for simulating exoplanetary spectra to enable the retrieval function of YunMa. We validated our model by comparing our simulation with previous literature results. We evaluated the retrieval performances on a synthetic temperate sub-Neptune. We, therefore, concluded that this work did the first transit spectral retrieval with parametric cloud microphysics included and proposed feasible applications with YunMa.

How to cite: Ma, S., Changeat, Q., Al-Refaie, A., Ito, Y., and Tinetti, G.: Exoplanetary cloud retrieval using YunMa in transit spectroscopy, Europlanet Science Congress 2022, Granada, Spain, 18–23 Sep 2022, EPSC2022-1087, https://doi.org/10.5194/epsc2022-1087, 2022.

11:20–11:30
|
EPSC2022-328
|
ECP
Anthony Arfaux and Panayotis Lavvas

The complexity of the phenomena taking place in exoplanet atmospheres is challenging to simulate and choices have to be done to simplify the problem. The choice of using a one dimensional atmospheric model is potentially the most resource-saving one, though when considering effects of transport, a new caveat appear: how to account for such 3D-related processes in 1D ? The answer is: considering all these complex phenomena as a single diffusion process called eddy diffusion (Colegrove et al., 1965; Smith, 1998; Moses et al., 2011; Lavvas & Koskinen, 2017). This is a long known simplification, yet no complete theoretical frameworks exist to accurately assess this parameter and most 1D models assume either a constant eddy diffusion coefficient treated as a fitting parameter (Spiegel et al., 2009), or a profile derived from 3D general circulation models (Parmentier et al., 2013; Zhang & Showman, 2018). Unfortunately, all planets haven’t been studied with such a model and therefore, no accurate eddy profile derived from GCMs can be found for these planets. Moreover, the different ways to derive the eddy via 3D model provide very different results. In this work, we aim to develop a parametrization suitable for gas giant exoplanets and to assess the eddy profile obtained for ten hot-Jupiters.

We developed an eddy profile parametrization based on parameters available in 1D calculations. The parameterization separates the atmosphere in three parts: a convection-driven mixing below the radiative-convective boundary (Ackerman & Marley, 2001), a middle atmosphere eddy diffusion increasing with decreasing density in a √1 behavior (Chamberlain, 1978), and an upper atmosphere above the homopause where we consider a constant eddy diffusion coefficient scaled on Jupiter’s homopause eddy mixing (Koskinen et al., 2010).


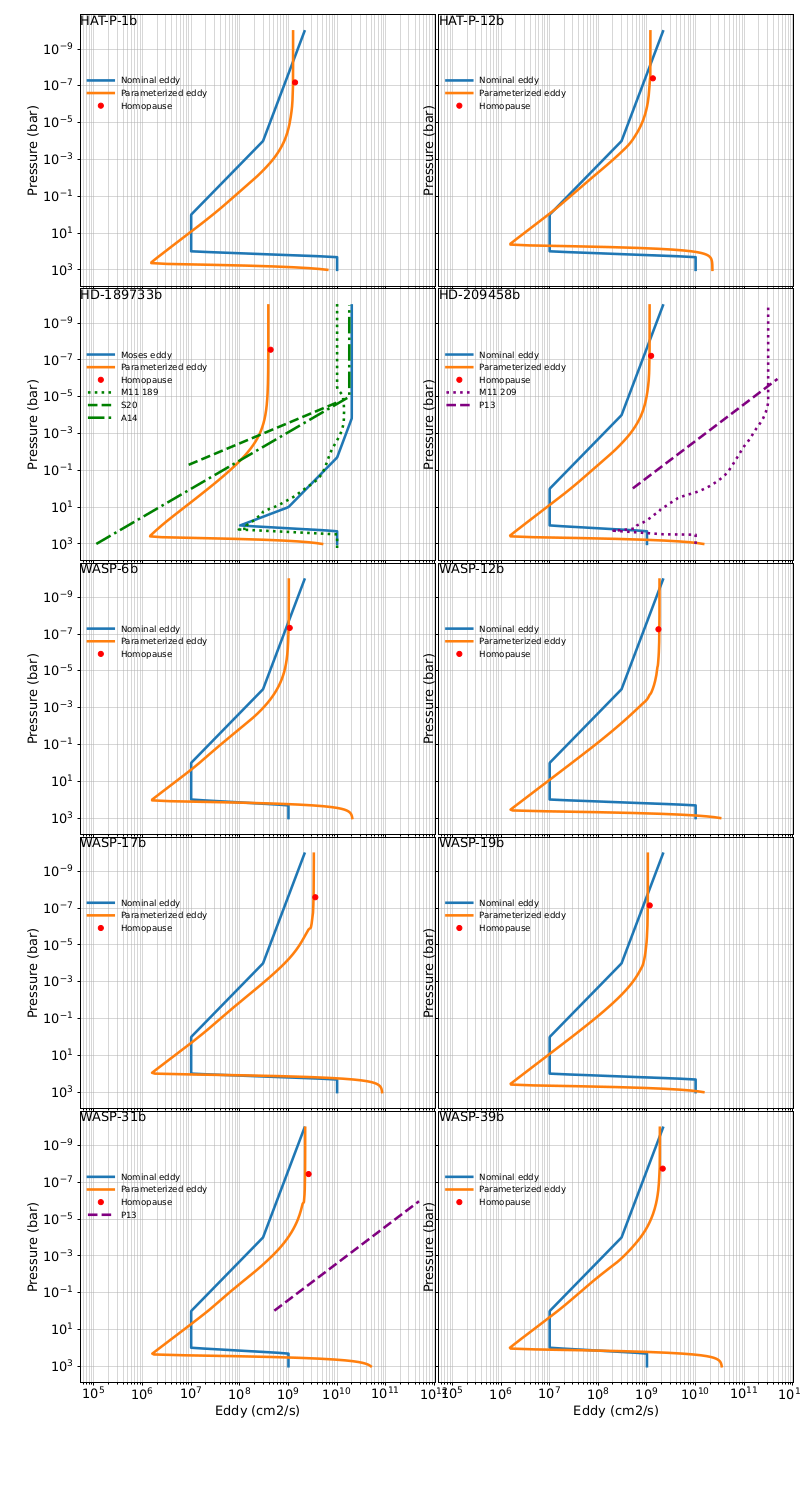
Figure 1: Nominal and parametrized eddy profiles. When available, additional GCM results are shown (M11 for Moses et al. (2011), S20 for Steinrueck et al. (2020), A14 for Agùndez et al. (2014), P13 for Parmentier et al. (2013)).


The eddy profile affects the transport and then the distribution of chemical species and hazes in the atmosphere, thus resulting in modifications of the transit spectra. Therefore, in the purpose of testing this parameterization, we use a self-consistent 1D model that couples haze microphysics (Lavvas & Koskinen, 2017), disequilibrium chemistry (Lavvas et al., 2014) and radiative transfer (Lavvas & Arfaux, 2021). We conducted two sets of calculations: the first with a nominal eddy profile based on the profile derived by Moses et al. (2011) for HD-189733b and downscaled following Parmentier et al. (2013) results, and the second with our parametrization (Fig. 1). The modification of the eddy can bring important modifications of the haze particle distribution with a stronger mixing leading to a decrease of the transport timescale. This produces smaller and more numerous particles as they have less time to coagulate. The changes in the haze particle distribution are impacting the transit spectra. While the spectra of haze-free atmospheres present weak variations from the nominal eddy case, the smaller particles obtained for hazy planets result in a significant decrease of the transit depth (Fig. 2). These planets would therefore require more haze to fit the HST observations. This result is consistent with the larger haze precursors mass fluxes we obtain. Indeed, modifying the eddy leads to important modifications of the chemical composition profiles, notably the haze precursors. The stronger upper atmosphere (usually in the region up to ∼0.01 μbar altitude as shown in Fig. 1) eddy mixing produced by our parametrization enhances HCN and CO abundances, which are considered to be the major contributors to the formation of photochemical hazes. This increases the production of hazes with precursors photolysis mass fluxes multiplied by 5 on average compared to the nominal eddy case.


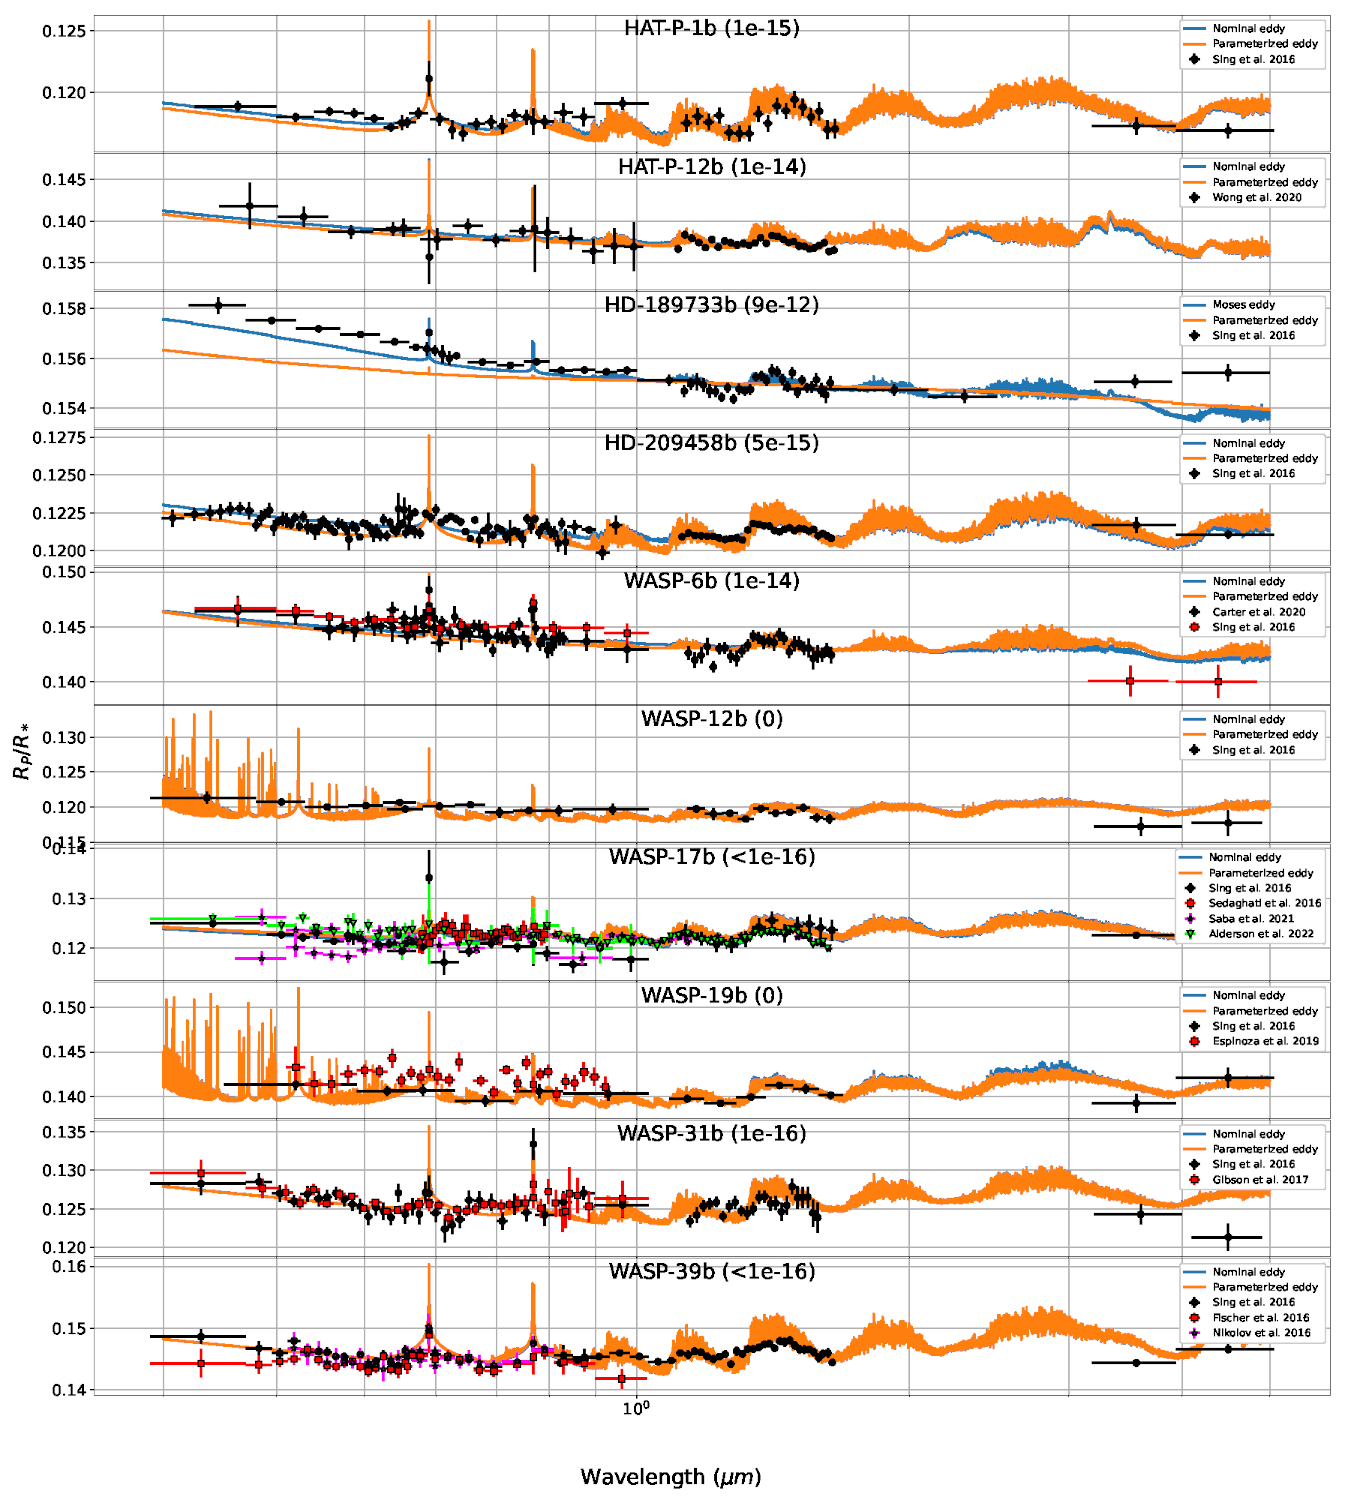
Figure 2: Transit spectra obtained with the nominal and parametrized eddy profiles. The values in parentheses are the mass fluxes assumed for the haze formation in g.cm−2.s−1.


In conclusion, our parameterization produces in most cases eddy profiles rather close to the nominally used, mainly slightly larger in the upper atmosphere. These new eddy profiles require some slight adjustment of the haze mass flux to fit the observations compared to the mass fluxes derived using the nominal eddy profile. We however note the particular case of HD-189733b (Fig. 1). This planet indeed requires a particular care due to its challenging UV-visible observations (Fig. 2) that imply haze mass flux and eddy diffusion significantly larger than for the other planets.


References


Ackerman, A. S., & Marley, M. S. (2001). The Astrophysical Journal, 556(2), 872–884.

Agùndez, M., Parmentier, V., Venot, O., Hersant, F., & Selsis, F. (2014). Astronomy and Astrophysics, 564, A73.

Chamberlain, J. W. (1978).

Colegrove, F. D., Hanson, W. B., & Johnson, F. S. (1965). Journal of Geophysical Research, 70(19), 4931–4941.

Koskinen, T. T., Cho, J. Y.-K., Achilleos, N., & Aylward, A. D. (2010). The Astrophysical Journal, 722(1), 178–187.

Lavvas, P., & Arfaux, A. (2021). Monthly Notices of the Royal Astronomical Society, 502(4), 5643–5657.

Lavvas, P., & Koskinen, T. (2017). The Astronomical Journal, 847.

Lavvas, P., Koskinen, T., & Yelle, R. V. (2014). arXiv e-prints, (p. arXiv:1410.8102).

Moses, J. I., Visscher, J. J., C.; Fortney, Showman, A. P., Lewis, N. K., Griffith, C. A., Klippenstein, S. J., Shabram, M., Friedson, A. J., Marley, M. S., & Freedman, R. S. (2011). The Astrophysical Journal, 737(1).

Parmentier, V., Showman, A. P., & Lian, Y. (2013). Astronomie and Astrophysics, 558, A91.

Smith, e. a., M. D. (1998).

Spiegel, D. S., Silverio, K., & Burrows, A. (2009). The Astrophysical Journal, 699(2), 1487–1500.

Steinrueck, M. E., Showman, A. P., Lavvas, P., Koskinen, T., Tan, X., & Zhang, X. (2020). arXiv e-prints, (p. arXiv:2011.14022).

Zhang, X., & Showman, A. P. (2018). The Astrophysical Journal, 866(1), 1.

How to cite: Arfaux, A. and Lavvas, P.: Sensitivity of hot-Jupiter haze retrieval on eddy parameterization, Europlanet Science Congress 2022, Granada, Spain, 18–23 Sep 2022, EPSC2022-328, https://doi.org/10.5194/epsc2022-328, 2022.

Display time: Wed, 21 Sep 14:00–Fri, 23 Sep 16:00

Posters: Thu, 22 Sep, 18:45–20:15 | Poster area Level 1

L1.109
|
EPSC2022-886
|
ECP
Lukáš Petera and Antonín Knížek
Asteroids and comets are often rich in polyaromatic hydrocarbons (PAHs), which represent in general about 30 % of total carbon in space. The fate of these molecules in extraterrestrial delivery was investigated by experimentally simulating asteroid impacts – using laser induced breakdown (LIBD) – into rocky planetary atmospheres and surfaces. Experiments were performed with benzene, naphtalene and anthracene as simple members of PAHs. The effect of LIBD on chemistry of these compounds in various chemical environments, such as atmospheric composition and solid phase matrices, were also studied. The main gas phase products are acetylene and HCN, followed by CO and CO2, whose yields mainly depend on the content of water vapour in the atmosphere. A brownish solid product was also observed. Therefore, simple aromatic compounds, and likely also PAHs, can be a viable source of HCN – molecule with significant prebiotic importance– in planetary environments.
 

How to cite: Petera, L. and Knížek, A.: Impact-induced transformation of simple aromatic compounds in planetary atmospheres, Europlanet Science Congress 2022, Granada, Spain, 18–23 Sep 2022, EPSC2022-886, https://doi.org/10.5194/epsc2022-886, 2022.

L1.110
|
EPSC2022-354
Pedro Machado, Miguel Silva, Agustin Sánchez-Lavega, José Silva, Daniela Espadinha, Francisco Brasil, and José Ribeiro

Abstract

We present Doppler wind velocity final results of Saturn’s zonal flow at cloud level. Our aim is help to constrain the characterization of the equatorial jet at cloud level and the latitudinal variation of the zonal winds, to measure its spatial and temporal variability, to contribute to monitor the variability in order to achieve a better understanding of the dynamics of Saturn’s zonal winds (Sánchez-Lavega et al. 2003, 2007, 2016); Finally, the complementarity with Cassini, providing an independent set of observations.

Figure 1: (a) Raw echellogramme showing the spectral orders for one of the detectors. (b) Magnification of part of one order, where absorption lines (dark vertical bands) are visible. From each order, a stack of 61 spectra are extracted. (c) Set of 61 spectra, with each one corresponding to one pixel in the slit’s active window. (d) Each spectrum is divided into 16 orders in the MIT detector and 23 orders in the EEV detector. The plot shows an example of the 16 components of an MIT spectrum, each coming from one spectral order. (e) Example spectrum from one order and one location in the Venus disk. Machado et al. (2012).

The study of the planet’s global system of winds at the 0.7 bar region is based on high resolution spectra from the UV-Visual Echelle Spectrograph (UVES) instrument at ESO’s Very Large Telescope (VLT). Under the assumption of predominantly zonal flow, this method allows the simultaneous direct measurement of the zonal velocity across a range of latitudes and local times. The technique, based on long slit spectroscopy combined with the high spatial resolution provided by the VLT, has provided the first ground-based characterization of the latitudinal profile of zonal wind in the atmosphere of Saturn and the first zonal wind field map in the visible. It promises to improve the characterization of the equatorial jet and the latitudinal variation of the zonal winds, as well the measurement (and monitorization) of its spatial and temporal variability, achieving a better understanding of the dynamics of Saturn’s zonal winds (which Sánchez-Lavega have found to have changed in recent years). A complete characterization of the dynamical behaviour of Saturn atmosphere is crucial for understanding its driving mechanisms. Finally, the complementarity with Cassini, has provided an independent set of observations to compare with and help validate the method. The zonal wind profile retrieved is consistent with previous spacecraft measurements based on cloud tracking, but with non-negligible variability in local time (longitude) and in latitude.

Figure 2: Geometry of the slit positions at the observation days. Saturn’s diameter is 17.4", and the slit aperture is 0,3”x25” . The aperture offset between consecutive exposures is 1". The sub-terrestrial point is at -26.1ºS.

The UVES/VLT instrument has been used, which simultaneously achieves high spectral resolving power and high spatial resolution. The field has been derotated in order to have the aperture aligned perpendicularly to Saturn’s rotation axis. In this configuration, spatial information in the East-West direction is preserved in a set of spectra in the direction perpendicular to dispersion. Our Doppler velocimetry method is based on the technique of absolute accelerometry (Connes, 1985) which has been applied to the backscattered solar spectrum in order to determine the Doppler shift associated with the zonal circulation. Our measurements have been made in the wavelength range of 480-680 nm. Previously we successfully adapted and fine tuned this Doppler velocimetry technique for measuring winds at Venus cloud tops (Machado et al. 2012, 2014,2017, 2021; Gonçalves et al., 2020). In the present study we will show the adaptation of this method for Saturn’s case. We will use coordinated observations from the Cassini’s Visible and Infrared Mapping Spectrometer (VIMS), in order to compare with the Doppler winds obtained from the UVES/VLT high-resolution spectra.

The observations consisted of 4 blocks of 15 exposures of 90 sec, plus two shorter blocks of 9 exposures, totaling 7.3 hours of telescope time. In order to cover the whole disk the aperture has been offset by 1 arcsec in the North-South direction between consecutive exposures. Most of the northern hemisphere was covered by the rings. Saturn’s diameter was 17.4 arcsec, and the slit aperture was 0.3x25 arcsec. The aperture offset between consecutive exposures was 1 arcsec. Two shorter observations blocks of 9 exposures only covered the central part of the disk, and four others covered the whole disk. The sub-terrestrial point was at -26.1 S. The presence of the rings lead to severe order superposition. The dark region between the rings and the disk may or may not be present, depending on the slit position. On the other hand, defects in the response of the UVES slit in the upper part preclude its use for accurate Doppler measurements such as these. For these reasons only the central part of the aperture has been considered for the measurements.

It can be easily noticed that we were able to reproduce with a significant agreement the amplitudes of the wind velocities previously observed in a vast range of latitudes and that they are highly consistent with the cloud tracking measurements from almost simultaneous Cassini data.

Figure 3: Contour map of Saturn disk for the first night of observations. The wind velocities have units of m/s. Thecolor scale was arbitrary.

References
Connes, P., Absolute Astronomical Accelerometry, Astrophysics and Space Science (ISSN 0004-640X), volume 110, no. 2, p.211-255, 1985.
Goncalves, R., Machado, et al., Icarus, 335, article id. 113418, 2020.
Machado, P., Luz, D.Widemann, T., Lellouch, E.,Witasse, O, , Icarus, Volume 221, p. 248-261, 2012.
Machado, P., Widemann, T., Luz, D., Peralta, J., Icarus, 2014.
Machado, P., Widemann, T., Peralta, J., Gonçalves, R., Donati, J-F., Luz, D., Icarus, 285, 8-26, 2017
Machado, P., et al., Atmosphere, 12, 506, 2021.
Sánchez-Lavega, A., et al., Nature, 423, 623-625, 2003.
Sánchez-Lavega, A., Hueso, R.; Pérez-Hoyos, S., Icarus, 187, 510-519, 2007.
Sánchez-Lavega, A., et al., Nature Communications, 7, id. 13262, 2016.

How to cite: Machado, P., Silva, M., Sánchez-Lavega, A., Silva, J., Espadinha, D., Brasil, F., and Ribeiro, J.: Saturn atmosphere's winds with VLT/UVES Doppler velocimetry, Europlanet Science Congress 2022, Granada, Spain, 18–23 Sep 2022, EPSC2022-354, https://doi.org/10.5194/epsc2022-354, 2022.

L1.111
|
EPSC2022-765
Erika L. Barth

Titan’s atmosphere includes many trace hydrocarbon and nitrile species that reach their condensation temperatures in the stratosphere. These, for the most part, will condense out as ices given sufficient condensation nuclei, which are provided by the organic haze particles. Barth (2017) explored the physics behind the size and abundance of pure ice particles that could be present in Titan’s atmosphere and found they would condense out in layers between about 80 and 60 km given thermal conditions at the Huygens landing site (Fig. 1).

We now expand that study to multiple latitudes and include mixtures of trace species in the ice particles. Anderson et al. (2018) have shown that in Titan’s stratosphere, where many of the trace gases are saturated at the same altitude, they are likely co-condensing onto the haze particles. This changes the optical properties of the particles, but microphysically the formation process is similar to modeling the pure ices, as long as the vapor pressures are adjusted for the mixture.

Modeling is done using the Community and Aerosol Radiation Model for Atmospheres (CARMA; Barth 2020). CARMA models the physics of vertical transport and coagulation in a column of atmosphere and the interaction of particles and gases through nucleation, condensation, and evaporation. The growth routines have been modified to include particles composed of multiple volatiles, with each volatile component growing or evaporating in response to the environment (Barth & Toon, 2006). Particles are represented by a number of discrete mass bins, such that the size distribution of ice particles can be explored at all altitudes in the column. The model keeps track of the changes with time of the number of particles (including core mass for clouds) and mass density of volatiles.

This work is supported by NASA CDAP 80NSSC20K0485.

References: Anderson, C. M., R. E. Samuelson and D. Nna-Mvondo 2018. Organic ices in Titan’s stratosphere. Space Sci. Rev. 214, 125; Barth, E.L. 2020. PlanetCARMA: A New Framework for Studying Planetary Atmospheres. Atmosphere, 11(10), 1064; Barth, E. L. 2017. Modeling survey of ices in Titan’s stratosphere. Planet. Space Sci. 137, 20–31; Barth, E. L., and O. B. Toon 2006. Methane, ethane, and mixed clouds in Titan’s atmosphere: Properties derived from microphysical modeling. Icarus 182, 230–250.

How to cite: Barth, E. L.: Microphysical modeling of mixed composition ices in Titan’s stratosphere, Europlanet Science Congress 2022, Granada, Spain, 18–23 Sep 2022, EPSC2022-765, https://doi.org/10.5194/epsc2022-765, 2022.

L1.112
|
EPSC2022-1199
Ella Sciamma-O'Brien, Ted Roush, Pascal Rannou, and Farid Salama

We have determined the real and imaginary refractive indices (n and k, respectively), from the visible to the near infrared (0.4 to 1.6 µm), of five laboratory-generated organic refractory materials produced from gas-phase chemistry with the NASA Ames COSmIC facility. The solid samples were produced using a plasma discharge in the stream of a 200-K supersonic jet-cooled expansion of different gas mixtures to study the impact of the molecular precursors on the solid sample optical properties. Three samples were produced from N2:CH4 (95:5) gas mixtures using three different high voltages (700V, 800V and 1000V) to vary the energy in the plasma discharge. One sample was produced from a N2:CH4:C2H2 (94:5:5:0.5) gas mixture, with a high voltage of 1000 V. The fifth sample was produced in an Ar:CH4 (95:5) gas mixture with a high voltage of 1000 V to produce a nitrogen-free hydrocarbon sample. The optical constants, n and k, of these five samples were determined using spectral reflectance measurements. They appear to be positively correlated with the nitrogen content in the solid sample, i.e., a sample with larger nitrogen content exhibits higher n and k values.

We have used these refractive indices as input parameters in a radiative transfer model to analyze Cassini Visible Infrared Mapping Spectrometer (VIMS) observations of Titan’s atmosphere. The results show that using the tholin samples with higher n and k values (higher nitrogen content) provides a better fit to the observational data than using the samples with lower n and k values (lower nitrogen content). The Titan tholins with higher nitrogen content therefore appear to be more representative of the Titan aerosols observed by VIMS.

How to cite: Sciamma-O'Brien, E., Roush, T., Rannou, P., and Salama, F.: First Optical Constants from 0.4 to 1.6 µm of Titan Aerosol Analogs Produced in the NASA Ames COSmIC Facility and Their Use in a New Analysis of Cassini VIMS Observations, Europlanet Science Congress 2022, Granada, Spain, 18–23 Sep 2022, EPSC2022-1199, https://doi.org/10.5194/epsc2022-1199, 2022.

L1.113
|
EPSC2022-1143
|
ECP
Modelling Neptune’s storms as a proxy for detecting atmospheric variability in directly imaged cold exoplanets
(withdrawn)
Óscar Carrión-González, Santiago Pérez-Hoyos, Antonio García Muñoz, Ricardo Hueso, Patrick G. J. Irwin, Iñaki Ordóñez-Etxeberria, Agustín Sánchez-Lavega, and Michael H. Wong