
 1,2,3,2
- 1Free University Berlin, Geosciences, Berlin, Germany (nils.mueller@dlr.de)
- 2Insitute of Planetary Research, German Aerospace Center (DLR), Germany
- 3Planetary Ices Laboratory, Lulea Technical University, Kiruna, Sweden
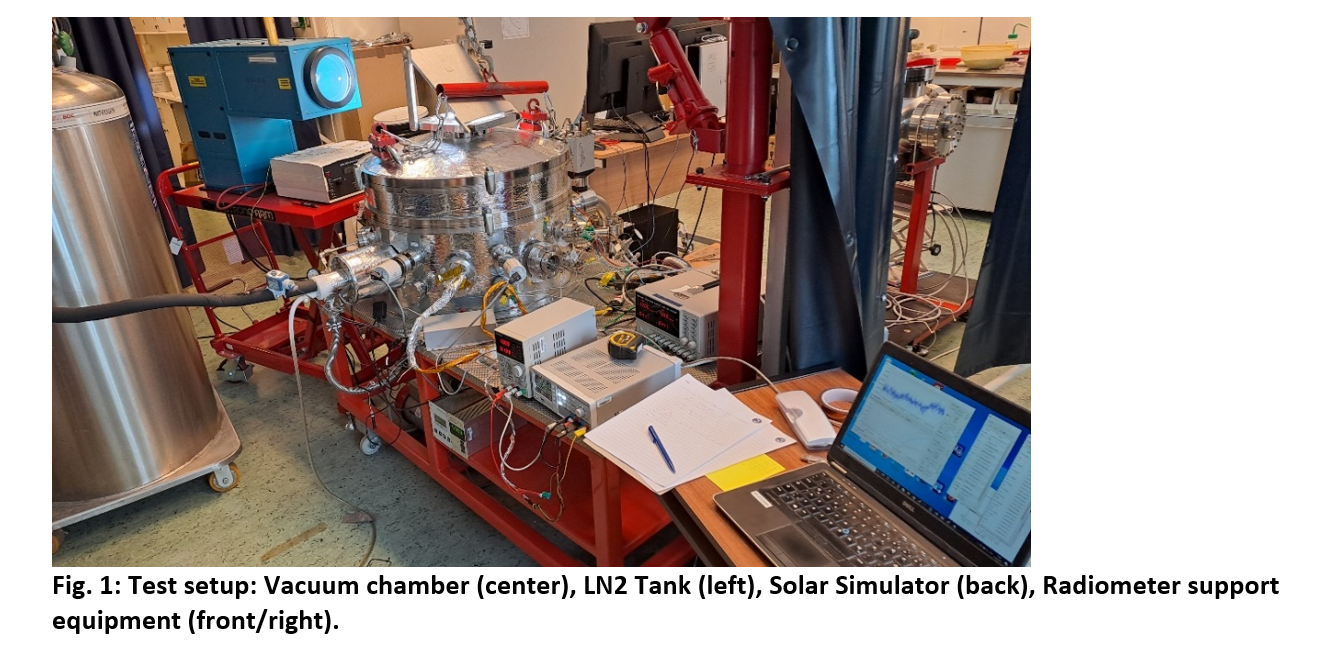
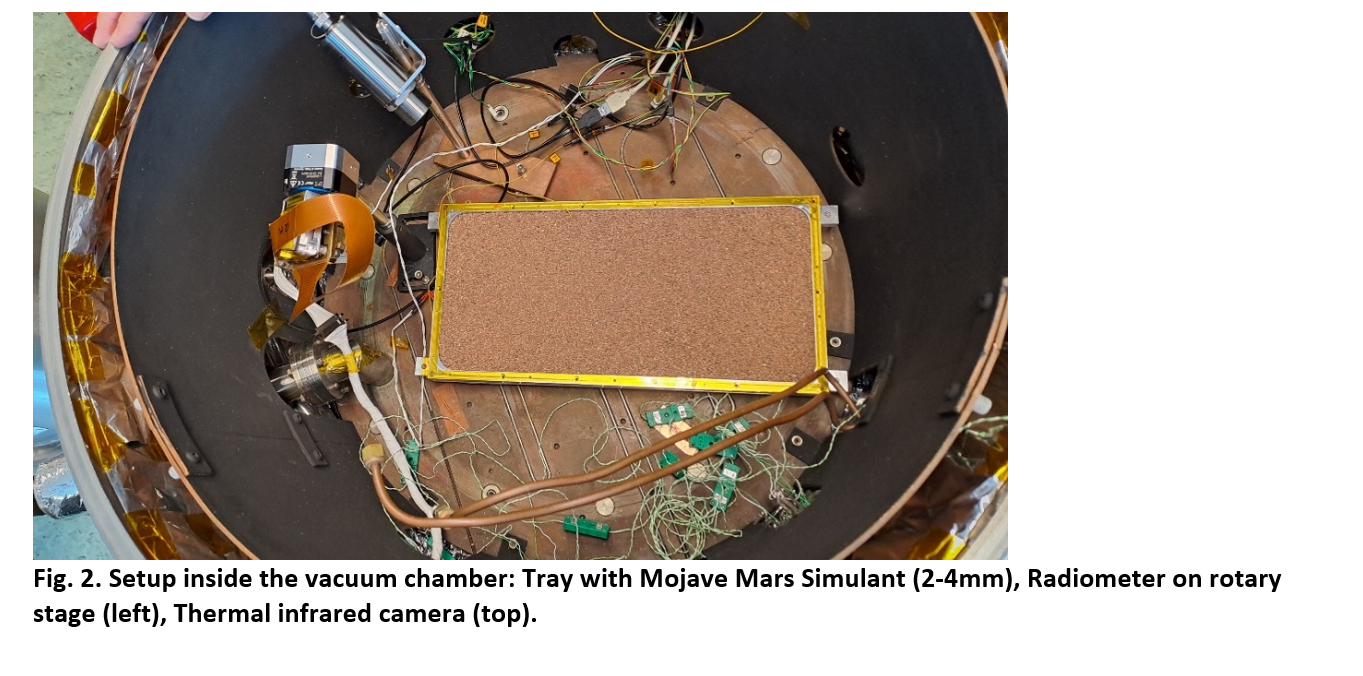
The objective of this series of experiments was to support the data interpretation of short period changes in insolation of planetary bodies such as solar eclipses or transits. The temperature response of Martian regolith to the transit of Phobos has been observed by InSight and interpreted in terms of layering in the near surface [Mueller et al. 2021]. Current and future mission may observe similar transits if a suitable thermal infrared instrument is available. An opportunity to observe a similar event with the roles of Mars and Phobos switched may be the rover on the Martian Moons eXplorer (MMX) carrying the Mini-RAD radiometer [Ulamec et al. 2023]. The original mission plan did not foresee a landing on the Mars facing side, but in case the plan is revised due to the changing launch date there might be a chance. There are however open questions about the interpretation of such observations using 1D models of heat conduction [e.g. Mueller et al. 2021]. These models assume that the subsurface is a continuum, while in reality the material consists of particles that are not necessarily small compared to the characteristic depth scale (skin depth) of the material responding to the changes in insolation. The Planetary Ices Laboratory has the necessary equiment to recreate such events on Earth in form of a thermal vacuum chamber and a solar simulator (Fig. 1). The chamber walls can be cooled with liquid nitrogen and a window with mirror on the chamber ceiling allows illumination of an approximately 15 cm diameter spot by the solar simulator. For our test set-up we have placed a tray of about 38x18x2cm filled with regolith analogue material in the center of the chamber (Fig. 2) i.e. encompassing the illuminated spot. The radiometer is set up within the chamber on a rotary stage that allows to move the Field of View of the instrument along the long axis of the tray. The FoV is small enough to fall within the illuminated spot and the rotary stage allows adjustments within the running setup. A small TIR camera also observed the tray. This instrument has lower temperature resolution but provides data on temperature inhomogeneity of the sample. The general approach of simulating the eclipses was to first evacuate the chamber, either refill with 5 mbar CO2 or to leave at <1e-4 mbar, to cool the chamber to below -60 °C, then to illuminate the regolith analogue material until the temperature approaches an equilibrium. After that the solar simulator shutter is closed for a certain duration to simulate an eclipse. This is a more abrupt change in insolation than in reality, however the purpose of these tests is to explore the limits to which our 1-D heat conduction models, that are based on the continuum assumption, can reproduce the response of materials where the layer thicknesses are not large compared to the particle sizes. For this the duration of the insolation excursion is much more important than the shape of the excursion, because the duration governs the depth to which the temperature response extends. The simple on-off state of the insolation will simplify the model calculations. During our time at the planetary ices lab we conducted 8 different tests, consisting of 4 different material configurations and 2 different pressures, corresponding to Mars and space. The first configuration consists of 2-4 mm Mojave Mars Simulant (MMS) filling the tray to a depth of 2 cm. This is intended to correspond to the deeper layers of Mars Regolith. In reality the particle size distribution of regolith is wider but we chose the coarser material to achieve a greater contrast between the layers in the following. The next configuration distributes MMS sieved to < 100 µm over the coarse material. The volume was chosen to correspond to 2 – 3 monolayers at this particle size. This material was chosen to represent airborne Martian dust that is continually removed by dust devils (or, infrequently, by landing rockets) and resettles during the dusty season and dust storms. The next configuration adds about 3 mm more dust by extending the rim of the tray and filling the tray to the new height. This was chosen as an example of a thicker dust layer. Finally, there is a concern that larger clasts (~cm), which can be expected to fill a significant fraction of the FoV, may affect the data inversion, as they cannot be easily modeled using a 1D model. To this end we added such clasts on top of the dust layer. The eclipses followed a sequence of durations that (with exceptions) were 5 sec, 10 sec, 20 sec, 40 sec, 120 sec. For cases where the top layer thermal conductivity was very low we extended the last eclipse to 240 sec. After each eclipse the insolation was left on for at least 3 times the eclipse durations so that temperatures could return to near the pre-eclipse values. The temperature response of the different durations extends to different depths an therefore may sense different layers with different thermophysical properties. The surface temperature was observed using a space qualified radiometer using a thermopile with a spectral bandpass from 8-14 µm at a sampling frequency of 1 Hz. The initial data analysis shows the effect of layering, but for a more complete evaluation the exact test conditions (chamber and sample temperature, solar simulator power) will have to be included in 1 D heat conduction models that are work in progress. Fitting these data under these well known conditions (boundary conditions, material properties) will show how accurate 1D continuum models are for the interpretation of short term changes in insolation such as transits. Depending on the results we will re-evaluate the interpretation of the InSight data. Acknowledgements: This project has received funding from the European Union's Horizon 2020 research and innovation programme under grant agreement No 871149.
How to cite: Müller, N., Knollenberg, J., Kaufmann, E., Hagermann, A., and Grott, M.: Analogue simulation of the temperature response of Mars surfaces to Phobos transits, and vice-versa, Europlanet Science Congress 2024, Berlin, Germany, 8–13 Sep 2024, EPSC2024-1007, https://doi.org/10.5194/epsc2024-1007, 2024.