Multiple terms: term1 term2
red apples
returns results with all terms like:
Fructose levels in red and green apples
Precise match in quotes: "term1 term2"
"red apples"
returns results matching exactly like:
Anthocyanin biosynthesis in red apples
Exclude a term with -: term1 -term2
apples -red
returns results containing apples but not red:
Malic acid in green apples
hits for "" in
Network problems
Server timeout
Invalid search term
Too many requests
TP14
Session assets
Perseverance rover
Mars 2020 Perseverance rover is currently exploring Jezero Crater on Mars, which contains an ancient lake-delta fan system with a high potential for past habitability. One of Perseverance’s primary science goals is to collect a set of scientifically return-worthy samples for return to Earth (Mars Sample Return; MSR) [1]. Between February 2021 and May 2024, Perseverance has sealed 24 tubes containing 21 rock cores, 2 regolith samples and one atmosphere sample. Of the 17 rock cores and regolith samples, 8 were collected on the crater floor, 9 at the fan front, 3 at fan top and 3 at the Margin. Additionally, 3 witness tube assemblies (WTAs), which will serve as blanks for contamination control, have been sealed. A total of ten tubes have been deposited in a depot in the Three Forks area. All rock and regolith samples are accompanied by a set of observations (Sample Threshold Observation Protocol, the STOP List) performed on abrasion patches or regolith near each sample collection site. These observations are documented in the Initial Reports and the Sample Dossier which are available through the Geosciences Node of the Planetary Data System (https://pds-geosciences.wustl.edu).
Samples
The eight rock cores collected on the crater floor include samples of the two major rock units of the crater floor, the Máaz formation (basaltic to basaltic-andesite) and the Séitah formation (olivine-cumulate). In addition to the primary igneous mineralogy such as olivine, pyroxene and feldspar, these samples contain alteration minerals such as sulfates, carbonates and perchlorates indicating interaction with liquid water in the past [2]. These samples will be important for understanding Mars igneous history and providing constraints on the timing of Jezero crater and the fan units. The alteration phases in the rocks will enable studies of water-rock interaction within Jezero crater.
The seven rock cores collected from the Shenandoah formation at the fan front are all fine-grained sedimentary rocks that were likely deposited in a lacustrine environment [3]. If returned to Earth, these rocks would be the first sedimentary rocks from Mars to be studied in terrestrial laboratories. Three cores (Hazeltop, Bearwallow and Kukaklek) were collected at the layered outcrops Wildcat Ridge and the stratigraphically equivalent Hidden Harbor. These samples are fine-grained sandstones to siltstones and are mainly composed of sulfates and phyllosilicates. They also contain various diagenetic features such as calcium sulfate veins/veinlets (typically anhydrite) and putative concretions. Two cores (Swift Run and Skyland) were collected at the layered outcrop Skinner Ridge. They are medium- to coarse- grained sandstones containing pyroxene, feldspar, carbonates and serpentine. Finally, two cores (Shuyak and Mageik) were collected at the layered outcrop Amalik. They are fine-grained sandstones and mainly composed of olivine grains that have been altered to phyllosilicates, most likely a serpentine phase. There are also carbonates associated with these cores. The phyllosilicates, sulfates and other alteration phases present in the fan front rock cores could potentially have trapped organic matter and other biosignatures originating from the ancient lake or from the Jezero watershed. Thus, these samples will be exceptionally valuable for astrobiological investigations upon return from Mars.
The two regolith samples (Atmo mountain and Crosswind) were collected at a megaripple, Observation Mountain, near Amalik at the delta front [4]. The samples consist of different-sized grains of varying compositions including olivine, altered olivine, feldspar, carbonates, sulfates and phosphates. These samples will enable studies of the regolith and dust of Mars.
Three cores were collected at the fan top, Melyn, Otis Peak and Pilot Mountain [5]. They are all poorly sorted medium sandstone with clasts ranging up to pebble sizes and believed to be part of the Tenby formation, which likely represents a fluvial environment and overlies the fan front. They contain olivine, feldspar, pyroxene and alteration phases such as Mg-Fe carbonates, Mg-sulfates, Ca-sulfates, phyllosilicates and chlorinated phases. These samples represent some of the coarsest sedimentary material yet sampled by the rover. Their detrital clasts have diverse lithologies likely sourced from the Nili Planum region outside Jezero crater that contains some of the oldest known rocks on Mars (>~4 billion years old). Therefore, laboratory investigations of these samples will enable the study of a source-to-sink sedimentary system on Mars that will inform how surface environments, aqueous processes, and habitability evolved through time, both within the catchment and the fan.
Finally, three cores were collected in the Margin unit with two cores collected in the eastern Margin (Pelican Point and Lefroy Bay) and one core in the western Margin (Comet Geyser) [6]. They are all medium to coarse sandstones expect Comet Geyser which could be either a coarse sandstone or aqueously altered igneous rock. The rocks contain a high portion of carbonates with silica as a likely cement. Also present are olivine, pyroxene, minor feldspar, altered silicates and phyllosilicates. The Margin unit has a high astrobiological interest due to its high carbonate signal as observed from space and in-situ and its potential as a shoreline deposit. Parts of carbonates and silica are microcrystalline which make them excellent for biosignature preservation.
Perseverance is currently continuing its exploration of the Margin unit with the possible collection of one more sample. After finishing the Margin campaign, the next step is to explore the crater rim which will include some of the oldest rocks on Mars (>~4 billion years old).
[1] Farley K.A. et al. Space Science Reviews, 216 (2020), [2] Farley, K.A. et al. Science, 377 (2022), [3] Bosak et al. Lunar Planetary and Science Conference (2024), [4] Hausrath, E.M et al. Lunar Planetary and Science Conference (2023), [5] Weiss B. et al. Lunar Planetary and Science Conference (2024), [6] Siljeström et al. Lunar Planetary and Science Conference (2024)
How to cite: Siljeström, S., Herd, C., Bosak, T., Farley, K., Stack, K., Benison, K., Czaja, A., Debaille, V., Hausrath, E., Hickman-Lewis, K., Mayhew, L., Sephton, M., Shuster, D., Simon, J., Wadhwa, M., Zorzano, M.-P., and Weiss, B.: Samples collected by Mars 2020 Perseverance at Jezero Crater for Mars Sample Return, Europlanet Science Congress 2024, Berlin, Germany, 8–13 Sep 2024, EPSC2024-1049, https://doi.org/10.5194/epsc2024-1049, 2024.
The modern surface of Mars does not sustain liquid water, however relict landforms observed on orbital images provide strong evidence of past aqueous activity. Nevertheless on-the-ground analysis of sedimentary strata are required to robustly characterise the specific nature of early Mars palaeoenvironments. The Mars 2020 Perseverance rover is exploring a prominent sedimentary fan deposit at the western margin of Jezero crater – the Western fan – which has been interpreted to be an river delta that prograded into an ancient lake basin during the Late Noachian-Early Hesperian epochs on Mars (~3.6-3.8 Ga). Perseverance’s traverse across the fan in 2022-2023 provides a remarkable window into a fossilised sediment routing system on Mars with potential to understand how water and sediment were distributed across a Martian landscape under a markedly different climate to present day. Here we use the rover’s cameras to characterise sedimentary geometries in a distal to proximal transect across the western fan and reconstruct sediment dynamics on the Western fan and infer past environmental change. The distal reaches of the preserved fan show a sedimentary succession that records a transition from distal alluvial fan into lacustrine and subsequently foreset delta deposits. This succession records the initiation of a martian lake system and lake level rise, though overlying delta stratal geometries suggest deposition during episodes of lake level fall. In the medial sector of the upper exhumed portion of the fan, complex stratal geometries are observed with a variety of scenarios for palaeoenvironmental interactions possible. In particular, the presence of large-scale foreset units preserved in this ‘mid-fan’ sector possibly suggests complex deltaic interfingering with fluvial strata during lake level fluctuations. In more proximal and stratigraphically higher (and hence younger) sectors of the fan, we observe strata deposited by progradation of fluvial systems culminating in a sequence of rounded boulder-containing deposits that signal transition to a routing system characterised by high discharges. Misquoting Shakira “the sediments don’t lie”; they record a history of sustained water transport and habitability on early Mars.
How to cite: Gupta, S., Stack Morgan, K., Mangold, N., Ives, E., Gwizd, S., Caravaca, G., Williams, R., Barnes, R., Randazzo, N., Horgan, B., Siebach, K., Tate, C., Núñez, J., Sholes, S., Kah, L., Paar, G., Le Mouélic, S., Maki, J., and Bell III, J.: Landscape evolution on early Mars: insights from the Jezero western fan, Europlanet Science Congress 2024, Berlin, Germany, 8–13 Sep 2024, EPSC2024-873, https://doi.org/10.5194/epsc2024-873, 2024.
Introduction: Jezero Crater lies in one of the most extensive carbonate-rich regions on Mars [1, 2], and diverse carbonate-bearing units were detected from orbit within the crater [3-6]. In particular, a unit along the Western rim of the crater stands out with especially strong carbonate signatures in CRISM data. Several origins have been considered for these “Marginal Carbonates”, including a lacustrine beach-deposit, altered igneous or pyroclastic deposits, aeolian or fluvial-deltaic origins [4]. Since September 2023 (Martian day or “sol” 910), the Perseverance rover has been exploring this so-called Margin Unit (Fig. 1A) [7].
Method: We use data collected with the SuperCam instrument [8, 9] during the Margin Campaign (up to sol 1124), with three complementary spectroscopy techniques for chemical (laser-induced breakdown spectroscopy, LIBS) and mineralogical characterization (Raman and infrared reflectance spectroscopy, IRS) of rocks along the rover traverse. Additionally, the Remote Micro-Imager (RMI) provides high-resolution color images to contextualize the spectroscopic analyses.
In particular, we derive abundances for major elements (MOC) from LIBS [10], and identify specific minerals, in particular olivine and pyroxene, based on stoichiometric analyses [11]. Carbonates (above ~50 vol% [12]) can be identified based on a combination of MOC and carbon signal characterization [12, 13]. With Raman, the position of the carbonate mode can be used to derive the composition of Fe-Mg carbonates (Mg# defined as Mg/(Fe+Mg)) [14].
Results:
LIBS – The Margin Unit shows the highest concentration of both carbonate-bearing and high silica points along the entire traverse (49% of carbonate detections and 73% of points with SiO2 > 65 wt.% for 22% of LIBS analyses). Besides these, rocks in the Margin Unit are generally of mafic composition, including multiple detections of olivine and pyroxene (Fig. 1 C-F, [11]). Although all the carbonates are Ca-poor and Fe-Mg rich, their composition is variable. In particular, before sol 1027, carbonates covered a large range of composition (Mg# varying between ~0.3 and 0.8); since sol 1027, the Mg# of identified carbonate-bearing points are clustered in the 0.6-0.8 range (Fig. 1D, F). Since these compositional changes are correlated with changes in rock morphologies and textures [7, 15, 16], we defined two sub-units: the Eastern Margin (EM) before sol 1027 and the Western Margin (WM) afterwards (Fig. 1B).
IRS – With IRS, the Margin Unit is characterized by three main signatures: i) the 1.9 μm hydration band, comparable to what is observed in the vast majority of targets in Jezero Crater [17, 18]; ii) a 2.2 μm band, more frequent and deeper than in previous units and attributed to Si-OH based on the correlation with LIBS data; iii) absorption bands at 2.3 and 2.5 μm corresponding to carbonates, with a possible contribution of clays. Most spectra also show a positive slope between 1.3 and 1.8 μm, attributed to Fe2+ in either olivine or carbonate. Additionally, a small band at 2.39 μm indicates the presence of Fe-phyllosilicates in some targets, but their precise characterization is complicated by the strong carbonate signatures.
Raman – For the first time in the mission, carbonates were detected not only in all three abraded patches (Fig. 1B) but also on six different targets with natural surfaces in the Western Margin. Some significant variability in Mg# is observed (median values: EM=~0.45; WM=~0.6).
With Raman, olivine was also detected in the first abrasion patch in the EM. No high-silica phase was detected with SuperCam Raman, which however is challenging due to an instrumental artifact.
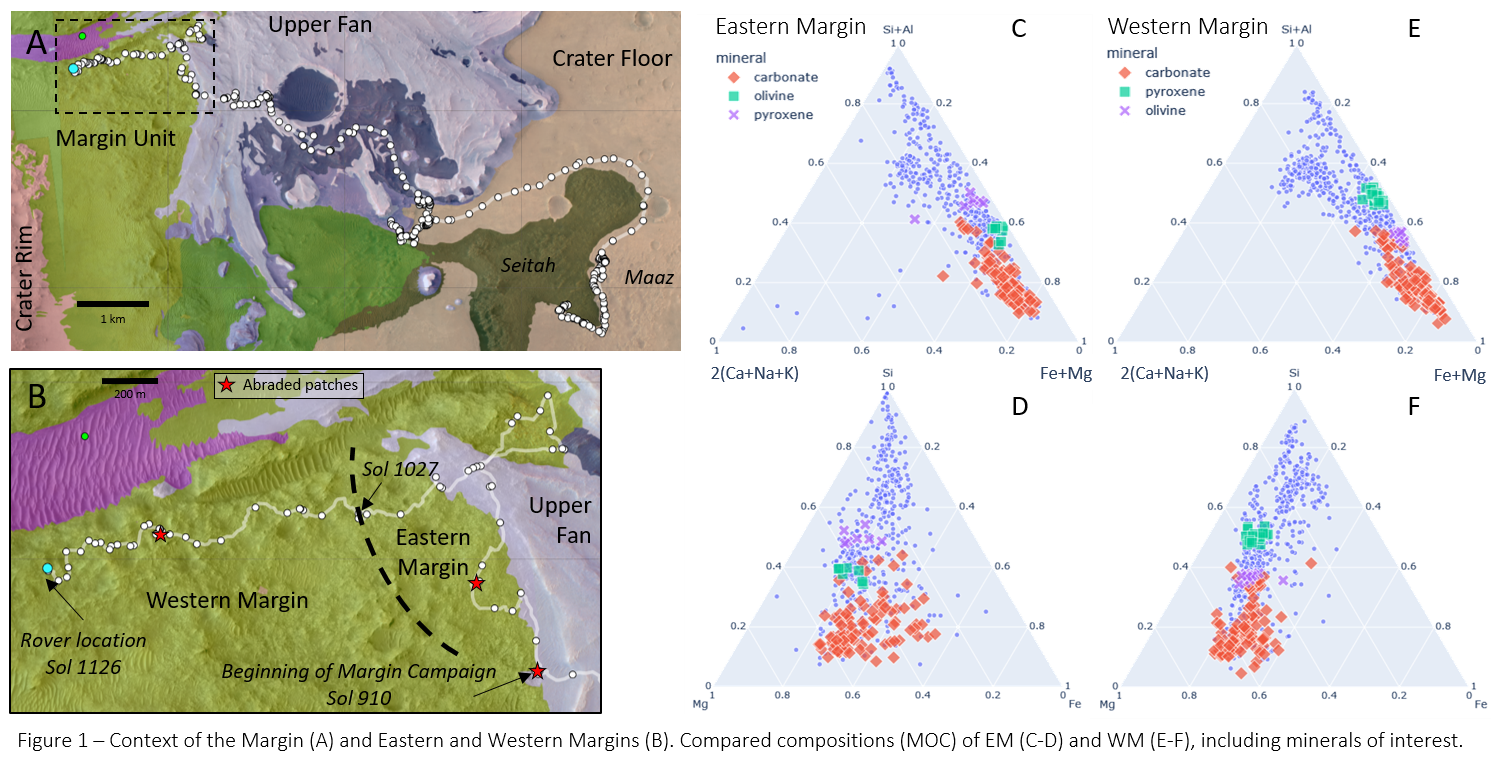
Summary & Discussion: Several lines of evidence indicate that the Eastern and Western Margins may be distinct. Observations of layering and clastic textures show that the EM is likely of sedimentary origin. The WM lacks clear structure to conclude confidently [7, 15, 16].
The Margin Unit is uniquely enriched in both Fe-Mg carbonates and a silica-rich phase (LIBS, Raman and IRS). The silica is at least hydroxylated based on the IRS, but its hydration state is not well constrained. Additionally, points with mafic compositions in LIBS, including olivine and pyroxene grains, are also omnipresent in this unit. Beyond these general observations, we note some variability within the Margin Unit, and in particular between the Eastern and Western parts. Based on LIBS data, the WM presents a more restrained range of carbonate compositions, with only Mg-rich carbonates, covering the same range of composition as the primary minerals identified in this sub-unit (Fig. 1F). Raman data confirm the higher Mg# in carbonates in the WM. In the EM, the range of carbonate composition is wider, and wider than the range of primary mineral compositions (Fig. 1D).
The combination of mafic minerals, high-silica points and carbonates is consistent with altered mafic/ ultramafic rocks, possibly analog to carbonated peridotite [e.g. 19, 20]. The SuperCam data do not enable to confidently conclude regarding the presence of serpentine or talc in these rocks, although some phyllosilicates are detected with IRS. Nonetheless, the match between the compositions of carbonates and primary minerals in the WM is consistent with in situ alteration of olivine-rich lithology with CO2-rich fluids in a closed-system. However, the original process of emplacement of this mafic material is still poorly constrained. In the EM, the more diverse compositions – in particular of carbonates – and layering could indicate additional reworking of this altered-mafic material, possibly including Ca-enriched fluids.
References: [1] Ehlmann, Mustard et al. (2008) Nature geosc., [2] Mandon et al. (2020), [3] Goudge et al. (2017), [4] Horgan et al. (2020), [5] Tarnas et al. (2021), [6] Zastrow & Glotch (2021), [7] Horgan et al., (2024) Mars X, [8] Maurice et al. (2021) SSR. [9] Wiens al. (2021) SSR. [10] Anderson et al. (2022) SAB. [11] Udry et al., (2024) Mars X, [12] Beck et al. (2024) Icarus. [13] Clavé et al. (2023) JGR. [14] Beck & Beyssac et al., sub. [15] Jones et al., (2024) Mars X,[16] Ravanis et al., (2024) Mars X, [17] Mandon et al. (2023) JGR, [18] Dehouck et al. (2023) LPSC, [19] Beinlich et al. (2010) [20] Johnson et al. (2019)
How to cite: Clavé, E., Beck, P., Beyssac, O., Forni, O., Schröder, S., Mangold, N., Royer, C., Mandon, L., Dehouck, E., Le Mouélic, S., Quantin-Nataf, C., Udry, A., Bedford, C., Rammelkamp, K., Clegg, S., Gasnault, O., Wiens, R., and Cousin, A. and the SuperCam Team: New constraints on the “Marginal Carbonates” from in situ observations with SuperCam, Mars2020 , Europlanet Science Congress 2024, Berlin, Germany, 8–13 Sep 2024, EPSC2024-255, https://doi.org/10.5194/epsc2024-255, 2024.
Introduction:
The study of clay-rich deposits is key to understanding past water activity on Mars and its early habitability potential. Strong phyllosilicate signatures have been identified over the Mawrth Vallis plateau based on the OMEGA instrument [1]. Similarly, large clay-rich deposits have been detected in Oxia Planum [2], the landing site of the ExoMars Rosalind Franklin rover mission. The rover aims to investigate the Martian surface and subsurface with its two-meter-deep drill, searching for potential traces of past life preserved in these phyllosilicate-bearing units [3].
Aqueous alteration minerals from the selected landing site exhibit spectral features consistent with Fe/Mg-rich phyllosilicates, best fitted with vermiculite or saponite due to the position & shape of the 2.3µm absorption band, and a Fe2+ oxidation upward slope from 1µm to ~1.7μm [2]. These large clay units date back to the Noachian period [4]. 300km northeast, clays found in Mawrth Vallis are consistent with montmorillonite (Al rich) and nontronite (Fe3+/Al rich) smectites, as indicated by spectral absorptions at respectively ~2.2µm and ~2.3µm, as well as their overall shape [5]. These units are also dated to the Noachian period [6].
The proximity of both sites and their similar position straddling the crustal dichotomy calls for the investigation of the relationship between these two significant phyllosilicate-bearing regions.
Method:
Datasets: Given the expansive scope of our study area spanning from Oxia Planum to Mawrth Vallis, we used the OMEGA hyperspectral dataset (~300 to 4000 m/pix) [7].
Tools: We developed custom Python scripts to correct OMEGA cubes, map spectral criteria, and project raster data. Extraction of regions of interest (ROIs) and spectral analysis was done in QGIS using the EnMAP-Box plugin [8].
Cube corrections: Six correction steps have been implemented: (1) an atmospheric absorption band correction (“volcano-scan” method) [9]; (2) a Mars surface thermal contribution correction (gray body subtraction) [10]; (3) corrupted pixels and spectels are removed from the cube; (4) each spectrum is fitted and then divided by a linear regression continuum with tie points centered around 1.75µm and 2.14µm, where few clay minerals absorb [11]; (5) each spectrum is normalized by its maximum value to ensure a cube with homogeneous reflectance values and mitigate significant photometric effects resulting from changes in topography; (6) the local neutral mineralogy is removed using a “clean mean” method: the median spectrum of a 50-pixel-squared region – where pixels positive to the 2.3µm criteria have been masked, hence the “clean” median – is calculated and subtracted from each spectrum. This step improves the detectability of phyllosilicate absorption bands, as their local “neutral” component is removed.
Spectral criteria maps: We mapped the following criteria: 1.9µm band depth of most hydrated minerals, 2.2µm drop of Al-smectite, 2.3µm drop of Fe-/Mg-phyllosilicates [11] (Figure 1), and HCP & LCP pyroxenes [12] (green in Figure 2).
ROIs: We converted clusters of contiguous pixels where the detection criterion was higher than a predefined threshold to shapefiles using QGIS functions. Spectral analysis over a ROI was possible after making adaptations to the EnMAP-Box Plugin [8], which were contributed to the project: by selecting one (or multiple) polygons, we compute their median spectrum (Figure 2).
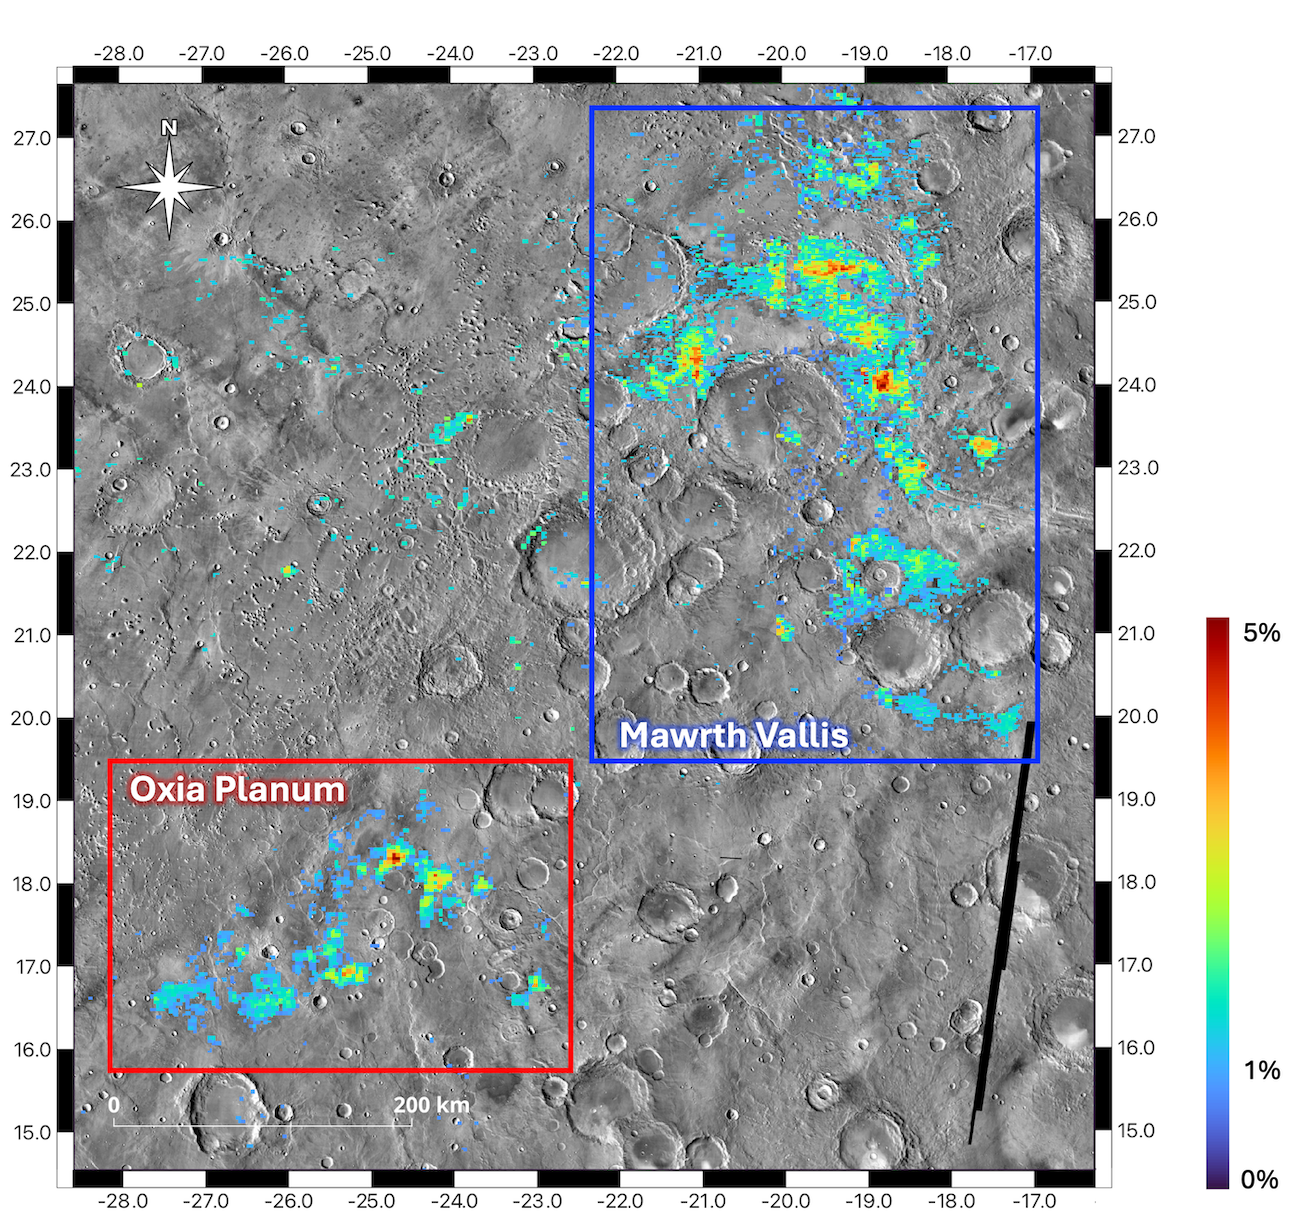
Figure 1: 2.3µm-drop spectral criteria (1% threshold). Basemap: THEMIS-day.
Results:
Our 2.3µm drop criterion map aligns with existing phyllosilicate maps of Mawrth Vallis and Oxia Planum (Figure 1) [13]. Spectral analysis reveals two distinct clay types, as introduced earlier: the “Oxia Planum”-like (red in Figure 2) and the “Mawrth Vallis”-like (blue in Figure 2).
Oxia Planum clays in Mawrth Vallis and vice-versa: We noticed two areas (ROI n°1 and n°4) exhibiting different characteristics than the region they belong to. Spectrum n°1 (in Mawrth Vallis) shows Oxia Planum-like features: Fe2+ upward slope up from 1µm to 1.6µm, and the position & shape of the 2.3µm absorption. Reflectance bumps at 1.6µm (instead of 1.7µm) and 2.6µm (instead of a plateau) can be explained by the presence of pyroxenes in this ROI, which lies above a green zone, as seen in Figure 2. Spectrum n°4 (in Oxia Planum) shows the same shape & absorptions as the Mawrth-Vallis one (n°3). Spectra n°2 and n°3 show less spikes, as signal-to-noise ratio increases with the square root of the pixel count.
Lava flows covering clays? Clay detections seem to be anticorrelated with dust (dark shades in Figure 2) and, often, pyroxenes (or with traces of it in their spectra, as in n°1). CTX imaging also reveals wrinkle ridge morphologies over green spots, suggesting that lava flows may have covered ancient clay-rich areas between Oxia Planum and Mawrth Vallis. Layered crater walls, observed with HiRISE, seem to confirm the presence of clays between these two major regions – more closely related than we initially believed, but showing signs of a different ancient aqueous history. We are now deciphering the stratigraphic relationship between the two types of clays, and broadening the scope of our study to the clay-rich margins of Chryse Planitia.
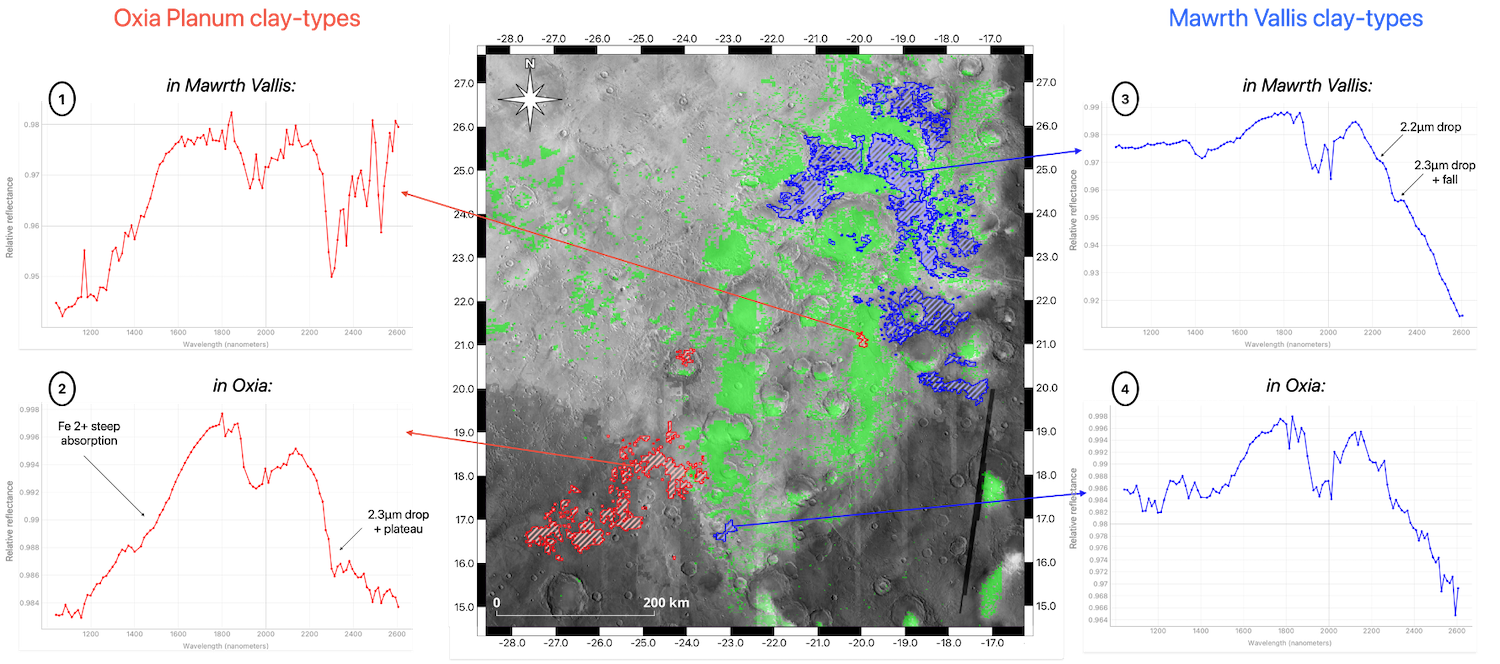
Figure 2: Mawrth Vallis (blue) and Oxia Planum (red) clays over pyroxenes (green) and OMEGA dust emission (greyscale) [14].
References: [1] Poulet F. et al. (2005) 438(7068), 623-627. [2] Carter J. et al. (2016) 47th LPSC, Abstract #2064. [3] Vago J. L. et al. (2017) Astrobiology, 17(6-7), 471-510. [4] Quantin-Nataf C. (2021) Astrobiology, 21(3), 345-366. [5] Bishop J. (2008) Science, 321(5890), 830-833. [6] Loizeau D. (2007) JGR: Planets, 112(E8). [7] Bibring J.-P. et al. (2004) ESA Spec. Pub., SP-1240. [8] Jakimow B. et al. (2023) SoftwareX, 23, 101507. [9] Langevin Y. et al. (2005) Science,307(5715), 1584-1586. [10] Jouglet D. et al. (2007) JGR :Planets, 112(E8). [11] Carter J. et al. (2013) PSS, 76, 53-67. [12] Ody A. et al. (2012) JGR: Planets, 117(E11). [13] Carter J. et al. (2023) Icarus, 389, 115164. [14] Audouard J. et al. (2014) Icarus, 233, 194-213.
How to cite: Torres, I., Carter, J., Quantin-Nataf, C., Volat, M., Millot, C., and Dehouck, E.: Extent and Nature of Clay-rich Deposits, from Oxia Planum to Mawrth Vallis, Europlanet Science Congress 2024, Berlin, Germany, 8–13 Sep 2024, EPSC2024-609, https://doi.org/10.5194/epsc2024-609, 2024.
Introduction: Hellas Planitia is the largest and deepest preserved impact basin on Mars. It was likely in place by the Early Noachian and has since undergone a complex geologic history with km-thick infillings and similar magnitudes of erosion [1]. As a deep basin, Hellas must have played an important role within the Noachian hydrological system(s), regardless of if these were long or short-lived, continuous or intermittent [e.g. 2,3]. There are a number of conspicuous morphological and mineralogical clues within or around Hellas which suggest past aqueous activity. In particular, its outer rim features phyllosilicates in layered (likely sedimentary) deposits [4,5]. There is also evidence for at least ephemeral flow of water, as evidenced by regionally extensive silcrete deposits [6-9]. Yet there is no evidence for past ponding within Hellas.
Method: To better understand the role of Hellas within past hydrological systems, we conducted a systematic survey of the mineralogy and morphology. Mineralogy is obtained through orbital remote sensing with the OMEGA/Mars Express and CRISM/MRO instruments. Most observations did not yield meaningful surface composition data, owing to the increased atmospheric opacity of Hellas, its frequent hazes and frosts. We focused our study on the most eroded western part of Hellas which exhibits terrains of a large range of ages.
Results: The resulting mineral mapping is shown in figure 1 (MOCAAS database [10] https://www.ias.u-psud.fr/moccas). Three distinct mineral units are distinguishable: 1) Fe/Mg phyllosilicate sediments (red) just outside of Hellas, 2) opal CT/chalcedony silcretes (cyan) on the intermediate margin of Hellas, 3) a previously unknown sulfate-rich floor unit (green). The patchy nature of the mineral maps within Hellas is a detection bias as they are only few valid observations, and signal-to-noise levels are generally lower than the rest of Mars. A conservative mapping approach was chosen here.
We focus on the sulfate unit of the floor of Hellas, which is mostly exposed on its western side. The striking feature of these salts is that they correlate with a small set of morphological units, and that they are found in the deepest exposed sections of Hellas Planitia (currently mapped between - 6500 and -7500 m, mostly below -7000 m). As such they are likely not related to polar sulfates which are known to have formed (or still form) at high southern latitudes [11].
The precise composition of the salt hasn’t been ascertained yet, but it is most likely a poly-hydrated sulfate, which spectra are similar to salt deposits of the Terby crater floor, but is not unique to these sites. The 1.9 µm band shape is generally inconsistent with gypsum but may include bassanite. The spectra do not exclude hydrated chlorinated salts [12,13]. The salt detections are correlated primarily to the so-called “honeycomb” terrains, and to a lesser degree to the “banded” terrains (figure 2). Previous terrain designation also included “reticulate” terrains [12-14].
Discussion: A recurring interpretation of the honeycomb terrains are that they diapirs which topmost section has been eroded away, exposing the truncated cells [e.g.17-19]. The banded terrains are at times equated to the honeycomb terrains or considered to be a different unit. The formation of diapirs is related to the presence of layers of different densities, the lighter material being buried below a dense material such as lava flows. The diapiric material has been proposed to be either salt or ice [e.g. 19] but direct compositional evidence was lacking to distinguish between both scenarios. We therefore propose that these were indeed salt diapirs. The salty nature and cell size of the diapiric terrains of Hellas Planitia suggest ~2 km of salts existed on the basin floor [e.g. [19], only exposed where erosion most deeply incised the overlying material.
One consequence is that this observation may help solve the conundrum of the missing salts on early Mars [20]. As the Noachian highland terrains were leached and formed phyllosilicates, if sulfates were the cation host, it may indicate the climate at least intermittently allowed a mature hydrological system wherein salts would be transported in dissolved fraction over large distances from source to sink, and accumulate in sedimentary basins - most notably Hellas.
Concerning Hellas Planitia specifically, this detection suggests that Hellas has had one or several episodes during which it was filled by water. Kieserite (mono-hydrated sulfate) is relatively dense and would preclude the formation of diapir cells but poly-hydrated salts are light enough to enable diapirs [19], consistent with the CRISM and OMEGA spectra. Chlorinated salts are also light enough and cannot be excluded from the spectra at this point, either as an alternative to the sulfate, or perhaps as an assemblage which cannot be directly detected (especially in dehydrated form).
Further investigations of the extent of the sulfate unit is required to understand both the altitude range and lateral extent of the salt diapirs, which will strongly affect the size of the sea and the cumulative GEL of water required to deposit the salts. Recent estimates range from a sea a few 100s m deep to over 1 km [17], but previous studies proposed Hellas was filled well above these values [4]. The exact sulfate composition will also be refined.

Figure 1 . Western Hellas Planitia aqueous mineralogy based on OMEGA and CRISM. Red: Fe/Mg phyllosilicates. Cyan: hydrated silica. Green: poly hydrated sulfates.
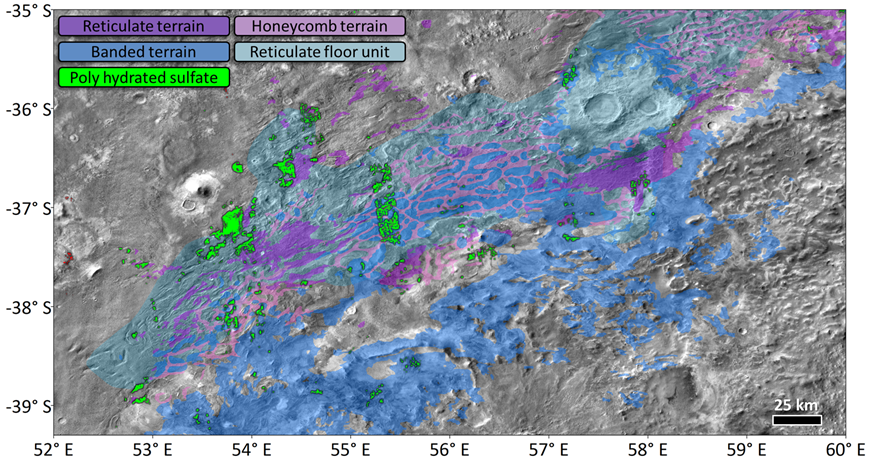
Figure 2. Close up on the sulfate-rich diapirs of Hellas. Geological units from [14,16].
References: [1] Tanaka+95, JGR, 100, 5407-5432. [2] Andrews-Hanna+11, JGR, 116, E02007. [3] Hiatt+24, Icarus, 408, 115774. [4] Wilson+07, JGR, 112, E08009. [5] Ansan+11, Icarus, 211, 273-304. [6] Bibring+06, Science, 312, 400. [7] Bandfield+08, GRL, 35, L12205. [8] Carter+13, JGR, 118, 831–858. [9] Pineau+23, LPSC 54th, abstract #1982. [10] Carter+23, Icarus, 389, 115164. [11] Barraud+22, EPSC 16th, abstract #847. [12] Hanley+13, JGR, 20, 1415–1426. [13] Bishop+14, LPSC 45th, abstract #2145. [14] Leonard+01, USGS Spec. Pub., doi. 10.3133/i2694. [15] Bernhardt+16, Icarus, 264, 407-442. [16] Bernhardt+19, Icarus, 321, 171-188. [17] Mangold+03, 6th Int. Conf. Mars, Abstract #3047. [18] Bernhardt+16, JGR, 121, 714-738. [19] Weiss+17, Icarus, 284, 249 -263. [20] Millliken+09, GRL, 36, L11202.
How to cite: Carter, J., Ansan, V., and Mangold, N.: Was Hellas Planitia a Noachian Sea?, Europlanet Science Congress 2024, Berlin, Germany, 8–13 Sep 2024, EPSC2024-802, https://doi.org/10.5194/epsc2024-802, 2024.
Mars shows evidence of having had watercourses, lakes and even possibly an ocean in its Northern Hemisphere (Ocean Borealis). What happened to cause the strong depletion of its atmosphere and the disappearance of its interior magnetic field? Recent observations show that there is still much to learn about the history of water on Mars. Water ice was detected in mid-latitudes, which is unexpected according to current models. Another unusual piece of evidence was the recent detection of large quantities of hydrated silicates (such as opals) in regions at low latitudes. Some selected fluvial-marine environments and ancient coastal regions were the subject of our study, particularly the mineralogical component.
Two indicators are the morphological evidence that reveals an active hydrosphere with liquid water flow and the probable existence of an ocean. The deltaic lobes record possible interactions between watercourses and a potential giant water body on Mars. Satellite imagery of Mars showing desiccated river channels and ancient crater lake beds insinuate that the planet was warmer, wetter, and more dynamic in its ancient past than it is today. However, we have little idea how much water there was on Mars, what was its chemistry and how long it persisted. Multiple ocean shorelines have been proposed that encircle the northern plains of Mars (Carr+2003; Dickeson+2020). Past oceans would imply many constraints on the climate, habitability and hydrological planetary evolution. Recent detections of water ice at the Martian low latitudes (Xiaoguang+2023) and also of an important amount of highly hydrated minerals (like opals) at low latitudes (Sun+2003) , clearly show that the history of water on Mars must be re-addressed.
Space-based datasets were crucial to reach the goals of this present study. This relevance was two-fold: the exploration of the selected fluvial-marine environments and the ancient shorelines of Borealis Ocean in great detail, for what we used datasets of high-resolution cameras (HRSC from Mars Express, CaSSIS from ExoMars, CTX and Hirise from MRO) and hyper spectral instruments as OMEGA from MEX and CRISM from MRO in order to perform reflectance studies.
The datasets from OMEGA/MEX and CRISM/MRO enabled us to capture the known spectral diversity of the surface, and allowed us to successfully highlight and differentiate between locations with differing spectral signatures.
Recent visible to short wavelength infrared (VSWIR) orbital observations of Mars revealed widespread and diverse minerals present on the surface that record a complex history of changing geologic processes and climatic conditions. Spectral signatures indicate a wide range of primary and alteration minerals that have been detected in the analyses of data from OMEGA (Bibring+2004) instrument onboard Mars Express and CRISM (Murchie+2007) instrument on board the Mars Reconnaissance Orbiter (MRO) (Zurek&Smrekar,+2007).
Constraining the nature and distribution of both primary and secondary mineralogy on the surface of Mars is central to understanding igneous processes that formed the crust, and subsequent alteration of it by liquid water on the surface or in the subsurface and by impacts and exposure to the low pressure atmosphere of Mars. OMEGA and CRISM measure the VSWIR to mid-infrared portions of the spectrum (0.35–5.2 μm and 0.362–3.92 μm, respectively).
The OMEGA instrument has a spatial sampling ranging from 350 to 10,000 m/pixel depending on the orbital altitude and a set of 352 bands or 400 bands (sampled at 7.5 nm from 0.35 to 1.05 μm,14 nm from 0.94 to 2.70 μm, and ~21 nm from 2.65 to 5.2 μm). CRISM can be targeted with a high spatial sampling of 18-36m/pixel, or a survey mode at 100 or 200m/pixel. CRISM targeted observations have hyper spectral resolution (544 bands, sampled at 6.55 nm), while survey mode spectral resolution can range from 72 to 261 bands depending on the observation mode, with sampling density varying from 53.4 nm between channels at sparsely sampled wavelengths to contiguous sampling at 6.55 nm/channel.
In the framework of the present study we searched for serpentines, olivine, clays and hydrated silicate mineral deposits in some selected fluvial-marine Martian environments and old shorelines from ocean Borealis, water ice-deposits in some designated shield volcanoes edifications and craters.
The areas of interest covered in this study are: the deltaic fan of Isara Valles in the region of Menmonia- -5.31755°, Lon: -146.15593; Mars Vallis- 14.31227°, Lon: -177.22114; the deltaic fan of the Camichel crater- Lat: 2. 3152°, Lon: -51.62544°; the deltaic fans of the semi-confined basin in the northern region of Elysium Mons- Lat: 32.50897°, Lon: 148.99952°; the deltaic fan in the crater near the dichotomous line of Isidis Basin- Lat: 26.94654°, Lon: 76. 05766°; the large crater located in Syrtis Major to the southwest of Isidis Basin- Lat: 21.00273°, Lon: 63.01488° and the progressive delta in the Margaritifer Sinus region- Lat: -23.4507°, Lon: -12. 20301°. These regions were chosen on the basis of their possible genesis (fluvial-marine or lacustrine) represented by their deltaic, fluvial and lacustrine alluvial morphology which can be identified using Digital Elevation Models (DEM), and by the presence of hydrated minerals detected by surface reflectance analysis.
Our work in short:
- We Identified and characterized morphological evidence associated with fluvial-marine environments on Mars and their relevance to constrain and characterize possible Martian old shorelines of Ocean Borealis
- We used OMEGA spectra datasets from Mars Express and CRISM/MRO as well, to detect and characterize specific minerals in old fluvial-marine systems on Mars surface. The methodology used was based in the diverse reflectance properties of the minerals we intended to study
- We used Exomars/TGO CaSSIS instrument to perform detailed geologic studies of minerals on Mars. A late-stage formation of hydrated minerals on hydrothermal sites has the potential to rewrite the history of water on the planet (Jakosky+2021). Also, the geochemical study of volcanic edifications in their regional context is particularly relevant for the reconstruction of paleo climate.
• We built several maps, DTM and mineralogical maps (Jaumann et al., 2007, Carter et al., 2023) of the selected regions on the ancient sea shorelines and surface water flows using high-definition images from HRSC, OMEGA, CaSSIS and MRO/CRISM, performing identification and interpretation of morphological evidence associated with fluvial-marine environments (Bhardwaj+2021).
How to cite: Machado, P., Bernardo, L., Encarnação, M., Brasil, F., Eira, H., Rodrigues, F., and Caetano, E.: Follow the Water... on Mars, Europlanet Science Congress 2024, Berlin, Germany, 8–13 Sep 2024, EPSC2024-330, https://doi.org/10.5194/epsc2024-330, 2024.
Introduction. Visible and near-infrared observations of Mars have revealed a wide range of primary and secondary alteration minerals. Hydrated minerals were first identified from orbit with the Observatoire pour la Minéralogie, l’Eau, les Glaces, et l’Activité (OMEGA) instrument. OMEGA data were used to produce global maps of aqueous minerals [1], including the polar regions [5], in particular the northern one [2]. Recently, the Mars Orbital Catalog of Aqueous Alteration Signatures project [3] including OMEGA observations and data from the Compact Reconnaissance Imaging Spectrometer for Mars (CRISM) produced a set of the more accurate and resolved maps of aqueous minerals at latitudes ranging from 70°S to 70°N. However, no recent systematic study of the distribution and nature of the aqueous composition has been carried out in the south polar regions. OMEGA observations highlighted spectral variability of the Martian high latitude surfaces [5, 4]. In particular, the 1.9 µm and 3 µm band depths increase from 60° latitudes towards the poles [1, 5], which suggests that hydrated minerals may participate in this spectral variability. [4] indeed reported the detection of a deep and relatively narrow absorption band at 3 µm coupled with a shallow but significantly wider 4 µm feature in the northern high latitudes of Mars. This feature may be related to sulfates and has no significant counterpart in the south for now. Moreover, the 1.9 µm band is significantly broader and shifts to slightly longer wavelengths in the south polar region which seems to indicate a specific mineralogy, and/or a different hydration state from that of the north [5]. Here we present a spectral analysis and the detection of hydrated minerals in the south polar region.
Method. OMEGA has been observing the Martian surface since 2004 between 0.35 and 5.1 µm. Here, we selected observations acquired during southern spring and summer as high latitudes are covered by seasonal ice during winter. OMEGA data have been processed using the OMEGA-Py Python module [8]. Our analyses focus on the detection and characterization of hydrated minerals using several spectral criteria previously defined: the band depths (BD) at 1.9 µm [4], 2.1 µm [6] and 2.4 µm [4]; the narrow and wide 3 µm band depths [4] and the SINDEX [6]. We have developed a new estimator adapted to the broader and shifted 1.9 band observed in the southern high latitudes, called here the “wide 2 µm band depth (WBD)”. This criterion estimates the band depth centered at 2 µm using the average continuum from 1.75 to 1.85 µm and 2.20 to 2.30 µm. Since the 3 µm band is very sensitive to the presence of water ice at the surface or in the atmosphere [7], we remove pixels with a water ice absorption at 1.5 µm>1%. In order to prevent possible effects related to viewing geometry, we removed pixels with emergence and incidence angles respectively higher than 10° and 75°. We then isolate detections of sulfate-bearing units thanks to a combination of four of these spectral criteria: the BD at 1.9, 2.1 and 2.4 µm and the SINDEX.
Results. The spatial distribution of all the spectral criteria over the whole OMEGA dataset in the south polar region have been investigated. All the criteria exhibit a strong variability in this region. The narrow 3 μm BD identified for the first time by [4] in the north polar region shows a different behavior in the south polar region. This spectral parameter varies mainly from 0 to 10% in the southern polar region while it increases to more than 30% in the northern polar region. The WBD at 2 µm is present at all longitudes between 50°S and 90°S and varies from 1% to 6% (Fig 1). The wide 3 μm BD is almost always higher than 35% and increases over 65% in this region. The WBD at 2 µm and the WBD at 3 µm increase with latitude toward the south pole (Fig 1). In addition to latitudinal variations, the WBD at 2 µm exhibits seasonal variations and decreases over the summer. The map of hydrated minerals detections in the south polar region (Fig 2) shows a high concentration of sulfate-bearing units around the polar cap. High-resolution CRISM observations obtained over this unit confirm that the spectral signatures can be confidently attributed to sulfates.
Perspectives. The spectral signatures between the sulfate detections presented here and the sulfates in Meridiani Planum are different especially around 3 μm which may indicate different sulfates compositions and/or different mixings with other minerals. Such differences may provide clues about the specific sulfates formation and transformation pathways expected at high latitudes. The ring-like structure of the south polar sulfates suggest a formation associated with seasonal frost and/or polar ice cap. The absence of the narrow 3 μm band depth around the south pole differentiate the two Martian poles in term of spectral variations. Further study of the spectral signatures and comparison with geological maps is in progress, and will help constrain the scenario for the formation of these hydrated minerals in the South Polar region.
References
[1] Poulet et al., (2007). JGR: Planets, 112(E8). [2] Langevin et al., (2005). Science, 307, 5715. [3] Carter et al., (2023). Icarus, 389, 115164. [4] Stcherbinine et al., Icarus, 369, 114627 (2021). [5] Poulet et al., GRL, 35(20) (2008). [6] Viviano-Beck et al., JGR:Planets, 119(6), 1403-1431(2014). [7] Jouglet et al., JGR:Planets 112.E8 (2007). [8] Stcherbinine (2023). Zenodo, doi:10.5281/zenodo.10035061
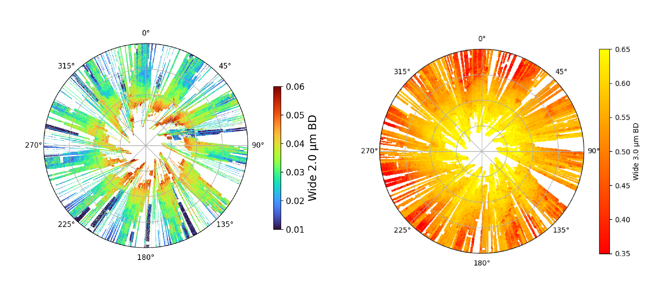
Figure 1: Composite maps of 833 OMEGA observations in the south polar region of Mars. Solar longitude of the observations ranges from 260° to 340°, corresponding to late southern spring and southern summer. Color codes shows the spectral variations of the wide 2 µm band depth (left) and the wide 3 µm band depth (right).
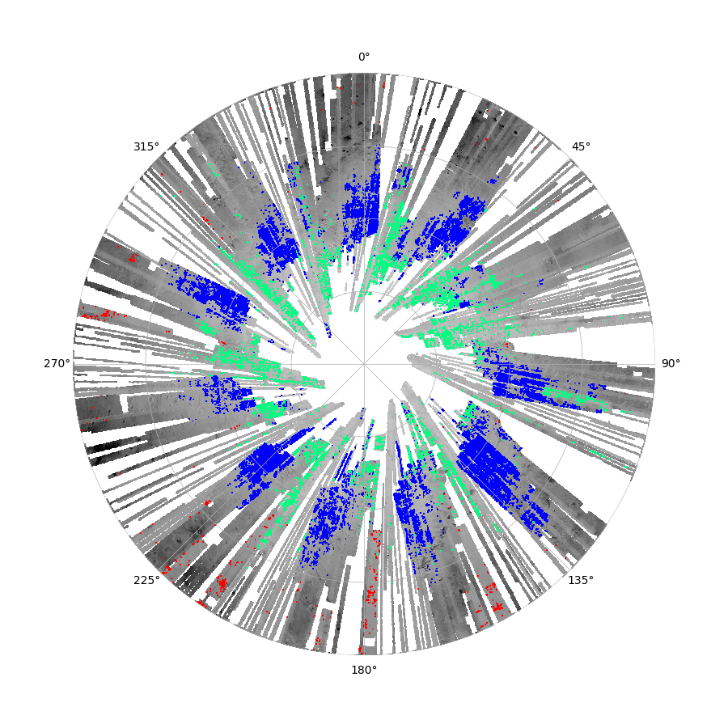
Figure 2: Map of hydrated mineral detections in the south polar region of Mars (50°S-90°S). Pixels in blue represents monohydrated sulfates detection, in green polyhydrated sulfates detection and pixels in red are phyllosilicates detection. Based map is the wide 3 µm band depth.
How to cite: Barraud, O., Carter, J., Vincendon, M., Stcherbinine, A., and Sheppard, R.: Spectral variability in the south polar region of Mars, Europlanet Science Congress 2024, Berlin, Germany, 8–13 Sep 2024, EPSC2024-921, https://doi.org/10.5194/epsc2024-921, 2024.
The Curiosity rover of the Mars Science Laboratory mission is exploring Gale crater on Mars since August 2012 [Vasavada2022]. On board, the ChemCam instrument [Wiens2012, Maurice2012] combines Laser-Induced Breakdown Spectroscopy (LIBS), passive spectroscopy and imaging.
ChemCam is a remote sensing instrument, assessing the chemical composition of rocks and soils up to a few meters from the rover, imaging outcrops at longer distances, and surveying the atmospheric variability. The chemistry of primary and secondary phases is obtained using LIBS by performing typically five point rasters on the martian targets. Each point is investigated with 30 laser shots. This technique can therefore highlight some elemental correlations [Rammelkamp2024], or even some depth variations (<1mm) [Maurice2016]. As of Sol 4183 (martian days), ChemCam has acquired thousands (32,776) LIBS observation points (Fig. 1), revealing the chemostratigraphy of the central mound, Aeolis Mons, in Gale crater, as the rover continues its ascent. More than 41,000 passive spectra and 23,700 images were also collected with ChemCam.

Figure 1: Cumulative number of LIBS points ordered in time, plotted as a function of the rover elevation in the different geologic formations.
One of the main reasons for selecting Gale Crater as the landing site was the orbital observations of hydrated clay minerals on the most basal layers of Aeolis Mons, overlain by hydrated sulfates up-section. This succession of mineral signatures is hypothesized to be a feature of the global-scale climate change that Mars has encountered [Grotzinger2015]. The rover explored the transition between the clay-bearing unit and the sulfate-bearing unit, since Sol 3072 at the Mount Mercou outcrop, and extended up to Sol 3655, in the Marker Band Valley [Edgar2024]. As part of its fourth extended mission, Curiosity’s payload is being used to characterize the salt minerals detected in this unit, seek their origins, and test the hypothesis of a link with the global evolution towards an arid climate [Fraeman2021].
The transition zone can be characterized in different ways. From the point of view of sedimentary facies, it is a transition from lacustrine deposits to eolian deposits [Edgar2024]. From a mineralogical point of view, this zone is characterized by the disappearance of clays (evidence of the presence of liquid water on the surface), in favor of sulfates associated with a more arid environment [Rampe2023]. However, before being found in the bedrock, these sulfates were concentrated in abundant secondary phases (nodules, veins) associated with fluid circulations. ChemCam showed that these sulfates were mainly Mg-rich sulfates [Frydenvang2024, Rapin2024]. On the other hand, Ca sulfates are found mainly in the bedrock even though they have also been observed in nodules. This illustrates the complex interactions between primary deposits, their alteration and later diagenetic phenomena when attempting to reconstruct the history of this transitional period. The observations of centimetric polygonal structures in this area, due to their fragility, has led to the suggestion of a relatively rapid repeated succession between wet and arid phases. Multiple climate transitions [Kite2024] or cyclic climatic variations [Rapin2023] would have implications for exobiology research strategies at the boundary between the Noachian and Hesperian epochs, as the rapid and prolonged succession of wet and dry environments could be conducive to the polymerization of organic molecules in a pre-biotic chemistry. In line with these implications, ChemCam has detected much more apparent halite in this transition zone, with unusual facies compared to previous ones [Meslin2024].
Other intriguing zones have been traversed, such as the Amapari Marker Band, which evokes an unexpected coastline interrupting the otherwise arid depositional environment. All in all, water seems to have played a more important role than expected in this unit, with potential implications for its habitability. For example, ChemCam has detected chemical correlations between Mn and Fe contents, and both are enriched compared to average. In some cases, Zn is also elevated, along with Cu [Gasda2024].
In the overlying sulfate-bearing unit, where the rover is now, alternating light- and dark-toned bands are identified from orbit [Sheppard2021]. From its in situ vantage point, rover observations suggest that distinct dark-toned horizons are found predominantly in the orbitally defined dark-toned bands. Geochemical data from ChemCam on these dark-toned horizons (Fig. 2) reveal they are enriched in fluorite [Forni2024], as well as Na-Mg sulfate phase [Hughes2024]. These observations are unique, and along with the observation of siderite [Tutolo2024], suggest complex brine systems possibly at high temperatures [Forni2024].

Figure 2: Chemistry from a dark-toned horizon (Tenderfoot_Peak_ccam, red points) and light-toned bedrock (Muro_Blanco, blue points) are highlighted, indicating presence of Na-Mg-sulfates in dark material, Mg-sulfates in light material, and broad contributions from Ca-sulfates and Mg-sulfates to the regional geochemistry. Geochemical data from ChemCam in the Sulfate Unit (sols 3949 – 4107). Background MastCam image credits: NASA/JPL-Caltech/MSSS.
The acquisitions of long-distance ChemCam images of the Gediz Vallis ridge show a clast-supported outcrop consisting of blocks with a wide range of textures, colors (provided by MastCam [Bell2017]), and geomorphological signatures. While still under discussion, this could be interpreted as a rock avalanche [Dietrich2024].
References: Bell et al. (2017) Earth and Space Science, 4 (7); Dietrich et al. (2024) 10th Int. Conf. Mars ; Edgar et al. (2024) LPSC, #1016. Forni et al. (2024) 10th Int. Conf. Mars ; Fraeman et al. (2021) Mars Geological Enigmas, Chapter 1 ; Frydenvang et al. (2024) 10th Int. Conf. Mars ; Gasda et al. (2024) 10th Int. Conf. Mars ; Grotzinger et al. (2015) Science, 350 (6257) ; Hughes et al. (2024) LPSC, #2288 ; Kite and Conway (2024) Nature Geoscience 17 (1); Maurice et al. (2012) Space Sci. Rev, 170; Maurice et al. (2016) J. Anal. Atomic Spec., 31 (4); Meslin et al. (2024) 10th Int. Conf. Mars ; Rammelkamp et al. (2024) EPSC, #869; Rampe et al. (2023) LPSC, #1554; Rapin et al. (2023) Nature, 620 ; Rapin et al. (2024) 10th Int. Conf. Mars ; Sheppard et al. (2021) J. Geophys. Res., 126 (2) ; Tutolo et al. (2024) LPSC, #1564 ; Vasavada et al. (2022) Space Sci. Rev. 218; Wiens et al. (2012) Space Sci. Rev., 170.
How to cite: Gasnault, O., Schroeder, S., Cousin, A., Frydenvang, J., Hughes, E., Dehouck, E., Rammelkamp, K., Johnson, J., Rapin, W., Lanza, N., Wiens, R. C., and Maurice, S. and the ChemCam science team: Exploring the sulfate-bearing unit: Recent ChemCam results at Gale crater, Mars, Europlanet Science Congress 2024, Berlin, Germany, 8–13 Sep 2024, EPSC2024-1095, https://doi.org/10.5194/epsc2024-1095, 2024.
Introduction: Following the finalisation of ESA’s European Explore2040 strategy [1], which describes the Agency’s vision for establishing an uninterrupted, responsible human and robotic exploration of the Solar System, ESA has prepared an implementation plan which proposes how to translate the strategy into a set of implementable scenarios and options for the future. The implementation plan relies on a stepwise approach and synergies between exploration destinations with a 20-year outlook, in order to offer an achievable and affordable execution of European exploration activities. Continued access to Mars is a crucial piece for the implementation of the Explore2040 strategy: for Mars, ESA expects to enable excellence in science outcomes, to bring about technological innovation, and to generate wider socio-economic benefits.
Mars Exploration Service Capabilities: Three key service capabilities have been identified as enabling for lower cost of future missions, for offering missions of opportunity, and for increasing access to Mars. These service capabilities are: (1) propulsive transfer services; (2) communications and navigations services; and (3) heavy and precise landing services. The implementation plan forsees the build-up up of the services over time to ensure a manageable cost profile.
- Propulsive transfer services: a propulsive tug capability that can transfer one or more passenger spacecraft to Mars should create many more opportunities for access to Mars than has previously been the case.
- Communications and navigation services: a predefined orbital communication and navigation service allows future Mars landers and orbiters to maximise scientific data return from early stages of mission design and planning while reducing their own on-board telecommunication systems.
- Heavy and precise landing services: a capability for landing increasingly heavy and more precise Mars landers prepares the way for heavy cargo and increased science data return from the Mars surface for ESA missions.
Exploration science: The Explore2040 strategy roadmap will aim to incrementally build-up the scientific knowledge required for deep space exploration by humans, carefully balancing exploration-focused science and exploration-enabled science objectives in a synergistic framework that fosters discovery while underpinning and driving new technology developments.
Mission Studies: A Phase A/B1 mission study will be initiated in 2024, to define the first mission on the Mars Exploration implementation roadmap: a propulsive tug service and its first passenger spacecraft. The propulsive tug will transfer its passenger spacecraft to a low Mars orbit and then return to a higher Mars orbit where it will spend the remainder of its lifetime as a communication and navigation infrastructure node that also provides full Mars disk visibility to a suite of scientific instruments on board. The first mission is planned to embark a passenger spacecraft with a high-resolution imager as its primary instrument. High-resolution mapping of potential landing sites will enable future high-precision and pinpoint landing on the surface of Mars. ESA expects to establish standards for the communication and navigation elements in the near term, evolving from existing stakeholder agreements that have been established for lunar exploration.
Future orbital missions as described above will alternate with a programme of increasingly heavy and precise landed missions. Precursor ESA internal studies have also begun to define the scope of these missions.
Concepts described in this paper are pre-decisional and for planning purposes only.
Acknowledgments: The ESTEC Concurrent Design Facility (CDF) is a state-of-the-art facility that enables a fast and effective interaction between experts. It is primarily used to assess the technical and financial feasibility of future space missions and new spacecraft concepts.
Reference:
[1] ESA Explore2040 Strategy (not yet public at time of abstract)
How to cite: Haldemann, A., Parfitt, C., Kminek, G., and Sutherland, O.: European Space Agency Mars Exploration Future Planning, Europlanet Science Congress 2024, Berlin, Germany, 8–13 Sep 2024, EPSC2024-476, https://doi.org/10.5194/epsc2024-476, 2024.
In development by ASI, CSA, JAXA, and NASA (the Italian, Canadian, Japanese, and U.S space agencies, respectively), the International Mars Ice Mapper (I-MIM) mission concept (phase 2) includes two complementary goals and five cross-cutting objectives:
Goal 1: Map and characterize accessible, near-surface (within the uppermost 10 m) water ice and its overburden in mid-to-low latitudes to support planning for the first potential human surface missions to Mars.
Goal 2: Analyze evidence of ice-related subsurface, surface, and atmospheric interactions planetwide and their relation to geological and climatological processes and potential habitable environments on Mars.
Drawn from findings of the competitively selected, international, multidisciplinary I-MIM Measurement Definition Team (MDT), the mission objectives provide traceability to the two mission goals:
- Water Ice. Identify the presence or absence of near-surface water ice, measure its depth and abundance, and map its distribution.
- Overburden. Constrain the structure, stratigraphy, roughness, and compactness of near-surface lithic material.
- Candidate Sites. Assess the scientific and engineering suitability of candidate sites for future robotic and human exploration requiring access to near-surface water ice.
- Planetary Evolution. Investigate Mars’ past and present environmental processes and implications for habitability through its geological and atmospheric record.
- Volatiles. Characterize the role of atmospheric structure and dynamics in the exchange of volatiles amongst the Martian subsurface, surface, and atmosphere.
These scientific objectives guide the design and development of I-MIM’s proposed instrument suite:
- a Synthetic Aperture Radar (SAR), centered at 930 MHz (the mission concept’s anchor payload provided by CSA);
- a Very High Frequency (VHF) sounder provided by ASI;
- a High-resolution Imager provided by NASA; and,
- a Submillimeter Sounder provided by JAXA.
These instruments are based on the MDT Final Report (2022) [1], which concluded that augmenting the mission concept’s anchor payload with the above complementary instruments would provide the opportunity to accomplish unique new science covering a broad range of international science priorities. Mapping the unstudied near surface of Mars thanks to the synergic observations L-band SAR and the VHF Sounder, augmented by the High-resolution Imager, has the potential to fill a major data gap unmet by prior instruments sent to Mars and provide a broad evaluation of the abundance of water-ice reservoirs at mid latitudes. The addition of the submillimeter sounder enables atmospheric profiling for studies of volatiles exchanges among the subsurface, surface, and atmosphere, as well as wind profiles, another major data gap of high priority to the science community.
When combined, these complementary instruments have the potential to address high-priority scientific investigations shared by the international science community:
Climatology: In order to characterize variability in the ionosphere, both the SAR and the submillimeter sounder further address key questions about the connections in Mars’s dynamic climate regions and seasonal interactions of shallow subsurface volatiles with the atmospheric structure, of critical importance to both science and human-robotic mission planning.
Geology: A VHF sounder would provide depth resolution and penetration that bridges a critical gap between the core payload and current sounders at Mars. A high-resolution imager would provide key information on surface geomorphology at spatial scales that complement the capability of the core payload and would have capability, in concert with context information potentially provided by a supplemental imaging spectrometer, to constrain present day cratering rates.
Habitability: In the context of international Moon to Mars objectives, the MDT work showed that I-MIM would provide important advances toward outstanding ancient and modern habitability questions related to astrobiology.
Human Exploration: by providing critical precursor data (e.g., characterizing the presence and seasonal variabilities of liquid brines, subsurface void detection, and environmental characterizations for designing planetary-protection and human-health safeguards) relevant to future human-robotic missions dedicated to the search for life.
With science priorities and potential identified, the partner agencies are considering these recommendations in their ongoing multilateral concept study, intending to generate a viable mission architecture that maximizes the scientific return to the greatest extent possible. The four agencies view the multilateral approach as a way of achieving “big science” for the individual agency cost of a small mission. The mission concept’s new models of multilateral governance pave the way to future international collaborations related to both human and robotic exploration, in pursuit of shared scientific outcomes relevant to Mars, and by extension, to planetary systems in our solar system and around other stars.
References: [1] I-MIM MDT Final Report (2022) 239 pp., online: https://science.nasa.gov/researchers/ice-mapper-measurement-definition-team.
How to cite: Ammannito, E., Amoroso, M., Flamini, E., Viotti, M. A., Mugnuolo, R., Haltigin, T., Boulais, E., Lafrance, S., Usui, T., Hollibaugh Baker, D. M., Davis, R. M., Kelley, M. S., and Collom, R. B.: International Mars Ice Mapper Mission: The combined scientific potential of Synthetic Aperture Radar, Very High Frequency (VHF) Sounding, Submillimeter Sounding, and High-Resolution Imaging for Climatology, Geology, Habitability and Human Exploration, Europlanet Science Congress 2024, Berlin, Germany, 8–13 Sep 2024, EPSC2024-1074, https://doi.org/10.5194/epsc2024-1074, 2024.
Mars Express
More than two decades after its launch in June 2003, Mars Express remains a dependable, highly productive and innovative mission.
Recent science highlights include (1) continued mapping of subsurface reflectors beneath the south polar layered ice deposits, and associated work to explain the cause of these reflections; (2) a global map of minerals on Mars with 200 m/px resolution, obtained from analysis of infrared spectra; (3) release of 50 m resolution Digital Elevation Models based on HRSC stereo topography for quadrangles covering an ever-increasing proportion of the global surface; (4) a global climatology of ozone and water from both nadir and occultation observations and its relation to atmospheric dust; (5) transient atmospheric phenomena, such as a recurrent orographic cloud feature at Arsia Mons; (6) detailed investigation of the ionospheric structure, its variability, and coupling to the lower atmosphere; (7) continued monitoring of both the upstream solar wind conditions and of downstream escaping ions; (8) detailed study of Phobos during flybys at altitudes as low as 50 km.
Spacecraft and instrument teams continue to implement new and improved observation modes. One example is new MARSIS instrument software which now allows raw data to be returned from much longer subsurface sounding passes, improving the search for basal reflectors beneath polar ice caps; another example is mutual radio occultation observations between Mars Express and ExoMars Trace Gas Orbiter, potentially providing vertical profiles of ionospheric electron content with good spatial and temporal coverage.
ExoMars Trace Gas Orbiter
TGO has now completed almost three full Mars years since reaching its science orbit in April 2018.
Highlights include (1) continuing non-detection of methane, with upper limits as low as 20 ppt by volume. Reconciling this continued non-detection by TGO with the background levels of several hundred ppt in Gale crater by MSL remains an enigma, stimulating further research. (2) detection of HCl, the first reported halogen-containing species in the atmosphere of Mars. (3) further detail of the transport of water to high altitudes, a critical step in the escape of water from Mars. and (4) continued acquisition of 5 m colour imagery and digital elevation models over a wide range of terrain and target types, including landing site characterization.
Funding for extending both missions was recently secured and is currently in place until end 2026 (Mars Express) and end 2025 (Trace Gas Orbiter).
How to cite: Wilson, C.: Mars Express and ExoMars Trace Gas Orbtiter - mission status & science highlights, Europlanet Science Congress 2024, Berlin, Germany, 8–13 Sep 2024, EPSC2024-1045, https://doi.org/10.5194/epsc2024-1045, 2024.
On 21st April 2018, the ExoMars Trace Gas Orbiter began its nominal science phase [1]. Since then, for the last 6 and a half years, the NOMAD instrument has taken more than a 100 million spectra in the ultra-violet, visible and infrared.
NOMAD, or “Nadir and Occultation for MArs Discovery”, is a suite of three spectrometers: two operate in the infrared and one operates in the 200-650nm range. Of the two infrared spectrometers, “SO” is designed primarily for solar occultation observations; and “LNO” is primarily designed for nadir observations but can also operate in solar occultation and limb modes [2], and measure Phobos. The ultraviolet-visible spectrometer can do all the above: solar occultation, limb, nadir, and Phobos and Deimos observations [3].
The very high resolving power of the infrared SO and LNO spectrometers (~17000 and ~10000 respectively [4]) mean that they are well suited for measuring atmospheric absorption lines, and are therefore able to measure clouds [5], dust [6], H2O [7], [8], CO [9], [10], CO2 (for temperature and pressure)[11], [12] and HCl [13] in solar occultation mode, plus their isotopes such as HDO [14] and H37CL [15]. SO spectra can also be used to put upper limits on trace gases that are not detected, such as CH4 [16] and HF. In nadir, LNO is primarily measuring H2O [17] and CO [18] in the atmosphere and the albedo/composition of the surface [19], [20]. Work is being done the constrain the potential 2.7µm hydration band in Phobos spectra.
The ultraviolet-visible spectrometer, “UVIS”, measures O3 and dust/aerosols in both solar occultation [21] and nadir modes [22], in addition to Phobos and Deimos [23]. Of particular note is the ongoing work to observe the limb of Mars during both the day and night, to measure the various airglow emission lines present in the limb spectra [24], [25], [26], [27].
Also, calibration efforts are continually ongoing to improve detection limits and retrieval accuracies.
In this presentation we will show the latest results from NOMAD, and describe how scientists outside the NOMAD team can also access all the latest data generated by the instrument.
References
[1] A. C. Vandaele et al., ‘Science objectives and performances of NOMAD’, PSS, 2015, doi: 10.1016/j.pss.2015.10.003.
[2] E. Neefs et al., ‘NOMAD spectrometer on the ExoMars trace gas orbiter mission: part 1—design, manufacturing and testing of the infrared channels’, Appl. Opt., 2015, doi: 10.1364/AO.54.008494.
[3] M. R. Patel et al., ‘NOMAD spectrometer on the ExoMars trace gas orbiter mission: part 2—design, manufacturing, and testing of the ultraviolet and visible channel’, Appl. Opt., 2017, doi: 10.1364/AO.56.002771.
[4] G. Liuzzi et al., ‘Methane on Mars: New insights into the sensitivity of CH4 with the NOMAD/ExoMars spectrometer through its first in-flight calibration’, Icarus, 2019, doi: 10.1016/j.icarus.2018.09.021.
[5] G. Liuzzi et al., ‘First Detection and Thermal Characterization of Terminator CO 2 Ice Clouds With ExoMars/NOMAD’, GRL, 2021, doi: 10.1029/2021GL095895.
[6] A. Stolzenbach et al., ‘Martian Atmospheric Aerosols Composition and Distribution Retrievals During the First Martian Year of NOMAD/TGO Solar Occultation Measurements’, JGR Planets, 2023, doi: 10.1029/2022JE007276.
[7] S. Aoki et al., ‘Global Vertical Distribution of Water Vapor on Mars: Results From 3.5 Years of ExoMars‐TGO/NOMAD Science Operations’, JGR Planets, 2022, doi: 10.1029/2022JE007231.
[8] A. Brines et al., ‘Water Vapor Vertical Distribution on Mars During Perihelion Season of MY 34 and MY 35 With ExoMars‐TGO/NOMAD Observations’, JGR Planets, 2023, doi: 10.1029/2022JE007273.
[9] N. Yoshida et al., ‘Variations in Vertical CO/CO 2 Profiles in the Martian Mesosphere and Lower Thermosphere Measured by the ExoMars TGO/NOMAD: Implications of Variations in Eddy Diffusion Coefficient’, GRL, 2022, doi: 10.1029/2022GL098485.
[10] A. Modak et al., ‘Retrieval of Martian Atmospheric CO Vertical Profiles From NOMAD Observations During the First Year of TGO Operations’, JGR Planets, 2023, doi: 10.1029/2022JE007282.
[11] M. A. López‐Valverde et al., ‘Martian Atmospheric Temperature and Density Profiles During the First Year of NOMAD/TGO Solar Occultation Measurements’, JGR Planets, 2023, doi: 10.1029/2022JE007278.
[12] L. Trompet et al., ‘Carbon Dioxide Retrievals From NOMAD‐SO on ESA’s ExoMars Trace Gas Orbiter and Temperature Profile Retrievals With the Hydrostatic Equilibrium Equation’, JGR Planets, 2023, doi: 10.1029/2022JE007279.
[13] S. Aoki et al., ‘Annual Appearance of Hydrogen Chloride on Mars and a Striking Similarity With the Water Vapor Vertical Distribution Observed by TGO/NOMAD’, GRL, 2021, doi: 10.1029/2021GL092506.
[14] G. L. Villanueva et al., ‘The Deuterium Isotopic Ratio of Water Released From the Martian Caps as Measured With TGO/NOMAD’, GRL, 2022, doi: 10.1029/2022GL098161.
[15] G. Liuzzi et al., ‘Probing the Atmospheric Cl Isotopic Ratio on Mars: Implications for Planetary Evolution and Atmospheric Chemistry’, GRL, 2021, doi: 10.1029/2021GL092650.
[16] E. W. Knutsen et al., ‘Comprehensive investigation of Mars methane and organics with ExoMars/NOMAD’, Icarus, 2021, doi: 10.1016/j.icarus.2020.114266.
[17] M. M. J. Crismani et al., ‘A Global and Seasonal Perspective of Martian Water Vapor From ExoMars/NOMAD’, JGR Planets, 2021, doi: 10.1029/2021JE006878.
[18] M. D. Smith et al., ‘The climatology of carbon monoxide on Mars as observed by NOMAD nadir-geometry observations’, Icarus, 2021, doi: 10.1016/j.icarus.2021.114404.
[19] L. Ruiz Lozano et al., ‘Observation of the Southern Polar cap during MY34-36 with ExoMars-TGO NOMAD LNO’, Icarus, 2024, doi: 10.1016/j.icarus.2023.115698.
[20] F. Oliva et al., ‘Martian CO2 Ice Observation at High Spectral Resolution With ExoMars/TGO NOMAD’, JGR Planets, 2022, doi: 10.1029/2021JE007083.
[21] M. R. Patel et al., ‘ExoMars TGO/NOMAD-UVIS Vertical Profiles of Ozone: 1. Seasonal Variation and Comparison to Water’, JGR Planets, 2021, doi: 10.1029/2021JE006837.
[22] J. P. Mason et al., ‘Climatology and Diurnal Variation of Ozone Column Abundances for 2.5 Mars Years as Measured by the NOMAD-UVIS Spectrometer’, JGR Planets, 2024, doi: 10.1029/2023JE008270.
[23] J. P. Mason et al., ‘Ultraviolet and Visible Reflectance Spectra of Phobos and Deimos as Measured by the ExoMars‐TGO/NOMAD‐UVIS Spectrometer’, JGR Planets, 2023, doi: 10.1029/2023JE008002.
[24] J.-C. Gérard et al., ‘Detection of green line emission in the dayside atmosphere of Mars from NOMAD-TGO observations’, Nat Astron, 2020, doi: 10.1038/s41550-020-1123-2.
[25] J.-C. Gérard et al., ‘First Observation of the Oxygen 630 nm Emission in the Martian Dayglow’, GRL, 2021, doi: 10.1029/2020GL092334.
[26] J.-C. Gérard et al., ‘Observation of the Mars O2 visible nightglow by the NOMAD spectrometer onboard the Trace Gas Orbiter’, Nat Astron, 2024, doi: 10.1038/s41550-023-02104-8.
[27] L. Soret et al., ‘The Ultraviolet Martian Dayglow Observed With NOMAD/UVIS on ExoMars Trace Gas Orbiter’, JGR Planets, 2023, doi: 10.1029/2023JE007762.
How to cite: Thomas, I., Vandaele, A. C., Trompet, L., Aoki, S., Willame, Y., Piccialli, A., Flimon, Z., Daerden, F., Neary, L., Ristic, B., Mason, J., Robert, S., Viscardy, S., Erwin, J., Lopez Valverde, M. A., Patel, M., and Bellucci, G. and the The NOMAD Team: 6 Earth Years (3 Martian Years) of Mars Observations by NOMAD on ExoMars TGO, Europlanet Science Congress 2024, Berlin, Germany, 8–13 Sep 2024, EPSC2024-263, https://doi.org/10.5194/epsc2024-263, 2024.
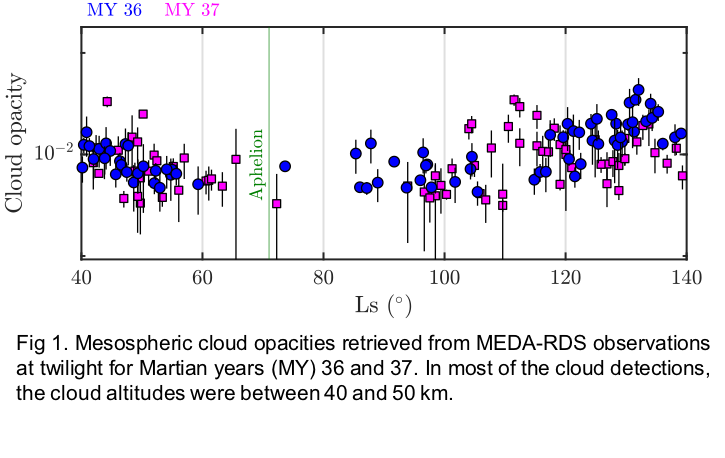
Clouds play a crucial role in the past and current climate of Mars. Cloud particles impact the planet's energy balance and atmospheric dynamics, as well as influence the vertical distribution of dust particles through dust scavenging. This process of dust scavenging by clouds has significant consequences for the planet's water cycle. For example, regions in the atmosphere with insufficient quantities of dust particles, or condensation nuclei, can inhibit the formation of H2O clouds, leading to the presence of water vapor in excess of saturation [1]. Recent observations made by the MEDA Radiation and Dust Sensor (RDS) [2,3] have shown a marked decline in mesospheric cloud activity (above 35-40 km) when Mars is near its aphelion (within the Aphelion Cloud Belt-ACB season), notably occurring during solar longitudes (Ls) between Ls 70° and 80° [4] (see Figure 1).
In order to investigate the possible factors leading to this decrease in water ice abundance, we used a one-dimensional cloud microphysical model [5,6], which includes the processes of nucleation, condensation, coagulation, evaporation, precipitation, and coalescence, and where the vertical mixing is parameterized using an eddy diffusion profile (Keddy). Combining cloud microphysics modeling with ground-based (Mars 2020 and InSight) and orbital observations (TGO and MRO) of clouds, water vapor, and temperature, we will discuss in this presentation the main factors controlling the water abundance in the Martian mesosphere during the ACB season.
References: [1] Maltagliati, Luca, et al. "Evidence of water vapor in excess of saturation in the atmosphere of Mars." science 333.6051 (2011): 1868-1871. [2] Apestigue, V., et al. “Radiation and Dust Sensor for Mars Environmental Dynamic Analyzer Onboard M2020 Rover”. Sensor 22.8 (2022): 2907. [3] Rodriguez-Manfredi, Jose Antonio, et al. “The Mars Enviromental Dynamics Analyzer, MEDA. Asuite of enviromental sensors for the Mars 2020 mission.” Space science reviews 217.3 (2021): 1-86. [4] Toledo, D., et al. “Measurement of aerosol optical depth and sub-visual cloud detection using the optical depth sensor (ODS)”. Atmospheric Measurement Techniques 9.2 (2016): 455-467. [5] Montmessin, F., Rannou, P., Cabane, M.: New insights into martian dust distribution and water-ice cloud microphysics. Journal of Geophysical Research: Planets 107(E6), 41 (2002). [6] Rannou, P., Montmessin, F., Hourdin, F., Lebonnois, S.: The latitudinal distribution of clouds on titan. science 311(5758), 201205 (2006).
How to cite: Toledo, D., Rannou, P., Apestigue, V., Rodriguez-Veloso, R., Arruego, I., Martinez, G., Tamppari, L., Munguira, A., Lorenz, R., Stcherbinine, A., Montmessin, F., Sanchez-Lavega, A., Patel, P., Smith, M., Lemmon, M., Vicente-Retortillo, A., Newman, C., Viudez-Moreiras, D., Hueso, R., and Bertrand, T. and the +4: Decline in Water Ice Abundance in the Martian Mesosphere during Aphelion, Europlanet Science Congress 2024, Berlin, Germany, 8–13 Sep 2024, EPSC2024-504, https://doi.org/10.5194/epsc2024-504, 2024.
The ExoMars Trace Gas Orbiter (TGO) was launched in 2016 and began science operations in April 2018. NOMAD (Nadir and Occultation for MArs Discovery) [1] is one of four instruments onboard, made up of three spectrometers built to probe the atmosphere and surface of Mars in the infrared and ultraviolet wavelengths using solar occultation, limb and nadir viewing geometries. The main objective is to characterize the composition and structure of the Martian atmosphere, including the seasonal trends of atmospheric gases, dust and clouds.
The GEM-Mars Global Circulation Model (GCM) [2,3,4,5] is a crucial part of the NOMAD mission, supporting the observational planning, data retrieval and interpretation of results. GEM-Mars is a multiscale grid-point model, representing the atmosphere from the surface up to around 150 km.
NOMAD infrared solar occultation observations provide an opportunity to look more closely at the thermal structure in the mesosphere and evaluate the model performance in this region. It is an important transition zone between the lower and upper atmosphere and can be influenced by aerosols, gravity waves and thermal tides so it is useful to perform a detailed analysis with the observations to help constrain the representation of these processes in the model. Initial comparisons of the model to data were performed in [6]. In this work, we expand on this comparison and look at model-simulated quantities such as aerosols, heating rates and impacts from gravity waves.
We will present an overview of the model and recent improvements, as well as an evaluation of model performance in the mesosphere using NOMAD solar occultation measurements. From this analysis, we will discuss ways to improve our simulations.
References
[1] Vandaele et al., 2018. NOMAD, an Integrated Suite of Three Spectrometers for the ExoMars Trace Gas Mission: Technical Description, Science Objectives and Expected Performance. Space Science Reviews 214. https://doi.org/10.1007/s11214-018-0517-2
[2] Neary and Daerden, 2018. The GEM-Mars general circulation model for Mars: Description and evaluation. Icarus 300, 458–476. https://doi.org/10.1016/j.icarus.2017.09.028
[3] Daerden et al., 2019. Mars atmospheric chemistry simulations with the GEM-Mars general circulation model. Icarus 326, 197–224. https://doi.org/10.1016/j.icarus.2019.02.030
[4] Neary et al., 2020. Explanation for the Increase in High-Altitude Water on Mars Observed by NOMAD During the 2018 Global Dust Storm. Geophysical Research Letters 47, e2019GL084354. https://doi.org/10.1029/2019GL084354
[5] Daerden et al. 2023. Heterogeneous Processes in the Atmosphere of Mars and Impact on H2O2 and O3 Abundances. Journal of Geophysical Research: Planets 128, e2023JE008014. https://doi.org/10.1029/2023JE008014
[6] Trompet et al., 2023. Carbon Dioxide Retrievals From NOMAD-SO on ESA’s ExoMars Trace Gas Orbiter and Temperature Profile Retrievals With the Hydrostatic Equilibrium Equation: 2. Temperature Variabilities in the Mesosphere at Mars Terminator. Journal of Geophysical Research: Planets 128, e2022JE007279. https://doi.org/10.1029/2022JE007279
How to cite: Neary, L., Trompet, L., Daerden, F., Thomas, I., and Vandaele, A. C.: A closer look at the Martian mesosphere with the GEM-Mars GCM: a comparison with ExoMars TGO/NOMAD temperatures, Europlanet Science Congress 2024, Berlin, Germany, 8–13 Sep 2024, EPSC2024-849, https://doi.org/10.5194/epsc2024-849, 2024.
Thanks to successful long-lasting missions (e.g. Mars Express) and the launch of new space missions (e.g. ExoMars), the amount of Mars’ atmosphere remote sensing observations currently available has significantly increased, allowing to study the planet in greater details than ever before. The methods used to analyze these space observations are generally based on iterative approaches, for which the radiative transfer is solved at each iteration and can become time-consuming when applied to large datasets. This has motivated us to try applying an alternative method developed for the detection and quantification of trace gases in the Earth’s atmosphere, and which will be presented. This detection method is based on the calculation of a spectrally integrated index, called “hyperspectral range index" (HRI), which represents the strength of the spectral signature of the targeted atmospheric species in a spectral range. The HRI yields a dimensionless scalar and is calculated as

with K the Jacobian of the target species, Sy a covariance matrix generated from a representative set of spectra that do not include the target species spectral signature, and ȳ the mean spectrum of the covariance matrix. In that context, Sy is a statistical characterization of the expected correlations between the spectral channels in the absence of the target species. The HRI can encompass broad spectral ranges to exploit all the channels in which the target species is absorbing, which results in a substantial gain of sensitivity over other detection methods and makes it suitable for the detection of broadband absorption features. As the HRI can lead to false detections in case of partial match between spectral signatures of the target species and an interference, a firm identification of the target species is needed to confirm its contribution to the HRI. To do so, a transformation, referred to as whitening, has been applied.
The method has been tested on nadir observations of the PFS (Planetary Fourier Spectrometer, Giuranna et al., 2021) instrument onboard Mars Express. The spectral range 350-500 cm-1has been exploited to calculate the H2O vapor HRI. The covariance matrix and its associated mean spectrum have been built using spectra recorded in regions known to be depleted in water vapor. Using these, the HRI has then been calculated for the entire PFS dataset. Seasonal distributions have been built (an example is shown on Figure 1 for the Martian Year 27) and will be discussed.
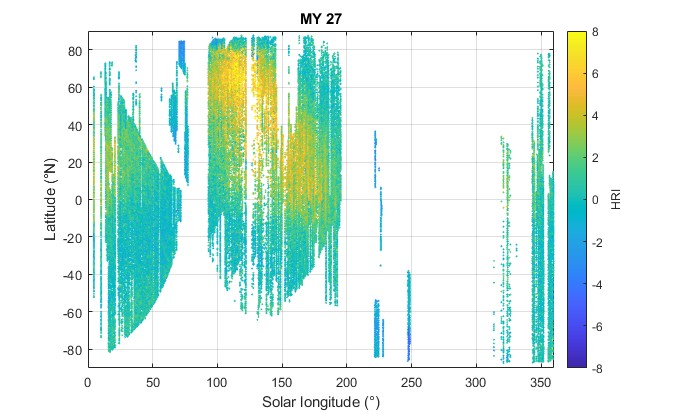
As the HRI value depends on the H2O abundance in Mars’ atmosphere, it is possible to convert it to an integrated column. For this, we have built an artificial feedforward neuronal network (NN) that will be presented. The use of a NN allows us to take into account the different parameters affecting the HRI value in addition to the water column, such as the temperature profile and the surface temperature. These parameters are included as input parameters of the NN. The NN has been trained with more than 200,000 forward-simulated PFS spectra with the line-by-line Atmosphit radiative-transfer code (Coheur et al., 2005) using PFS-L2 auxiliary data, which values are randomly selected to be fully representative of real Martian conditions. Still under analysis, the NN yields a target gas total column per single PFS measurement, for which the uncertainties are estimated by propagating the uncertainties associated with each input variable through the NN.
How to cite: Es-Sayeh, M., Bauduin, S., Clarisse, L., Franco, B., and Giuranna, M.: First Planetary Science Application of the Hyperspectral Range Index: Water Vapor as Observed by PFS/MarsExpress, Europlanet Science Congress 2024, Berlin, Germany, 8–13 Sep 2024, EPSC2024-1099, https://doi.org/10.5194/epsc2024-1099, 2024.
One of the main objectives of the ExoMars Trace Gas Orbiter (TGO) mission is to hunt for any gases that may be diagnostic of active geological of biogenic processes. Of key interest was methane (CH4) due to its link to biological production mechanisms on Earth. While this has so-far not been observed (Montmessin et al., 2021), the discovery of hydrogen chloride (HCl) was announced after the first full Martian year of observations (Korablev et al., 2021). Like CH4, HCl will photolyze readily in the Martian atmosphere and have a short lifetime, requiring an active source. One of the dominant sources on Earth is active volcanism, making its characterization a high priority for TGO.
HCl was discovered using data from the mid-infrared channel of the TGO’s Atmospheric Chemistry Suite (ACS MIR). This is a cross-dispersion spectrometer operating in solar occultation geometry. The instrument consists of a telescope and foreoptics, a primary echelle grating to access the mid-infrared spectral region, and a secondary diffraction grating to separate overlapping diffraction orders. The solar occultation method is self-calibrating, provides a very long optical path length, and very high signal-to-noise ratios.
It was quickly revealed that HCl was linked to water vapour and had its own seasonal cycle, possibly associated with dust activity (Korablev et al., 2021; Olsen et al., 2021). In this presentation, we will present the results of our work to further characterize HCl and explore its possible origins and seasonality. We present a direct comparison over altitude between the volume mixing ratios (VMR) of HCl with: the water vapour VMR, temperature, water ice extinction, and dust extinction. Water vapour is measured simultaneously with ACS MIR, temperature is measured simultaneously with the near-infrared channel of ACS (Fedorova et al., 2020; 2023), and aerosol extinctions are taken form co-located measurements made with the Mars Climate Sounder (MCS) on Mars Reconnaissance Orbiter (Kleinböhl et al., 2009; 2017).
Our results reveal that regardless of the photochemical origins of HCl, seasonal dust activity very strongly controls its behaviour. At the start of southern spring, dust is lifted into the atmosphere and warms the vertical extent over which dust is present. Temperature strongly controls water vapour, and HCl is tightly correlated with water vapour over altitude. We do not find direct evidence that the abundance of dust aerosols impacts the HCl VMR, but observed a pronounced difference between the altitude range where HCl (and water vapour) is present and where water ice forms (controlled by temperature).
We have explored, and will discuss, the likelihood of serval hypothesized HCl formation and destruction mechanisms. These include heterogeneous reaction on chloride-bearing dust aerosols, emissions from the surface, year-round atmospheric residence (low altitudes? alternative form of chloride?), the formation of perchlorate and surface deposition, and the adhesion of HCl on aerosol surfaces and eventual deposition.
References
Montmessin, F. et al. Astron. Astrophys. 650, A140 (2021). DOI:10.1051/0004-6361/202140389.
Korablev, O., Olsen, K. S. et al. Sci. Adv. 7, eabe4386 (2021). DOI:10.1126/sciadv.abe4386.
Olsen, K. S., et al. Astron. Astrophys. 647, A161 (2021). DOI:10.1051/0004-6361/202140329.
Fedorova, A. A., et al. Science 367, 297-300 (2020). DOI:10.1126/science.aay9522.
Fedorova, A. A., et al. J. Geophys. Res. 128, e2022JE007348 (2023). DOI:10.1029/2022JE007348.
Kleinböhl, A., et al. J. Geophys. Res., 114, E10006 (2009). DOI:10.1029/2009JE003358.
Kleinböhl, A., Friedson, A. J., & Schofield, J. T. J. Quant. Spectrosc. Radiat. Transfer. 187, 511-522 (2017). DOI:10.1016/j.jqsrt.2016.07.009.
How to cite: Olsen, K. S., Fedorova, A. A., Kass, D. M., Kleinböhl, A., Trokhimovskiy, A., Korablev, O. I., Montmessin, F., Lefèvre, F., Baggio, L., Alday, J., Belyaev, D. A., Holmes, J. A., Mason, J. P., Streeter, P. M., Rajendran, K., Patel, M. R., Patrakeev, A., and Shakun, A.: Relationships between HCl, H2O, aerosols, and temperature in the Martian atmosphere, Europlanet Science Congress 2024, Berlin, Germany, 8–13 Sep 2024, EPSC2024-912, https://doi.org/10.5194/epsc2024-912, 2024.
Introduction: We have currently accumulated over 25 years of continuous satellite data on Martian dust and, generally, on the weather of the Red Planet. By utilizing data from instruments operating in the thermal infrared such as the Thermal Emission Spectrometer (TES, onboard the Mars Global Surveyor satellite), Thermal Emission Imaging System (THEMIS, onboard Mars Odyssey), and Mars Climate Sounder (MCS, onboard the Mars Reconnaissance Orbiter), we have been able to reconstruct diurnal maps of column dust optical depth (CDOD) spanning more than 13 Martian years (MY) from 1999 to the present day [1, 2, 3, 4, 5]. Two types of maps exist: ‘gridded maps’ (the mesh is regular but values are missing where there are no observations) and ‘kriged maps’ (interpolated from the gridded maps using kriging to produce complete maps). These longitude-latitude maps are used as 'dust scenario' in the Mars Climate Database [6], among many other applications. They are routinely updated and made publicly available in NetCDF or FITS formats (see the links to the datasets in the acknowledgments section).
Recent developments: The daily CDOD maps covering MY 24 through part of MY 27 have been recently improved by using revised retrievals of column dust optical depths from TES observations (refer to the link in the acknowledgments section for accessing this updated dataset). The top four panels of Figure 1 (MY 24, 25, 26, 27) show zonal means of these improved CDOD maps normalized to 610 Pa (MY 27 zonal mean is actually a combination of revised TES-based maps and previous THEMIS-based maps).
The arrival of the Emirates Mars Mission (EMM) 'Hope' spacecraft in a low-inclination, high-altitude orbit around Mars has enabled simultaneous monitoring of the full disk of the Martian atmosphere. The CDOD retrievals from the Emirates Mars InfraRed Spectrometer (EMIRS) observations significantly enhance the quality of our dust maps, enabling for the first time quasi-continuous monitoring of storms over multiple local times [7]. The bottom two panels of Figure 1 show zonal means of, respectively, MCS-based maps and EMIRS-based maps for MY 36. Work is in progress to 1) understand the differences, and 2) integrate CDOD information from both MCS and EMIRS to produce combined daily maps.
Moreover, the availability of visible images from the EMM/Emirates Exploration Imager (EXI) on one side [8], and retrievals of CDOD in the visible from TES Emission Phase Function (EPF) observations on the other (refer to the link in the acknowledgments section for access to this novel dataset), enables cross-comparison and validation of the daily gridded dust maps with an unprecedented level of detail.
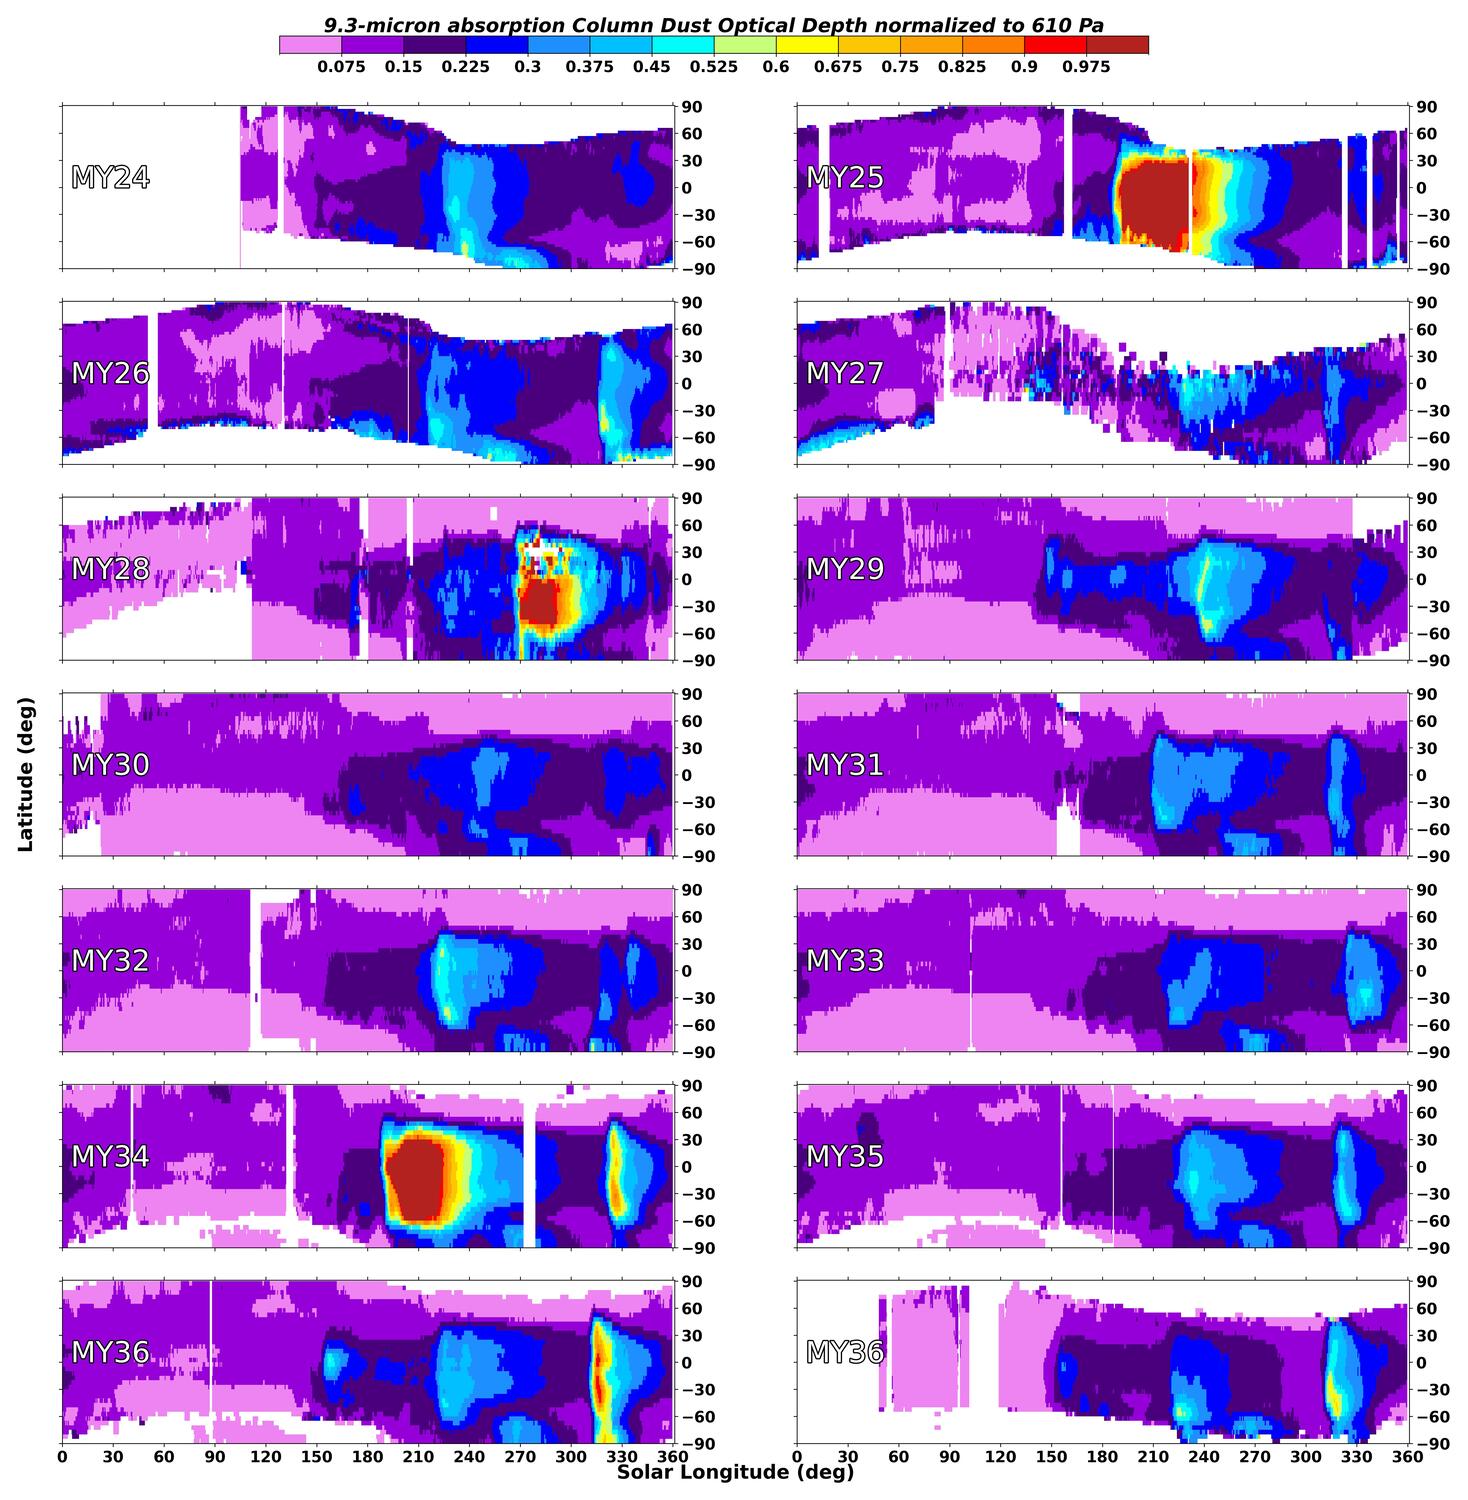
Figure 1: Zonal means of CDOD normalized to 610 Pa for 13 Martian years. The top four panels (MY 24, 25, 26, 27) show zonal means of improved maps using revised TES retrievals. The bottom two panels show zonal means of, respectively, MCS-based maps and EMIRS-based maps for MY 36.
Tracking of dust events: From the daily CDOD maps, it is possible to identify large-scale dust events (“storms”) reaching regional and planetary scales, follow their evolution, and create statistics of their main characteristics such as trajectory, area, and optical depth (see an example in Figures 2 to 5). A new development in progress is the identification and tracking of large-scale dust events using unsupervised machine learning algorithms [9].
A key outcome of this work is the production of a catalog of historic large-scale dust events, which can be routinely updated with new events as new dust maps become available. An important aspect of creating a catalog of dust events is the precise determination of their occurring time. While a Mars calendar based on solar longitude works for many applications, it does not work well for daily maps produced at a discrete number of sols per year. Therefore, we choose to use a sol-based calendar as described in [1, Appendix A]. Each Martian year has either 669 or 668 sols, following a 5-year cycle. The beginning and end of a year is always at midnight at the prime meridian, hence a new year in our sol-based calendar does not necessarily start at LS=0° (see Figure 6).
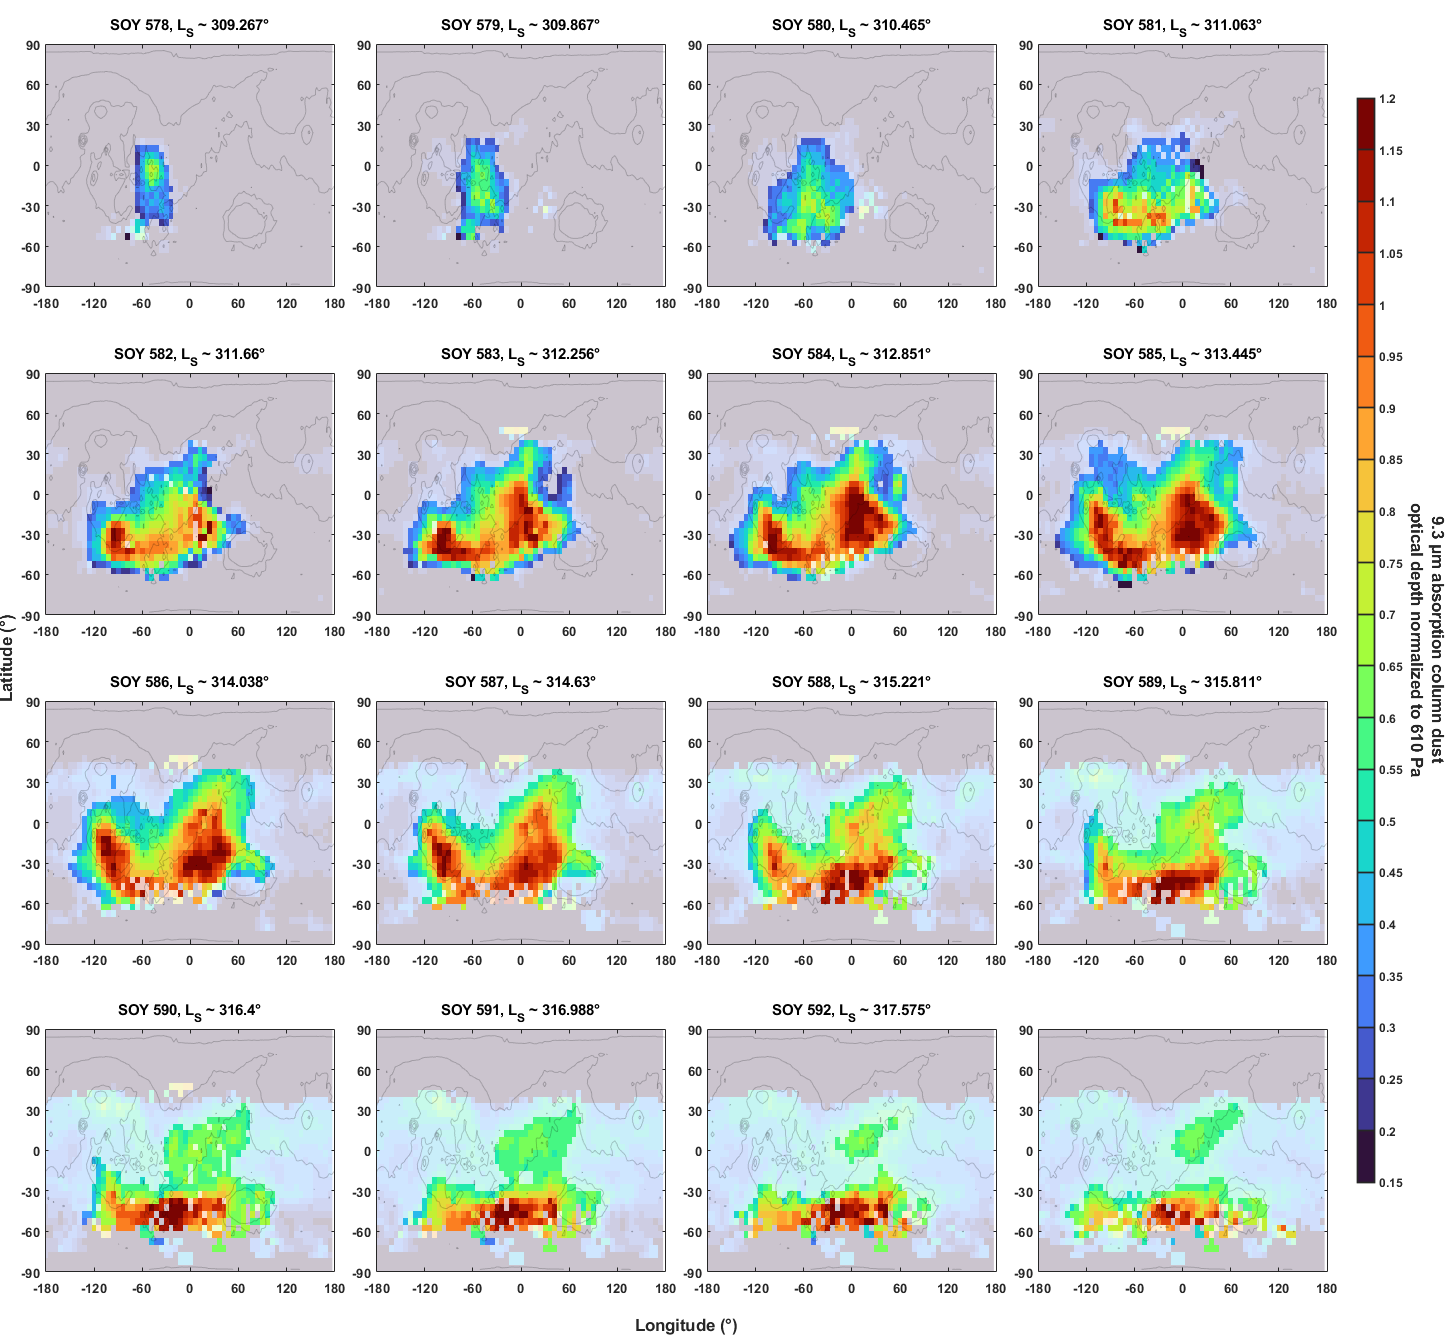
Figure 2: Sol-by-sol identification and tracking of the evolution of a dust sequence (“storm”) in MY 36 between LS=309° and LS=318° from daily EMIRS-based CDOD maps normalized to 610 Pa. The rest of the daily maps is visible in the transparent background.
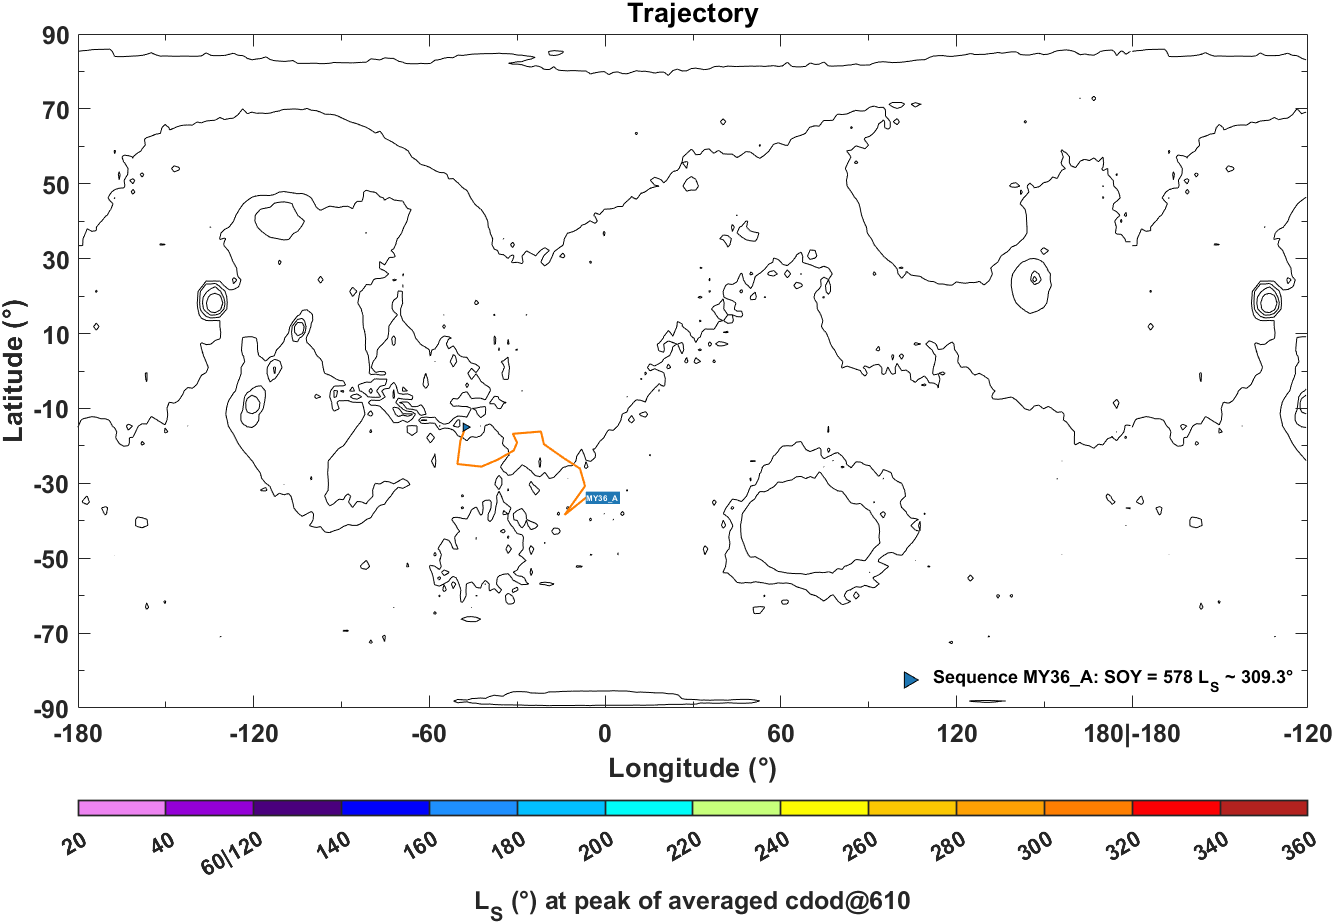
Figure 3: Plot of the trajectory of the centroid of the dust event shown in Figure 2.

Figure 4: Plot of the time evolution of the area of the dust event shown in Figure 2.

Figure 5: Plot of the time evolution of the average and 1-σ envelope of the CDOD normalized to 610 Pa for the dust event shown in Figure 2.
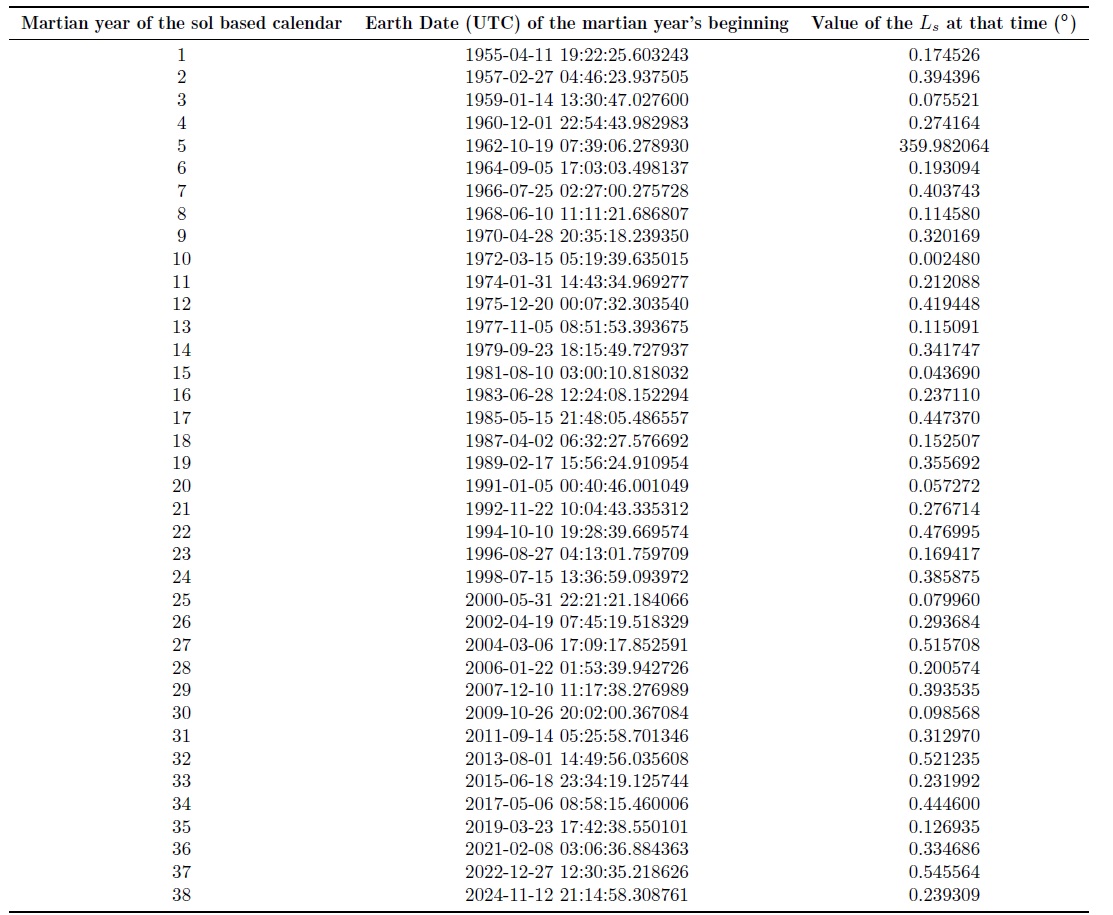
Figure 6: This table shows the Earth UTC dates and Mars solar longitudes of the beginning of Martian years 1 through 38 in our sol-based calendar (see also [1]).
Acknowledgments: LM acknowledges support from CNES and ESA MCD project. BKG was supported by UAE University Grant G00003407. Work at the Jet Propulsion Laboratory, California Institute of Technology, is supported by NASA.
The multi-annual dataset of daily gridded and kriged maps v2.x for MY24 through MY36 is available on the MCD webpage (NetCDF format) at https://www-mars.lmd.jussieu.fr/mars/dust_climatology/ and on the VESPA repository (FITS format) at https://bit.ly/3QMFfIf (shortened link)
The latest v3.0 of the daily gridded maps for MY24 through part of MY27, together with corresponding TES CDOD retrievals in the infrared and in the visible, are available on the NASA PDS (atmosphere node) at:
https://atmos.nmsu.edu/data_and_services/atmospheres_data/MARS/montabone.html
References:
[1] L. Montabone et al., 2015, doi: 10.1016/j.icarus.2014.12.034.
[2] L. Montabone et al., 2020, doi: 10.1029/2019JE006111.
[3] M. D. Smith, 2009, doi: [10.1016/j.icarus.2009.03.027
[4] M. D. Smith, 2004, doi: 10.1016/j.icarus.2003.09.010
[5] A. Kleinboehl et al., 2009, doi: 10.1029/2009JE003358
[6] E. Millour et al., EPSC2022-786, https://doi.org/10.5194/epsc2022-786, 2022.
[7] Smith et al, 2022, doi : 10.1029/2022GL099636
[8] B. K. Guha et al., 2023, doi: 10.1029/2023JE008156
[9] T. Lombard & L. Montabone, 10th International Conference on Mars, 2024
How to cite: Montabone, L., Edwards, C. S., Forget, F., Kass, D., Kleinboehl, A., Guha, B. K., Guyon, V., Lombard, T., Millour, E., Smith, M. D., and Wolff, M. J.: Monitoring Martian Atmospheric Dust using Multi-annual, Multi-instrument Orbital Observations, Europlanet Science Congress 2024, Berlin, Germany, 8–13 Sep 2024, EPSC2024-381, https://doi.org/10.5194/epsc2024-381, 2024.
Dust is one of the major factors influencing the meteorology and climatology of the Martian atmosphere. Southern spring and summer on the planet Mars correspond to periods with increased dust activity. These periods include pre-, near- and post- perihelion regional dust storms [Kass et al., 2016]. The exact timing, size, location, and number of dust storms varies from year to year. Increased dust content can affect a broad region by changing the atmospheric temperature as well as the water propagation from the lower to the upper atmosphere [Karatekin et al., 2023].
Here, we use the Radio Occultation profiles to study the interannual variability during the dusty southern spring and summer seasons. Radio occultation is a remote sensing method for vertical profiling of both lower and upper atmosphere providing the variations in tropospheric temperatures as well as electron densities. The data sets we use are publicly available Mars Express (MEX) [Pätzold et al., 2004] and Mars Atmosphere and Volatile EvolutioN (MAVEN) [Withers et al., 2020] radio occultation experiments. Both conduct experiments with spacecraft components consisting of a radio transceiver and a High Gain Antenna (HGA). At the ground, the radio signals are transmitted and received using ESA’s Estrack and/or NASA’s Deep Space Network (DSN) radio antennas (34 m and 70 m). MEX uses simultaneous and coherent dual-frequency downlinks at X-band and S-band, whereas MAVEN uses a single frequency (X-band) to conduct RO experiments. Both MEX and MAVEN are in elliptical orbit. MAVEN makes observations in both ingress (spacecraft disappearing behind the planet as seen from Earth) and in egress (spacecraft reappearing from behind the planet as seen from Earth) with occultation opportunities occurring once per orbital period of approximately 4.5 hours [Withers et al., 2020]. Whereas MEX primarily makes ingress observations with 1–2 occultations per sol. The publicly available MEX and MAVEN residual Doppler measurements are analyzed with the ROB - RO data analysis code [Krishnan et al., 2023].
The interannual changes and the variability of the upper atmosphere as well as the neutral atmosphere is investigated. The results are further compared with other observations like MCS and NOMAD and with numerical models as well.
References:
- Kass, D. M., et al. (2016), Geophys. Res. Lett., 43, 6111 – 6118.
- Karatekin, O., et al. (2023), Bulletin of the AAS, 55(8).
- Pätzold, M., et al. (2004), Mars: Mars express orbiter radio science (Vol. 1240).
- Withers, P., et al. (2020), Space Science Reviews, 216(61), 1–49.
- Krishnan, A., et al. (2023), Radio Science, 58, e2023RS007784.
Acknowledgements:
This research is financially supported by the PRODEX program managed by the European Science Agency (ESA) with help of the Belgian Science Policy Office (BELSPO).
How to cite: Krishnan, A. and Karatekin, Ö.: Mars interannual variability during the dusty southern spring and summer season using Radio Occultation data, Europlanet Science Congress 2024, Berlin, Germany, 8–13 Sep 2024, EPSC2024-612, https://doi.org/10.5194/epsc2024-612, 2024.
The Curiosity rover has traversed more than 30 km from the landing site at the very bottom of Gale crater and has climbed more than ∼800 m into the Mt. Sharp foothills over more than five Martian years. During nighttime, downslope winds originating from both Mt. Sharp and crater rims would prevent the nighttime accumulation of methane released along the slopes above the cold pool and facilitate the convergence and accumulation of methane in the bottom of the crater [Figure, Panel A]. As a result, any methane released along the slopes at night is quickly transported downslope. After sunrise [Figure, Panel B], the crater circulation transitions to an upslope regime. The reversal of the circulation should transport the methane accumulated in the bottom of the crater upslope as shown in MRAMS model tracer fields, that also indicate a substantial horizontal mixing that rapidly dilutes the methane-enriched air mass. Any methane released along the slopes is transported horizontally and vented out of the crater. MRAMS model predicts a methane front of peak values to pass higher elevations at increasingly later times after sunrise, moreover later in the morning (~10:00 LMST), but usually with highly and increasingly diluted with time methane values. At mid-morning (Figure, Panel C), upslope circulation along surface rims is fully developed and there is a clear horizontal divergence at bottom of crater where methane is highly diluted due to 3-D atmospheric mixing and increasingly advected upslope out of crater. At dusk, downslope winds starts to develop through sloped surfaces of Mt. Sharp, as well as the cold pool of air at the bottom of the crater, which begins to trap methane released from the ground to start the cycle again (Figure, Panel D). Consistent with [Pla-García et al. 2019] and [Moores et al. 2019] the 3-D crater circulation supplemented by the growth and collapse of the PBL is necessary to explain the TLS-SAM methane observations.
How to cite: Pla-Garcia, J., Rafkin, S., Ruíz-Pérez, M., Atreya, S., and Gómez, F.: Curiosity rover TLS-SAM measurements consistent with localized methane containment and transport by 3-D atmospheric circulation in Gale crater, Europlanet Science Congress 2024, Berlin, Germany, 8–13 Sep 2024, EPSC2024-377, https://doi.org/10.5194/epsc2024-377, 2024.
Aerosols on Mars are a primary elements for studying the interaction between the solar radiation and the atmosphere and surface. Depending on properties such as aerosol number density, particle radius, or refractive index, the impact of the aerosols can provide positive or negative radiative feedbacks on the dynamics of the atmosphere. Previous studies have revealed large temporal and spatial variability in the aerosol optical properties, emphasizing the necessity for continuous monitoring of these properties throughout the day and at multiple locations. To address these measurements, the Radiation and Dust Sensor (RDS) [1] is part of the Mars Environmental Dynamics Analyzer (MEDA) [2] payload onboard of the Mars 2020 rover Perseverance. RDS instrument compromises two sets of 8 photodiodes (RDS-DP) and a camera (RDS-SkyCam). One set of photodiodes is pointed upward, with each one covering a different wavelength range between 190-1200 nm. The other set is pointed sideways, 20 degrees above the horizon, and they are spaced 45 degrees apart in azimuth to sample all directions at a single wavelength. The analysis of these observations with a radiative transfer model [3] (Fig. 1) allow us to fit aerosol parameters such as the aerosol opacity at different wavelengths or the aerosol particle radius. In this work we will discuss some preliminary results for the first 100 sols of Mars 2020 mission.
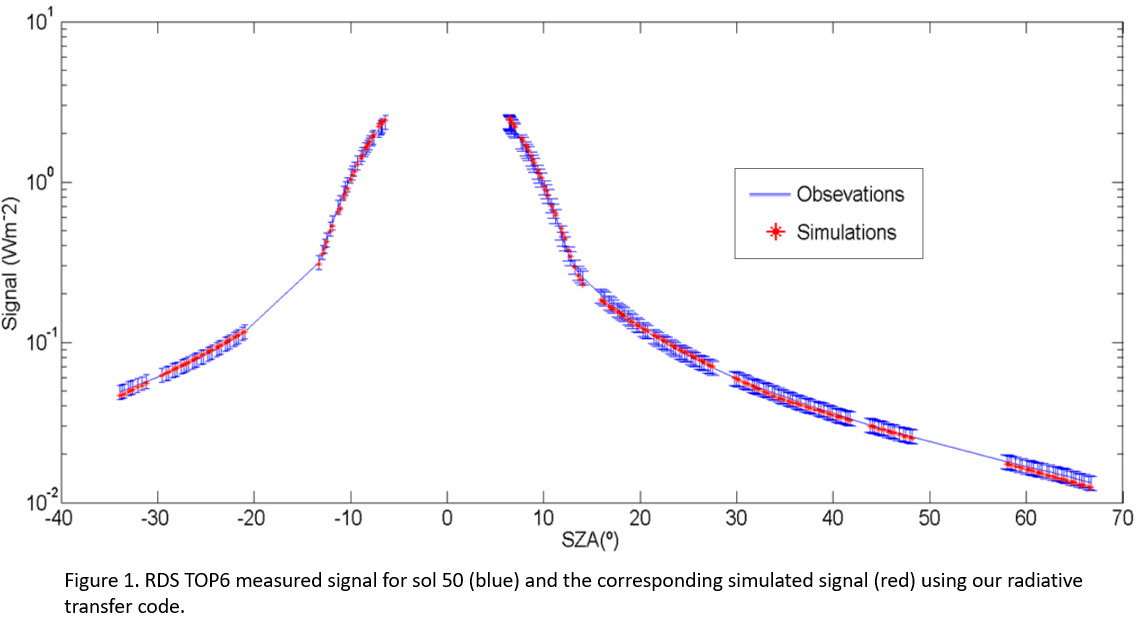
References:
[1] Apestigue, V., et al. “Radiation and Dust Sensor for Mars Environmental Dynamic Analyzer Onboard M2020 Rover”. Sensor 22.8 (2022): 2907.
[2] Rodriguez-Manfredi, Jose Antonio, et al. “The Mars Enviromental Dynamics Analyzer, MEDA. Asuite of enviromental sensors for the Mars 2020 mission.” Space science reviews 217.3 (2021): 1-86.
[3] Toledo, D., et al. “Measurement of aerosol optical depth and sub-visual cloud detection using the optical depth sensor (ODS)”. Atmospheric Measurement Techniques 9.2 (2016): 455-467.
How to cite: Rodriguez-Veloso, R., Toledo, D., Apéstigue, V., Arruego, I., Lemmon, M. T., Smith, M. D., Martínez, G., Vicente-Retortillo, Á., Jiménez-Martín, J. J., García-Menéndez, E., Viudez-Moreiras, D., Sánchez-Lavega, A., Pérez-Hoyos, S., Sebastian, E., de la Torre-Juárez, M., and Rodríguez-Manfredi, J. A.: Aerosol optical properties observed by MEDA Radiation an Dust Sensor (RDS) at Jezero Crater, Mars, Europlanet Science Congress 2024, Berlin, Germany, 8–13 Sep 2024, EPSC2024-508, https://doi.org/10.5194/epsc2024-508, 2024.
The Nadir and Occultation for MArs Discovery (NOMAD, [1]) spectrometer has been collecting Mars observations since 2018, providing a massive amount of information regarding its atmospheric composition, its vertical structure and bridging the gap between the previous knowledge of the lower atmosphere and the data from other missions (e.g., MAVEN) regarding atmospheric escape. The capability of the Solar Occultation (SO) channel to map the vertical structure of the atmosphere with very high (>1000) signal to noise ratio, very high spectral resolution (>17000) and high vertical sampling (0.5 to 2 km) is valuable in many contexts and has already allowed major new discoveries in the atmosphere of Mars. Among those, particularly significant ones include the contribution to the first detection of HCl in the atmosphere [2] and the characterization of its seasonal cycle and correlation with water vapor [3]. In addition, NOMAD data has been used to put stringent constraints on the upper limits for the long-searched CH4 and other hydrocarbons [4].
Continuing the exploration of trace species is of fundamental importance because it enables to gain new insights into unknown aspects of how Martian atmospheric chemistry works, by revealing active cycles and exchanges between atmosphere and surface. In this work, we present results related to the quantification of stringent upper limits for two nitrogen species of interest, NH3 and HCN. Even though a nitrogen cycle on Mars is not expected, we aim at providing a quantification of upper limits for those species in different seasons and on a global scale, with the possibility to provide information to drive future observations and atmospheric modeling. Quantification of upper limits for those species was recently provided by ACS on board TGO [5], and by earlier ground-based studies (e.g. [6]), yet in this work we greatly expand the number of observations to full Martian Years and on a global scale, with the aim of exploring a wider base of data.
Mapping of NH3 and HCN upper limits will be performed by using diffraction order 148 in NOMAD data. This order covers the spectral interval 3326-3353 cm-1 and contains strong spectral signatures of both gases. We analyze a wide dataset comprising more than 300,000 spectra taken at all altitudes between surface and 70 km, and at all latitudes, longitudes and seasons, between April 2018 and February 2024. Once CO2 and H2O abundances and rotational temperatures are fitted, the residual spectra are used to derive upper limits for NH3 and HCN, with the methods described in [4]. In this work, we will present the derived upper limits and draw some conclusions about their variability and implications for atmospheric modeling and future observation planning.
References
[1] A. C. Vandaele et al., Space Science Reviews, vol. 214, no. 5, Aug. 2018, doi: 10.1007/s11214-018-0517-2.
[2] O. Korablev et al., Science Advances, vol. 7, no. 7, p. eabe4386, Feb. 2021, doi: 10.1126/sciadv.abe4386.
[3] S. Aoki et al., Geophys. Res. Letters, vol. 48, no. 11, p. e2021GL092506, 2021, doi: 10.1029/2021GL092506.
[4] E. W. Knutsen et al., Icarus, vol. 357, p. 114266, Mar. 2021, doi: 10.1016/j.icarus.2020.114266.
[5] A. Trokhimovskiy et al., Icarus, vol. 407, p. 115789, Jan. 2024, doi: 10.1016/j.icarus.2023.115789.
[6] G. L. Villanueva et al., Icarus, vol. 223, no. 1, pp. 11–27, Mar. 2013, doi: 10.1016/j.icarus.2012.11.013.
How to cite: Liuzzi, G., Villanueva, G., Faggi, S., Aoki, S., Trompet, L., Neary, L., Viscardy, S., Daerden, F., Brines, A., Lopez-Valverde, M. A., Thomas, I., Ristic, B., Lopez-Moreno, J.-J., Bellucci, G., Patel, M., Masiello, G., Serio, C., and Vandaele, A. C.: Nitrogen cycle on Mars: upper limits for NH3 and HCN as derived by NOMAD on ExoMars/TGO, Europlanet Science Congress 2024, Berlin, Germany, 8–13 Sep 2024, EPSC2024-715, https://doi.org/10.5194/epsc2024-715, 2024.
Introduction
The observations of atmospheric hydrogen chloride (HCl) reported in Korablev et al. (2021), Olsen et al. (2021), and Aoki et al. (2021) by the ACS and NOMAD instruments aboard the ExoMars Trace Gas Orbiter (TGO) marked the first detection of a halogen gas on Mars. Its annual appearance, and subsequent disappearance, is observed as being linked to the seasonal cycles of water vapour and airborne dust according to TGO observations taken across three Martian Years (MY34–36; Olsen et al. 2024). The source of HCl is still debated. It is a gas that is commonly associated with marine boundary layer chemistry and volcanic outgassing on Earth – with no surface ocean and little evidence for volcanic outgassing at the Martian surface, HCl’s correlations with water vapour and dust and anti-correlations with water ice (Luginin et al. 2024) point to gas-solid (heterogeneous) chemical reactions in the atmosphere as its source, as well as its chemical loss. In this work (Taysum et al. 2024, Astronomy and Astrophysics), we present a possible heterogeneous chemistry network that can reproduce the observed vertical profiles of HCl during MY 34, its anti-correlation with water ice, and study its consequences for the photochemical lifetime of methane (CH4) – the elusive compound that TGO instruments have not yet been able to observe (Korablev et al. 2019, Knutsen et al. 2021) despite the past reports from the Curiosity Rover on the surface (Webster et al. 2015, 2018).
Methodology
We have equipped a 1-D photochemistry model, extracted from the Open University version of the LMD GCM, with 14 gas-phase chlorine species. 68 gas-phase reactions and 9 photolysis reactions are included, and the heterogeneous uptake of HCl onto water ice and calcium carbonate in dust grains is included using reaction rates parameterised in previous laboratory studies. Chlorine (Cl) and oxygen (O) atoms are released by interactions of hydrated perchlorate in airborne dust with UV radiation, as observed in the experimental chamber study of Zhang et al. 2022. Atmospheric profiles of temperature and pressure, and long-lived species such as CO2, CO, O2, and H2, are interpolated from the Mars Climate Database v6.1 across latitude, planet longitude, altitude, local time, and solar longitude. 77 ACS MIR observations of HCl through MY 34 are studied using approximately colocated (+/- 5o latitude, +/- 10o solar longitude) water ice and dust profiles retrieved by the ACS TIRVIM channel and water vapour profiles retrieved by NOMAD or the ACS NIR channel to drive the 1-D model.
Results
Using our 1-D photochemical model, we find that the release of Cl and O atoms from hydrated perchlorate in airborne dust, and the subsequent fast uptake of HCl onto water ice, is consistent with the spatial and temporal variations of HCl observed by ACS MIR in MY 34 (Olsen et al. 2021) in the 1-D model. Structured atmospheric layers of HCl are also formed where “holes” exist in the vertical profiles of water ice in our model, a phenomena reported by Luginin et al. (2024) when analyzing ACS TIRVIM observations. The resulting HCl profile shapes also share a strong resemblance to the water vapour profiles used in the model, a feature similarly observed by TGO instrumentation (Aoki et al. 2021). As a consequence of the Cl atoms released via our proposed mechanism, the atmospheric lifetime of methane in the Martian atmosphere can be shortened by two orders of magnitude – this could help to reconcile the reported detections of methane at the surface of Gale Crater by Curiosity (Webster 2015; 2018 and Giuranna et al. 2019) with the non-detections in the atmosphere reported by TGO instrumentation (Korablev et al. 2019, Knutsen et al. 2021).
How to cite: Taysum, B., Palmer, P., Olsen, K., Luginin, M., Ignatiev, N., Trokhimovskiy, A., Shakun, A., Grigoriev, A., Montmessin, F., and Korablev, O.: Observed seasonal changes in Martian hydrogen chloride explained by heterogeneous chemistry, Europlanet Science Congress 2024, Berlin, Germany, 8–13 Sep 2024, EPSC2024-745, https://doi.org/10.5194/epsc2024-745, 2024.
General introduction
The Mars Climate Database (MCD) is a database of meteorological fields derived from General Circulation Model (GCM) numerical simulations of the Martian atmosphere using the Mars Planetary Climate Model (PCM) and validated using available observational data. The MCD includes complementary post-processing schemes such as high spatial resolution interpolation of environmental data and means of reconstructing the variability thereof [1].
The latest version of the MCD, version 6.1, was released in December 2022.
The Mars PCM (formerly known as the LMD GCM) that is used to create the MCD data is developed at Laboratoire de Météorologie Dynamique du CNRS (Paris, France) [2] in collaboration with LATMOS (Paris, France), the Open University (UK), the Oxford University (UK) and the Instituto de Astrofisica de Andalucia (Spain) with support from the European Space Agency (ESA) and the Centre National d'Etudes Spatiales (CNES).
The MCD is intended to be useful and used in the framework of engineering applications as well as in the context of scientific studies which require accurate knowledge of the state of the Martian atmosphere. Over the years, various versions of the MCD have been released and handed to more than 400 teams around the world. It is cited in more than 600 peer-reviewed publications (source: NASA ADS).
The MCD is freely available upon request via an online form on the dedicated website: http://www-mars.lmd.jussieu.fr which moreover includes a convenient web interface for quick looks.
Overview of the Mars Climate Database contents
The MCD provides mean values and statistics of the main meteorological variables (atmospheric temperature, density, pressure and winds) as well as atmospheric composition (including dust and water vapor and ice content), as the GCM from which the datasets are obtained includes water cycle, chemistry, and ionosphere models[2]. The database extends up to and including the thermosphere (~350km). Since the influence of Extreme Ultra Violet (EUV) input from the sun is significant in the latter, 3 EUV scenarios (solar minimum, average and maximum inputs) account for the impact of the various states of the solar cycle.
As the main driver of the Martian climate is the dust loading of the atmosphere [3-4], the MCD provides climatologies over a series of synthetic dust scenarios: standard year (a.k.a. climatology), cold (i.e: low dust), warm (i.e: dusty atmosphere) and dust storm (see Figure 2 for an illustrative example), These are derived from home-made, instrument-derived (TES, THEMIS, MCS, MERs), dust climatology of the last 12 Martian years [5]. In addition, we also provide additional “add-on” scenarios which focus on individual Martian Years (from MY 24 to MY 35) for users more interested in more specific climatologies than the MCD baseline scenarios.
MCD outputs and validation
The MCD in intended to be useful for both engineering and scientific studies. Known applications include entry descent and landing (EDL) studies for Mars missions, investigations of some specific Martian issues (via coupling of the MCD with homemade codes), analysis of observations (Earth-based as well as with various instruments onboard Mars Express, Mars Reconnaissance Orbiter, Trace Gas Orbiter, Emirates Mars Mission),…
In practice the MCD provides users with:
- Mean values and statistics of main meteorological variables (atmospheric temperature, density, pressure and winds), as well as surface pressure and temperature, CO2 ice cover, thermal and solar radiative fluxes, dust column opacity and mixing ratio, [H20] vapor and ice concentrations, along with concentrations of many species: [CO], [O2], [O], [N2], [Ar], [H2], [O3], [H] ..., as well as electrons mixing ratios. Column densities of these species are also given.
- Physical processes in the Planetary Boundary Layer (PBL), such as PBL height, minimum and maximum vertical convective winds in the PBL, surface wind stress and sensible heat flux.
- The possibility to reconstruct realistic conditions by combining the provided climatology with additional large scale (derived from Empirical Orthogonal Functions extracted from the GCM runs) and small scale perturbations (gravity waves).
- Dust mass mixing ratio, along with estimated dust effective radius and dust deposition rate on the surface are provided.
- A high resolution mode which combines high resolution (32 pixel/degree) MOLA topography records and Insight pressure records with raw lower resolution GCM results to yield, within the restriction of the procedure, high resolution values of atmospheric variables (pressure, but also temperature and winds via dedicated schemes).
MCD version 6.1 has been validated using many available datasets, and these comparisons are detailed in the validation document [6] distributed with the software.
References
[1] Bierjon A. et al. (2023) International Planetary Probe Workshop 2023.
[2] Forget F. et al. (2022) 7th Mars Atmosphere Modeling and Observation.
[3] Bierjon A. et al. (2022) 7th Mars Atmosphere Modeling and Observation.
[4] Pierron T. et al. (2022) 7th Mars Atmosphere Modeling and Observation.
[5] Montabone L. et al. (2024) EuroPlanet Science Congress.
[6] Forget F. et al. (2022) Mars Climate Database V6.1 Validation Document
How to cite: Millour, E., Forget, F., Spiga, A., Pierron, T., Bierjon, A., Montabone, L., Lefèvre, F., Montmessin, F., Chaufray, J.-Y., Lopez-Valverde, M., Gonzalez-Galindo, F., Desjean, M.-C., Cipriani, F., and MCD development team, T.: The Mars Climate Database, MCD version 6.1, Europlanet Science Congress 2024, Berlin, Germany, 8–13 Sep 2024, EPSC2024-516, https://doi.org/10.5194/epsc2024-516, 2024.
Introduction
A few years ago, two instruments on the Mars Trace Gas Orbiter (TGO) revealed the presence of hydrogen chloride (HCl) at ppbv levels in the Martian atmosphere during Martian Year (MY) 34 (Korablev et al. 2021) — the first detection of a halogenated gas on Mars. It has since been detected during MY 35 and 36 (Olsen et al. 2021, Aoki et al. 2021, Olsen et al. 2024). There is still a lot of debate about the production and loss of HCl on Mars but there are some clues associated with its seasonal behaviour, linked with changes in atmospheric dust and water vapour. Specifically, HCl appears to be linked with dust activity – it appears at the start of the dust season and quickly disappears soon afterwards.
Chlorine gas-phase chemistry, as described in current photochemical models, is not sufficient to reproduce observed levels and geographical variations of Martian HCl. The atmospheric e-folding lifetime of atmospheric HCl is 90 to 1000 sols (Aoki et al. 2021) but the variations in the HCl abundance observed by Korablev et al. (2021) correspond to a lifetime shorter than 75 sols (Krasnopolsky 2022). New studies show that heterogeneous chemistry – including the release Cl from airborne dust and the uptake of HCl on dust and water ice – is more consistent with observed variations of HCl (Taysum et al. 2024, Streeter et al. 2024). The 1-D photochemistry model of Taysum et al. (2024) reproduced HCl observations from the TGO ACS MIR instrument in the southern hemisphere but had more difficulty in the northern hemisphere. The authors attribute these model errors partly to the absence of horizontal transport. We address this shortcoming of the 1-D model by including the Taysum et al. (2024) chemical network into the 3-D LMD Mars Planetary Climate Model (MPCM).
Implementing the chlorine chemistry in the MPCM
The Taysum et al. (2024) chemical chlorine network includes 14 chlorinated species, 7 photodissociation reactions, 50 gas-phase reactions, and 5 heterogeneous reactions. Chlorine is produced via a heterogeneous reaction between water vapour and dust, based on experimental work from Zhang et al. (2022), while HCl is lost to dust and water ice.
The MPCM is a Global Circulation Model developed collaboratively by the Laboratoire de Météorologie Dynamique (LMD), the Laboratoire Atmospheres et Observations Spatiales (LATMOS) and the Atmospheric and Oceanic Planetary Physics sub-department in Oxford. It couples a dynamic and a physical part, including atmospheric photochemistry, allowing us to compute the composition of the Martian atmosphere, and therefore the HCl abundances as observed by the ExoMars TGO instruments.
We present results from control and sensitivity numerical experiments to highlight the importance of the heterogeneous chemistry on HCl abundances. These experiments use input data – atmospheric species abundances, aerosol profiles and dust scenario – for MY 34 from the Mars Climate Database (MCD) v6.1 (Millour et al. 2018).
Results
Our model produces layered HCl structures with maximum abundances at ppbv level in both hemispheres, broadly consistent with ACS MIR data collected during MY 34 (Korablev et al. 2021). It also reproduces the seasonal variations of HCl in the Martian atmosphere – HCl levels increase at the beginning of the dust season and drop rapidly at the end of the season. In agreement with Taysum et al. (2024), we find that this rapid loss is mainly due to HCl uptake on water ice, followed by uptake on dust, with integrated column rates orders of magnitude higher than gas-phase reactions. In other words, the heterogeneous chemistry appears to play an important role in reproducing HCl in the Martian atmosphere. Consequently, HCl abundances in our model are very sensitive to our assumed heterogeneous uptake coefficients. This points to a need for new measurements of these coefficients in conditions representative of the Martian atmosphere to challenge the robustness of our results.
How to cite: Benne, B., Taysum, B. M., and Palmer, P. I.: Chlorine photochemistry in the Mars Planetary Climate Model , Europlanet Science Congress 2024, Berlin, Germany, 8–13 Sep 2024, EPSC2024-1037, https://doi.org/10.5194/epsc2024-1037, 2024.
The characterization of the thermal structure of the Martian atmosphere with unprecendented vertical resolution is one of the goals of the ESA and Roscosmos Exomars Trace Gas Orbiter (TGO) [1]. This can be achieved with two solar occultation instruments, NOMAD [2] and ACS [3], whose ultimate goal is to sound the temperature and density from the Mars' lowermost atmospheric layers up to the thermosphere. Both instrumetns are synergistic and complementary, and in particular, the NOMAD SO channel and the NIR and MIR spectrometers of the ACS instrument exploit a number of strong CO2 ro-vibrational bands in the near-IR.
At the IAA we have developed a retrieval suite common for the NOMAD/SO and the ACS/MIR channels, comprising: (a) a cleaning/pre-processing module to build vertical profiles of calibrated transmittances which computes and correct for residual calibration and instrumental effects like spectral shifts, bending of the continuum and variations in the instrument line shape; (b) a state-of-the-art retrieval scheme designed originally for Earth atmospheric remote sensing [4,5,6] and applied to Mars [7], in order to derive simultaneous density and temperature profiles in a global fit approach and allowing for hydrostatic adjustments during the internal iteration. Our first analysis of the NOMAD SO channel focused at altitudes below 100 km and on the first year of TGO operations, from April 2018 to March 2019 (second half or “perihelion” season of MY34), and revealed very interesting results [8]. The thermal structure is strongly affected by the MY34 global dust storm at all altitudes, a cold mesosphere (in comparison to global climate models) was found during the post-GDS period, and wavy structures at mesospheric altitudes in the morning terminator seem to reveal very strong thermal tides at low-mid latitudes.
Other data-cleaning and retrieval methods have been applied by other NOMAD and ACS teams ollowing different approaches. Some of them do not apply a global fit but a sequential single-altitude inversion, and the handling of the instrument systematic uncertainties is handled in differnt ways during the inversion. Both NOAMD and ACS instrument teams have already obtained very valuable and unique results up to the mesosphere and thermosphere, capturing latitudinal and longitudinal variations, as well as local time, seasonal and dust effects and wave patterns and impacts [9,10,11,12]. Still, and a cross-validation exercise between all these results is very necessary. First steps in this direction were performed previously, but with a limited amount of data, revealing a good overall agreement. A recent ISSI project gave a new push to their cross-validation and this work is partially motivated by this project. Preliminary results indicate some systematic differences between retrieval results, particularly in the upper troposphere and lower mesosphere.
One of the difficulties associated to sampling a very large altitude range with a single instrument, as we are tackling with TGO solar occultation observations, is the large range of opacities along the line of sight that need to be handled. This implies the use of different diffraction orders and/or spectral lines of very different strengths. In addition, spectral saturation of those CO2 ro-vibrational lines need to be avoided, if they are going to be used in combination with weaker CO2 lines. Although in principle there is no theoretical limitation to combine spectral lines, effects from inhomogeneities along the line-of-sight may appear. This can be specially important in cases like atmospheric thermal inversions, where the largest differences between NOMAD and ACS are observed. In this study we propose the use of micro spectral windows to isolate the spectral lines and their associated altitude ranges in order to combine the different CO2 lines in an optimal way. This approach has been applied to both NOMAD/SO and ACS/MIR retrievals and we will show and discuss the impact of this strategy.
References
[1] Lopez-Valverde et al., Space Sci Rev, 214, 29 (2018)
[2] Vandaele, A.-C., J.J. López-Moreno, M.R. Patel, et al., Space Science Reviews, 214, doi:10.1007/s11214-018-0517-2 (2019)
[3] Korablev et al., Space. Sci. Rev. 214, 7 (2018).
[4] Funke, B., et al. , Atmos. Chem. Phys., 9(7), 2387–2411 (2009).
[5] Stiller et al., JQSRT, 72, 249–280 (2002)
[6] von Clarmann et al., J. Geophys. Res. 108, 4746 (2003)
[7] Jimenez-Monferrer et al., Icarus, 353, 113830 (2020), doi.org/10.1016/j.icarus.2020.113830.
[8] López-Valverde, M.A., B. Funke, A. Brines, et al., JGR Planets, 128, doi:10.1029/2022JE007278 (2023)
[9] Trompet L, Vandaele AC, Thomas I, et al (2023) JGR Planets 128:e2022JE007279
[10] Belyaev, D. A., Fedorova, A. A., Trokhimovskiy, A., Alday, J., Montmessin, F., Korablev, O. I., et al. (2021). Geophysical Research Letters, 48(10), e2021GL093411. https://doi.org/10.1029/2021GL093411
[11] Belyaev, D. A., Fedorova, A. A., Trokhimovskiy, A., Alday, J., Korablev, O. I., Montmessin, F., et al. (2022). Journal of Geophysical Research: Planets, 127, e2022JE007286. https://doi.org/10.1029/2022JE007286
[12] Fedorova, A. A., Montmessin, F., Korablev, O., Luginin, M., Trokhimovskiy, A., Belyaev, D. A., et al. (2020). Science, 367(6475), 297–300. https://doi.org/10.1126/science.aay9522
Acknowledgements:
The IAA/CSIC team acknowledges financial support from the Severo Ochoa grant CEX2021-001131-S and by grants PID2022-137579NB-I00, RTI2018-100920-J-I00 and PID2022-141216NB-I00 all funded by MCIN/AEI/ 10.13039/501100011033. A. Brines acknowledges financial support from the grant PRE2019-088355 funded by MCIN/AEI/10.13039/501100011033 and by ’ESF Investing in your future’. ExoMars is a space mission of the European Space Agency (ESA) and Roscosmos. The NOMAD experiment is led by the Royal Belgian Institute for Space Aeronomy (IASB-BIRA), assisted by Co-PI teams from Spain (IAA-CSIC), Italy (INAF-IAPS), and the United Kingdom (Open University).
How to cite: Lopez-Valverde, M. A., Brines, A., Funke, B., Gonzalez-Galindo, F., Trompet, L., Alday, J., Belyaev, D., Fedorova, A., Trokhimovskiy, A., Olsen, K., Baggio, L., Thomas, I., Sanz, R., Lopez-Moreno, J. J., Patel, M., Bellucci, G., Montmessin, F., Korablev, O., and Vandaele, A. C.: Temperature Profiles from TGO Solar Occultation Data. Retrieval Methods and Cross-validation between NOMAD & ACS, Europlanet Science Congress 2024, Berlin, Germany, 8–13 Sep 2024, EPSC2024-1033, https://doi.org/10.5194/epsc2024-1033, 2024.
The presence of the Martian oxygen green line emission at 557.7 nm in the Martian dayglow was discovered with the NOMAD-UVIS ultraviolet-visible spectrometer on board ESA’s Trace Gas Orbiter (Gérard et al., 2020). It corresponds to the 1S -1D forbidden transition in the O atom. Limb profiles of the emission have been observed with a vertical resolution of about 10 km. They generally show two peaks near 80 km and 110 km during quiet solar periods. Intensity and altitude variations of the emission peaks have been previously reported (Soret et al., 2022). The green line is by far the strongest feature in the Mars dayglow spectrum.
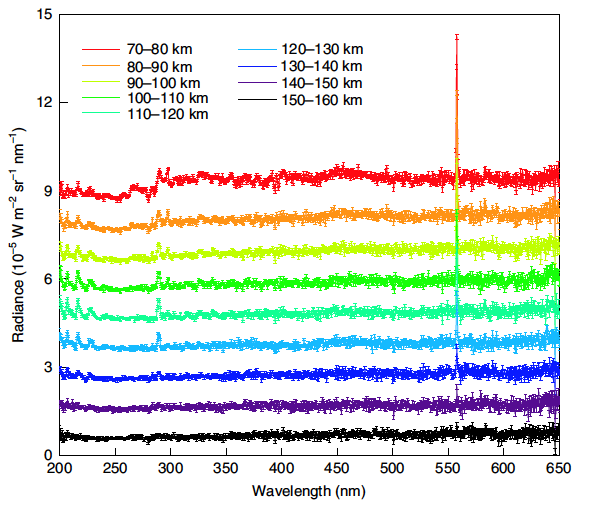
Fig. 1: NOMAD/UVIS dayside limb spectra binned into altitudes regions between 70 and 160 km. In addition to the strong green line, the OI line at 297.2 nm and the CO2+ UV doublet at 288-289 nm are also observed. The spectral resolution varies from 1.2 nm at 200 nm to 1.6 nm at 600 nm (Gérard et al., 2020)
The O(1S) level is mainly excited by photodissociation of CO2 by solar EUV radiation, with minor contributions mostly from electron impact on CO2 molecules and dissociative recombination of CO2+ ions. The doublet at 630-636.4 nm has also been observed but is about 20 times weaker (Gérard et al., 2021; Soret et al., 2022). The lower peak is excited by solar Lyman-a radiation while the upper one is produced by a range of EUV radiation.
Dayside observations have been performed since April 2019 and monitored to observe the changing brightness and peak altitude as solar activity increases. Observations of the UV counterpart 1S-3P at 297.2 nm of the green line have shown that the upper emission peak remains located at a pressure level close to 0.39 microbar (Gkouvelis et al., 2018). The solar EUV flux at the Mars location is provided in three spectral channels by the EUV monitor (EUVM) on board MAVEN. UVIS dayglow observations collected at different seasons and latitudes have shown that the 557.7-nm emission varies with season and latitude (Soret et al., 2022), making it possible to follow CO2 density variations in the mesosphere.

Fig. 2: Limb profiles of the OI 557.7-nm dayglow (c) in northern Spring and Summer, (d) in southern Spring and Summer Numerical simulations for the same conditions are shown in red (Soret et al., 2022).
In this study, we present time variations of the altitude and brightness of the green line distribution during the period of rising activity. We show that the limb brightness directly responds to the intensity of the solar Lyman-alpha flux, while the attitude shows a more complex response dependence, a signature of the expansion and contraction of the atmosphere.
REFERENCES
Gérard, J. C., Aoki, S., Willame, Y., Gkouvelis, L., Depiesse, C., Thomas, I. R., et al. (2020). Detection of green line emission in the dayside atmosphere of Mars from NOMAD-TGO observations. Nature Astronomy, 4(11), 1049–1052.
Gérard, J. C., Aoki, S., Gkouvelis, L., Soret, L., Willame, Y., Thomas, I. R., et al. (2021). First observation of the oxygen 630 nm emission in the Martian dayglow. Geophysical Research Letters, 48(8), e2020GL092334. https://doi.org/10.1029/2020GL092334.
Gkouvelis, L., Gérard, J. C., Ritter, B., Hubert, B., Schneider, N. M., & Jain, S. K. (2018). The O(1S) 297.2-nm dayglow emission: A tracer of CO2 density variations in the martian lower thermosphere. JGR Planets, 123(12), 3119–3132.
Soret, L., Gérard, J.-C., Aoki, S., Gkouvelis, L., Thomas, I. R., Ristic, B., et al. (2022). The Mars oxygen visible dayglow: A Martian year of NOMAD/UVIS observations. JGR Planets, 127, e2022JE007220.
How to cite: Gérard, J.-C., Soret, L., Robin, H., Thomas, I., Ristic, B., Vandaele, A. C., and Hubert, B.: Variations of the Martian oxygen green line dayglow: response to solar activity, Europlanet Science Congress 2024, Berlin, Germany, 8–13 Sep 2024, EPSC2024-896, https://doi.org/10.5194/epsc2024-896, 2024.
Please decide on your access
Please use the buttons below to download the supplementary material or to visit the external website where the presentation is linked. Regarding the external link, please note that Copernicus Meetings cannot accept any liability for the content and the website you will visit.
Forward to presentation link
You are going to open an external link to the presentation as indicated by the authors. Copernicus Meetings cannot accept any liability for the content and the website you will visit.
We are sorry, but presentations are only available for users who registered for the conference. Thank you.
Perseverance landed in Jezero crater on February 18th, 2021. Perseverance is equipped by seven scientific instruments, including the SuperCam suite. SuperCam combines several remote-sensing techniques in order to study both the Martian surface and its atmosphere: 1. the LIBS (Laser-Induced Breakdown Spectroscopy) technique gives access to the chemical composition of the targets (up to 15m); 2. The Raman spectroscopy enables the identification of major mineral phases; 3. The VISIR spectroscopy gives access to the mineralogy, via the reflection of sunlight to access the frequency of molecule bond vibrations of the targets; 4. The Remote Micro Imager (RMI) uses a CMOS camera of 2048x2048 pixels, with an angular size of 10 microradians and a resolution of 50 microradians; 5. The microphone records air pressure fluctuations from 20 Hz to 12.5 or 50 KHz, at sampling rates of 25 or 100 KHz, respectively.
SuperCam performs remote observations around the rover allowing a large number of acquisitions. When analyzing a target, several point analyses are performed when doing LIBS, Raman and/or VISIR, in order to assess its homogeneity and to improve the overall precision. Typically, ten points per target are performed. Moreover, the atmospheric studies require recurrent observations to investigate potential seasonal effects or atmospheric processes.
Up to sol 1100, SuperCam has analyzed a total of 992 geological targets. The laser has primarily been used to collect LIBS observations: 203 000 laser shots were used for the LIBS; whereas 148 000 were used for Raman, and 14 000 for the fluorescence. Raman analyses are more efficient when crystals in the target sample are large and relatively pure, which has been seen infrequently in Jezero crater. A total of 855 activities on mars targets use either the VIS or the IRS technique, for the first time in-situ. This represents a total of 8358 IRS data points for mineralogical investigations. Concerning atmospheric studies, 95 passive sky observations have been performed. The RMI is used to record context images for each analyzed target together with some long-distance investigations. A total of 4270 RMI have been acquired so far. Finally, the microphone is systematically combined with the LIBS activities to gain insight into the target’s physical properties. In addition, it has been used for 498 standalone microphone activities for atmospheric study, representing 22 hours of recording. The SuperCam data can be found on the Planetary Data System.
SuperCam observations have led to more than fifty publications since 2021. This literature addresses the main objectives of the mission: the context of the landing site, the igneous history of the crater floor, investigation of the alteration processes, and the actual environment.
After the crater floor, igneous minerals are encountered along the traverse in the delta in igneous boulders, and also in the delta bedrocks. Comparison of these igneous minerals from the delta and margin unit with those encountered in the crater floor and in Mars meteorites could help constrain their origin. Supercam investigates the composition of the carbonates found in the margin unit by comparing them to the primary minerals composition in order to better constrain their formation processes. Some light-toned float rocks have been encountered since the landing. Their mineralogical composition is modeled using VISIR data but also using LIBS. They also show an elevated Ni content, which could constrain their formation process. Some studies of terrestrial analogs are in progress. SuperCam is also used to investigate specific formations, such as coating and concretions. Comparison of IRS data acquired in situ by SuperCam with orbital observations from the same unit, with different instruments and length scales are ongoing. Multi-instrument studies are also performed on abraded patches to better understand the origin of the carbonates in these samples. VISIR data from SuperCam and MastCam-Z on the abraded patches and drill fines are also associated to document spectral features related to primary and secondary minerals. The first in situ sequence stratigraphic analysis on Mars has been realized on the Kodiak butte. The images acquired in the delta illuminate the fluvial and deltaic stratigraphy throughout the delta to better constrain the fluvial inputs in the crater, and therefore provide insights into the history of Jezero lake. The chemostratigraphy and mineralogy of the western fan revealed a complex aqueous history and alteration conditions in the delta front. The preservation or organic materials is also investigated via Raman data on the organic calibration target onboard the rover.
Since landing, the SuperCam microphone has led to several discoveries, with a review of the acoustic results presented at MarsX conference. One of the latest results describes the high frequency turbulence on Mars. Atmospheric observations have also contributed to the discovery of a Martian aurora from the SuperCam and MastCam-Z instruments. This is the first time such phenomena are observed in situ. Simulation efforts are underway, including a model simulating the propagation of the sound in the lower part of the atmosphere.
Several laboratory investigations are ongoing in support of Mars observations. Some of these studies include specific elemental calibrations, such as P or F. Other studies aim at improving the sensibility of SuperCam to detect serpentine. Some laboratory data explore the Raman signal on chocked carbonates, as observed in Mars meteorites. Some laboratory simulation experiments aim at understanding the formation pathways of the Na perchlorates observed with SuperCam, and others aim at constraining the redox and past aqueous environment during the carbonate formations. A spectral unmixing method is developped to identify some minor and trace elemental lines in LIBS data. A broader database of LIBS spectra is being assembled in order to better quantify LIBS data, which is ongoing. The LIBS plasma dynamics is also investigated to verify the quality of our data. Several modeling efforts are developed for the VISIR data to better identify the mineralogical assemblages present in the targets.
How to cite: Cousin, A. and the Agnes Cousin: The SuperCam Instrument onboard Perseverance: Overview of the ongoing efforts, Europlanet Science Congress 2024, Berlin, Germany, 8–13 Sep 2024, EPSC2024-69, https://doi.org/10.5194/epsc2024-69, 2024.
Having reached the milestone of 20 years in space, Mars Express remains one of the oldest operational spacecraft orbiting Mars. The spacecraft subsystems, scientific payload and ground segment are in overall good health, with ongoing smooth science operations. Of the 3 lifetime-limiting elements of the spacecraft (fuel, gyros, and batteries) the ring laser gyro situation may be the one to watch more closely (see also Martin et al., “Getting the most out of Mars Express”, EPSC, 2022). Gyro 3 failed in March 2024 during a routine wheel off-loading. This gyro was the most degraded of the remaining gyros and was the next expected to fail but was not predicted to reach end of life until July 2024. This does not affect the prediction for the overall lifetime of the gyros but does reduce confidence in the predictions. Considered that the spacecraft needs at least three functioning gyros to compute its attitude based on inertial information, the failure of Gyro 5 (the next projected one to fail) will drive the end of this capability. This is not expected before 2029-2030 with the current low (~5%) average duty cycle of the Inertial Measurement Unit (IMU).
For the purpose of ensuring that the mission can fulfill its mission extension goals over the coming years, it was decided to examine if additional measures could be taken to further reduce the duty cycle of the gyros, with the caveat that the fuel consumption should not be increased and if possible even decreased. Investigations have been started between Flight Dynamics, the Flight Control Team and the Science Ground Segment, with the aim to increase Mars Express’ operational lifetime. Among the main points is the option of not turning the IMU on during wheel off loadings. Gyros are switched on (and lifetime consumed) during maintenance blocks (wheel off-loadings), Orbit Control Manoeuvres (OCM), a very small number of science operations that require the spacecraft to slew faster than can be supported by the gyroless estimator, and other operation incidents, e.g., the 2023 Safe Mode. Maintenance blocks account for the vast majority (~85%) of gyro usage, with observations in gyrostellar mode and operational incidents making up the remaining ~15%. It therefore makes the most sense to focus on the maintenance blocks when looking for reductions in gyro usage.
Maintenance blocks are performed roughly every 4 orbits and last about 100 minutes, divided into 3 roughly equal phases: slew to the maintenance attitude, wheel off-loading in a fixed attitude and slew back from the maintenance attitude. Regarding gyro operations, there are 2 classes of maintenance blocks: (i) “Gyrostellar” where the maintenance is performed with the gyros on for just under 40 minutes and the spacecraft in gyrostellar mode. (ii) “Gyroless” where the spacecraft attitude is controlled by the gyroless estimator throughout the maintenance block. However, the gyrostellar estimator is switched on, but not put in the loop during the rate reduction phase. Based on this there are several possible options to reduce gyro usage in maintenance blocks: Decrease the frequency of wheel off-loadings, perform fewer maintenance blocks in Gyrostellar, or stop activating the gyros in hot standby in gyroless maintenance blocks. The latter would be easy to implement by Flight Dynamics, but the concern is that it could increase the risk of Safe Mode.
Implementing one or several of these options will increase Mars Express’ lifetime potentially by a significant number of months, which will give it an extended scientific lifeline. This will allow the mission not only to achieve new science opportunities and take longer benefit from recently added observation modes (e..g., MARSIS Phobos mode, MEX-TGO radio occultations), but also to ensure its capabilities remain robust to support joint science with JAXA’s Martian Moon eXplorer (MMX) mission to Phobos from 2027 onward.
How to cite: Martin, P., Wilson, C., Godfrey, J., Cardesin-Moinelo, A., Mahieux, A., Nespoli, F., Sierra, M., Blake, R., Gobbi, C., Hahn, J., Lucas, L., Pistone, V., Wood, S., Damiani, S., Heather, D., Grotheer, E., Breitfellner, M., Muniz, C., Science Ground Segment Team, M. E., and Flight Control Team, F. D. T. A.: Extending Mars Express gyros for a scientific lifeline, Europlanet Science Congress 2024, Berlin, Germany, 8–13 Sep 2024, EPSC2024-546, https://doi.org/10.5194/epsc2024-546, 2024.
A compact Raman spectrometer [1] was developed for in-situ science on Phobos with the IDEFIX rover [2], which will be launched as part of JAXA’s Martian Moon eXploration (MMX) mission in 2026. The MMX mission is dedicated to study the two Martian moons, Phobos and Deimos, with the aim of better understanding their origin and evolution [3, 4]. Orbital observations with the main MMX spacecraft and in-situ science on Phobos with the IDEFIX rover will be complemented by returning samples (>10 g) from the surface of Phobos back to Earth. The rover is expected to land between late 2028 and early 2029, in conjunction with the rehearsal for the first landing of the main spacecraft.
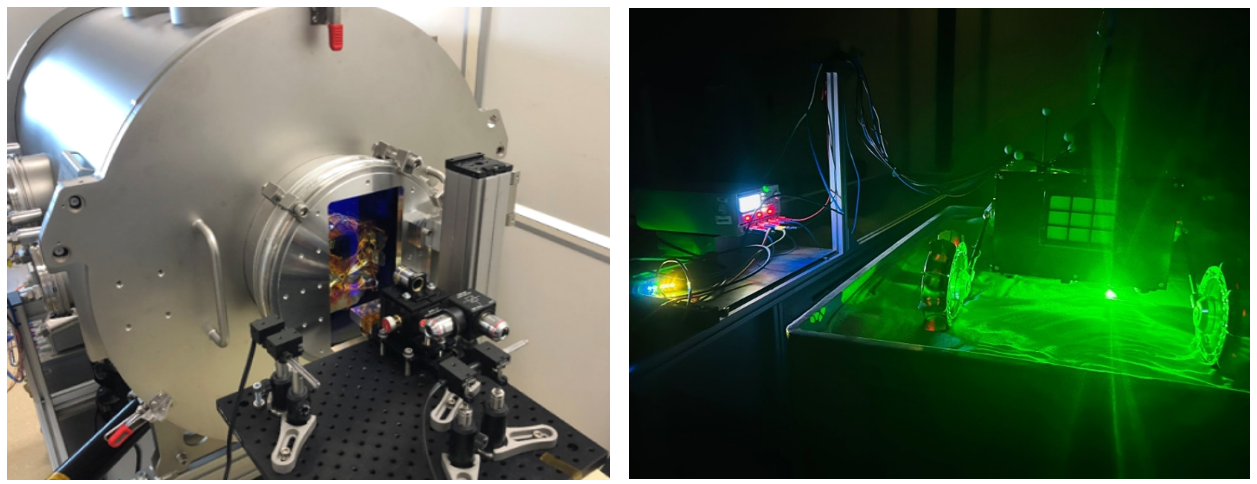
Figure 1. left: RAX flight model (FM) during thermal vacuum testing at DLR. Right: RAX development model (DM) combined locomotion test with MMX demonstration rover in DLR testbed during a Raman measurement.
The RAman spectrometer for MMX (RAX) contributes directly to the high level mission objectives by characterizing the mineral composition of the Phobos surface in-situ, providing ground truth. While different mineral phases can be associated with different formation scenarios (e.g. captured asteroid or major impact) and surface alteration processes on Phobos, the mineralogical information obtained with RAX can also help inform decisions about sampling with the main spacecraft and be compared with data obtained from the returned samples and in-situ data from the surface of Mars. The rover's mobility allows measurements to be taken from multiple positions along the rover's traverse, allowing local variations in composition to be studied. RAX measures down to the ground below the rover. RAX is extremely compact, with a mass of only 1.5 kg and a volume of about 1 dm³. The optical design of RAX was driven by 1) the tight volume and mass constraints available of the small MMX rover and 2) optimizing the collection and detection capabilities of the Raman signal from a sample at several centimeters distance below the rover’s body. Raman excitation (λ = 532 nm, typical optical power on sample 20 mW) is provided by a separate laser module based on the Raman Laser Spectrometer (RLS) laser developed for the Rosalind Franklin rover of the ExoMars mission [5]. The laser emission is transmitted to the RAX Spectrometer Module via a multimode optical fiber with a core diameter of 50 µm. To focus the laser on the Phobos surface below the rover, the spectrometer is equipped with an opto-mechanical autofocus subsystem. It allows fine-tuning of the focus position at a working distance of about 8 cm, within a range of 13 mm and an accuracy of 50 µm. The RAX instrument covers a spectral range of 535 to 680 nm, corresponding to a Raman shift of approximately 90 to 4000 cm−1 and therefore enabling the identification of water-bearing minerals. The spectral resolution across the entire spectral range is about 10 cm−1. To demonstrate the functionality of the RAX instrument after launch and to monitor its performance, a Verification Target (VT) is part of the payload. The VT is a 13 mm diameter pellet made of deuterated polyethylene terephthalate (PET) and was developed and space-qualified specifically for this mission [6]. The VT is placed in the field of view of the RAX instrument and can be measured during the cruise until the rover separates from the MMX spacecraft for landing on Phobos.
For a Raman measurement on Phobos, the rover’s locomotion system is needed for the main height adjustment: the rover will gradually lower its body height until the RAX instrument is within its working range. After autofocusing, RAX will measure what is exposed beneath the rover from a footprint of 50 µm. Visual context is provided by the rover’s cameras. To improved data acquisition, Raman data will be collected during Phobos nights.
Representing a collaborative effort, RAX is a joint contribution from the German Aerospace Center (DLR), Instituto Nacional de Técnica Aerospacial (INTA), and JAXA. Delivered to the MMX Phobos Rover in August 2022, the RAX flight model was successfully integrated into the IDEFIX rover in October 2022. The flight model of the rover has been delivered to JAXA/MELCO where it is currently being integrated into the main spacecraft for further qualification and functional testing. Operational sequences, e.g. defining the interaction between locomotion and science instruments, are currently being prepared. RAX scientific measurements are being prepared with laboratory studies using the RAX development model.
Acknowledgements
MMX is a JAXA mission with contributions from NASA, CNES and DLR. The MMX IDEFIX rover is provided by CNES and DLR. The RAX instrument is a joint development from DLR-OS, INTA/UVa, and JAXA/UTo. The authors thank their respective national funding frameworks including DLR’s Programmatik Raumfahrt and PID2022-142490OB-C31 funded by MCIN/AEI/10.13039/501100011033 and are grateful to the MMX, IDEFIX rover and RAX instrument teams who made this work possible.
References
[1] T. Hagelschuer, U. Böttger, M. Buder et al., Internat. Astronautical Congress (IAC): 18-22 September, 2022, Proceed. 2022, IAC-22-A3.4A.8.
[2] S. Ulamec, P. Michel, M. Grott et al., Acta Astronaut. 2023, 210, 95.
[3] T. Usui, K. Bajo, W. Fujiya et al., Space Sci. Rev. 2020, 216, 49.
[4] Y. Kawakatsu, K. Kuramoto, T. Usui et al., Acta Astronaut. 2023, 202, 715.
[5] F. Rull, S. Maurice, I. Hutchinson et al., Astrobiology 2017, 17, 627.
[6] A. G. Moral, J. Mora, O. Prieto-Ballesteros et al., J. Raman Spectrosc. 2023, 54, 1268.
How to cite: Schröder, S., Böttger, U., Cho, Y., Hübers, H.-W., Prieto-Ballesteros, O., Rull, F., Buder, M., Bunduki, Y., Dietz, E., Hagelschuer, T., Kopp, E., Moral Inza, A., Pertenais, M., Rammelkamp, K., Ryan, C., Säuberlich, T., Schrandt, F., Ulamec, S., Usui, T., and Weber, I. and the RAX Team: The Raman Spectrometer RAX on the MMX IDEFIX Rover for in-situ Mineralogical Analysis on Phobos, Europlanet Science Congress 2024, Berlin, Germany, 8–13 Sep 2024, EPSC2024-988, https://doi.org/10.5194/epsc2024-988, 2024.
The Curiosity rover, part of the Mars Science Laboratory (MSL), landed in Gale crater in 2012 with the Rover Environmental Monitoring Station (REMS)[1] onboard. REMS includes an atmospheric relative humidity sensor, REMS-H, provided by the Finnish Meteorological Institute (FMI)[2]. REMS-H has continuously recorded hourly near-surface humidity conditions on Mars since landing, resulting in a rich dataset. As of May 2024, REMS-H has been operational for a little over 4100 sols; more than 11 Earth years, providing the longest relative humidity record from the surface of Mars.

Figure 1: REMS-H is located in the boom of Curiosity’s mast. Credit: NASA/JPL-Caltech/MSSS
The current calibration of REMS-H has been evaluated using new calibration measurements performed under a Martian analogue environment at DLR PASLAB (Planetary Analog Simulation Laboratory) at the German Aerospace Center (DLR)[3]. The capacitive sensor type, that has been used in all in situ measurements so far, can be sensitive not only to relative humidity but also other variables like temperature, pressure and carbon dioxide (CO2)[4].
Based on the findings a revised calibration has been developed for REMS-H. This presentation outlines both the revised calibration and the corresponding updated results. Particularly two aspects of the calibration can now be corrected using real measurement data: the RH response function between 0% and 100% rh, and the dynamic range of the sensor in CO2. Furthermore, a two-part calibration correction based on flight data analysis is described.
The revisited results section presents the revised interannual, seasonal, and diurnal variations in relative humidity, temperature, and derived water vapor mixing ratio (VMR). Comparisons with previous calibration results are also discussed. In general, the new calibration resulted in somewhat lower relative humidity values, although the difference varies. On average the difference is about 10% rh. In VMR, the difference is more prominent and temperature dependent. A couple of example sols with current and revised calibration are shown in Figure 2. The full dataset will be available in a subsequent manuscript that is currently under preparation [5].
The resulting new dataset is well aligned with orbital observations and M2020 MEDA HS observations from the same time period. Also the UH/FMI single-column model (SCM)[e.g. 6] has been used to evaluate the revised results with good agreement.
In conclusion, the recalibration effort has improved the accuracy and reliability of REMS-H data, aligning the results with orbital observations and simulation runs. While we believe that the new measurements provide a more accurate representation of humidity values on Mars, it's important to consider the relatively large uncertainty, particularly when RH levels are low, when using the data.
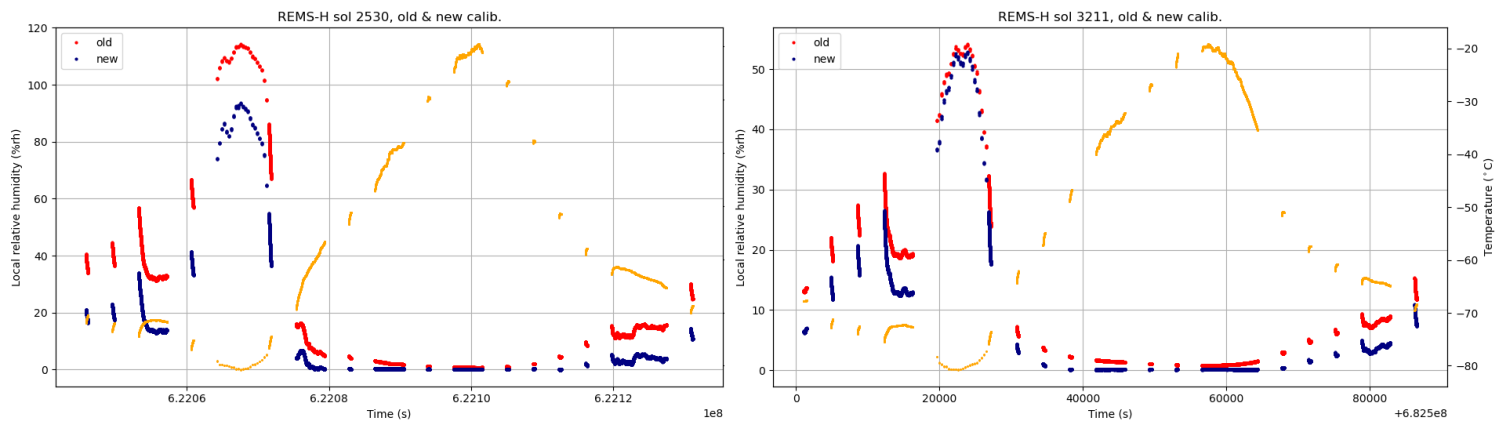
Figure 2: Example comparisons of old (red) and revised (blue) relative humidity measurements from sols 2530 (Ls=81.6°) and 3211 (Ls=87.2°) during southern winter. Sensor temperature is plotted in orange. In most sols the revised RH is lower than previously, but that is not always the case as can be seen in sol 3211 night time observations.
References:
[1] J. Gomez-Elvira et al.: REMS: The Environmental Sensor Suite for the Mars Science Laboratory Rover. Space Science Reviews 170, 583–640, 2012.
[2] Harri, A.-M. et al.: Mars Science Laboratory relative humidity observations: Initial results. Journal of Geophysical Research: Planets, 119, 2132–2147, 2014.
[3] Hieta et al.: Improving relative humidity measurements on Mars: New laboratory calibration measurements. Geoscientific Instrumentation, Methods and Data Systems, in review
[4] Lorek, A. and Majewski, J.: Humidity Measurement in Carbon Dioxide with Capacitive Humidity Sensors at Low Temperature and Pressure. Sensors, 18, 2615, 2018.
[5] Hieta et al.: REMS-H Revisited: Updated calibration and results of the humidity sensor of the MSL Curiosity. Space Science Reviews, In preparation
[6] Savijärvi, H. I., Harri, A.-M., & Kemppinen, O.: The diurnal water cycle at Curiosity: Role of exchange with the regolith. Icarus, 265, 63–69, 2016.
How to cite: Hieta, M., Jaakonaho, I., Polkko, J., Genzer, M., Savijärvi, H., Harri, A.-M., Lorek, A., Garland, S., de Vera, J.-P., Martínez, G., Fischer, E., Sebastián Martínez, E., Rodríguez-Manfredi, J. A., Tamppari, L., de la Torre Juárez, M., and McConnochie, T.: Updated calibration and results of the REMS-H humidity sensor of the MSL Curiosity, Europlanet Science Congress 2024, Berlin, Germany, 8–13 Sep 2024, EPSC2024-774, https://doi.org/10.5194/epsc2024-774, 2024.
The "Mars Magnetosphere ATmosphere Ionosphere and Space-weather SciencE (M-MATISSE)" mission, currently in Phase A study by the European Space Agency (ESA), is a Medium-class (M7) candidate. M-MATISSE aims to unravel the intricate and dynamic couplings of the Martian magnetosphere, ionosphere, and thermosphere (MIT coupling) in relation to the solar wind (i.e., space weather) and the lower atmosphere. This two-spacecraft mission involves both spacecraft carrying an identical payload suite, each following different orbits with an apocenter at 3,000 km and 10,000 km altitude, and a pericenter at 250 km altitude. The intersatellite radio link, MaCro, operates at two frequencies to probe the ionosphere and atmosphere of Mars during occultations, as one spacecraft disappears behind the planetary disk as seen from the other spacecraft. The instrumentation comprises two transceivers at UHF and S-band, stabilized by an ultrastable oscillator on both spacecraft each. The observables include the shift of the carrier frequencies caused by the bending of the radio ray path in the atmosphere/ionosphere. Onboard data pre-processing precedes the transmission of telemetry to Earth. The orbits allow about eight occultations events (ingress or egress) on average per day starting at an altitude of 1000 km.
How to cite: Martin, P., Andert, T., Imamura, T., Ando, H., Genova, A., Hahn, M., Noguchi, K., Oschlisniok, J., Peter, K., Tellmann, S., Sanchez-Cano, B., and Leblanc, F.: M-MATISSE MaCro: an intersatellite link in Mars orbit, Europlanet Science Congress 2024, Berlin, Germany, 8–13 Sep 2024, EPSC2024-703, https://doi.org/10.5194/epsc2024-703, 2024.
Introduction
The two martian moons, Phobos and Deimos, will be visited by the sample return JAXA mission MMX in 2027 (launch planned in October 2026). They orbits Mars at respectively 9400 and Deimos at 23000km, with low inclinations and eccentricities. Their heavily processed surfaces harbour a fine regolith [1]. Visible and Near-Infrared (Vis-NIR) spectral readings reveal dark and red flat spectra[2,3]. These characteristics have spawned competing hypotheses regarding their formation:
- They could be remnants of D-type asteroids, captured by Mars[3].
- They may have formed from the aftermath of an impact between Mars and a protoplanet[4].
While the former hypothesis aligns with spectral similarities observed in D-type asteroids, it fails in explaining the moons' peculiar orbits. Conversely, the latter resolves the orbital puzzle but fails in elucidating their spectral characteristics.
To unravel the origins of Phobos and Deimos, the Martian Moons Explorer (MMX) mission[5] aims to scrutinise the moons' compositions. The MMX Infrared Spectrometer (MIRS) will observe the two moons in the range of 0.9 to 3.6µm[6]. However, at a distance of 1.5AU, the moons' surfaces emit a significant thermal flux, especially beyond 2µm, necessitating correction in spectral measurements.
We present a model adapted from previous works[7] to characterise the thermal behaviour of the Martian moons in preparation of MIRS data interpretation. From their properties—such as albedo, inertia, and thermal conductivity—alongside the incoming flux, we aim to compute their surface temperatures accurately, aiding in the interpretation of MIRS spectral observations.
Illumination at the moons’ surface
Given the absence of an atmosphere and the moons small size, their surface temperatures are dictated by the absorbed flux. Consequently, the initial step in computing their physical surface temperatures involves discerning the incident flux.
We developed a model that computes the flux reaching the surface of the moons over one orbit around the Sun. The model relies on the SPICE/NAIF toolkit to computes the distance and the viewing incidence and reflection angles at the moons surfaces. It takes into account for the eclipses when Phobos or Deimos enters Mars' shadow cone, and for the reflected and emitted light on Mars in the Vis-NIR.
Additionally, our model incorporates the shape model provided by[8] to compute illumination angles on the moons' surfaces. Furthermore, it utilizes the Mars albedo map from[9].
In the model, the incidence flux at a specific point of the surface hence varies over a year with:
-solar distance,
-eclipses,
-moon orientation,
-Mars thermal emission.
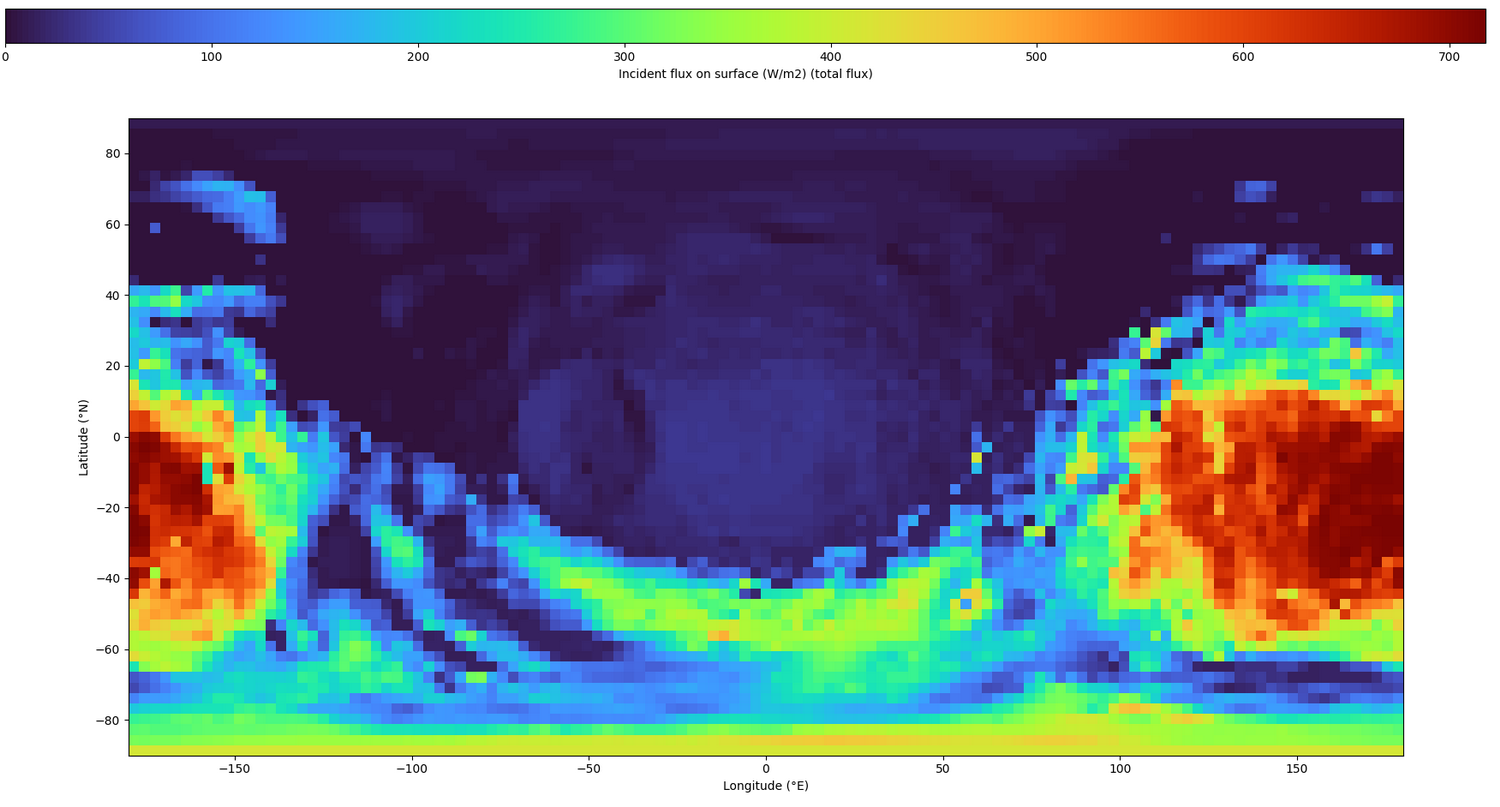
Fig.1: Incident flux at Phobos surface on the 28/07/2005.
Fig.1 illustrates the incident flux map at Phobos surface at a specific date (here on the 28/07/2005 at 09:27).
It clearly displays the sub-solar point at 175°E, and the sub-Mars point (at 0°E) where a second peak of flux arises as a consequence of the reflected and emitted light on Mars (resp. ~26W.m-2$ and ~11W.m-2).
Solving heat equations
To retrieve the surface temperature, we adapted a thermal model [7] to Phobos and Deimos.
This model solves the 1-D time-dependent heat equation for each point of the incident flux map previously computed.
It takes as input the thermal properties of the surface:
-thermal inertia
-porosity
-bulk density
It does not take into account for convection, but considering the absence of atmosphere the model is still applicable. However, it does not consider radiation, which may reveal itself important for high porosity at the surface, where conduction is reduced to punctual contacts between grains, giving more importance to heat transfer by radiation. Fig.2 presents a temperature overview at Phobos surface, computed from the incident flux map shown in Fig.1, for an inertia of 100J.m-2.s-1/2.K-1 a porosity of 0.9 and a density of 1300kg.m-3. The temperature range computed for the period of observation is similar to the results of [10]. The sub-solar point is clearly visible and reaches 295K, whereas the boreal pole is much cooler at 140K.
In this simulation, the influence of Mars was taken into account.
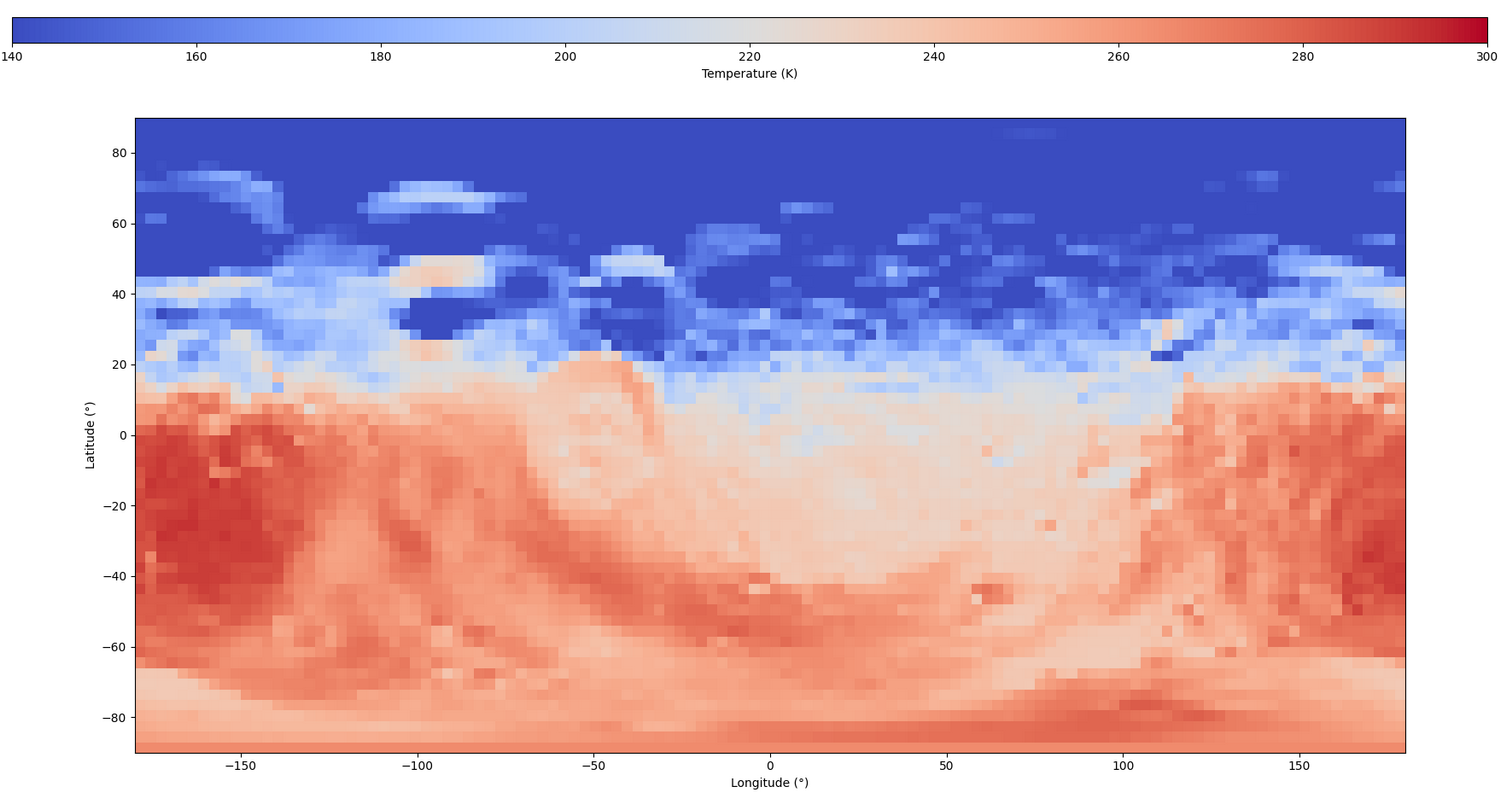
Fig.2: Phobos temperature map surface the same day.
Influence of Mars: the case of Phobos
Computing the surface temperature with and without Mars, allow to determine its influence on Phobos temperature.
Fig.3 illustrates the ΔT-map on Phobos surface on the hemisphere pointing directly to Mars. It results in an increase of almost 3.5K of the surface temperature at the sub-Mars point. This effect is far from negligible, as even this slight temperature variation lead to a significant increase of 26% in the flux emitted by Phobos' surface at 2.5µm, and may be even more important in some configurations where the polar region will be illuminated only by Mars.
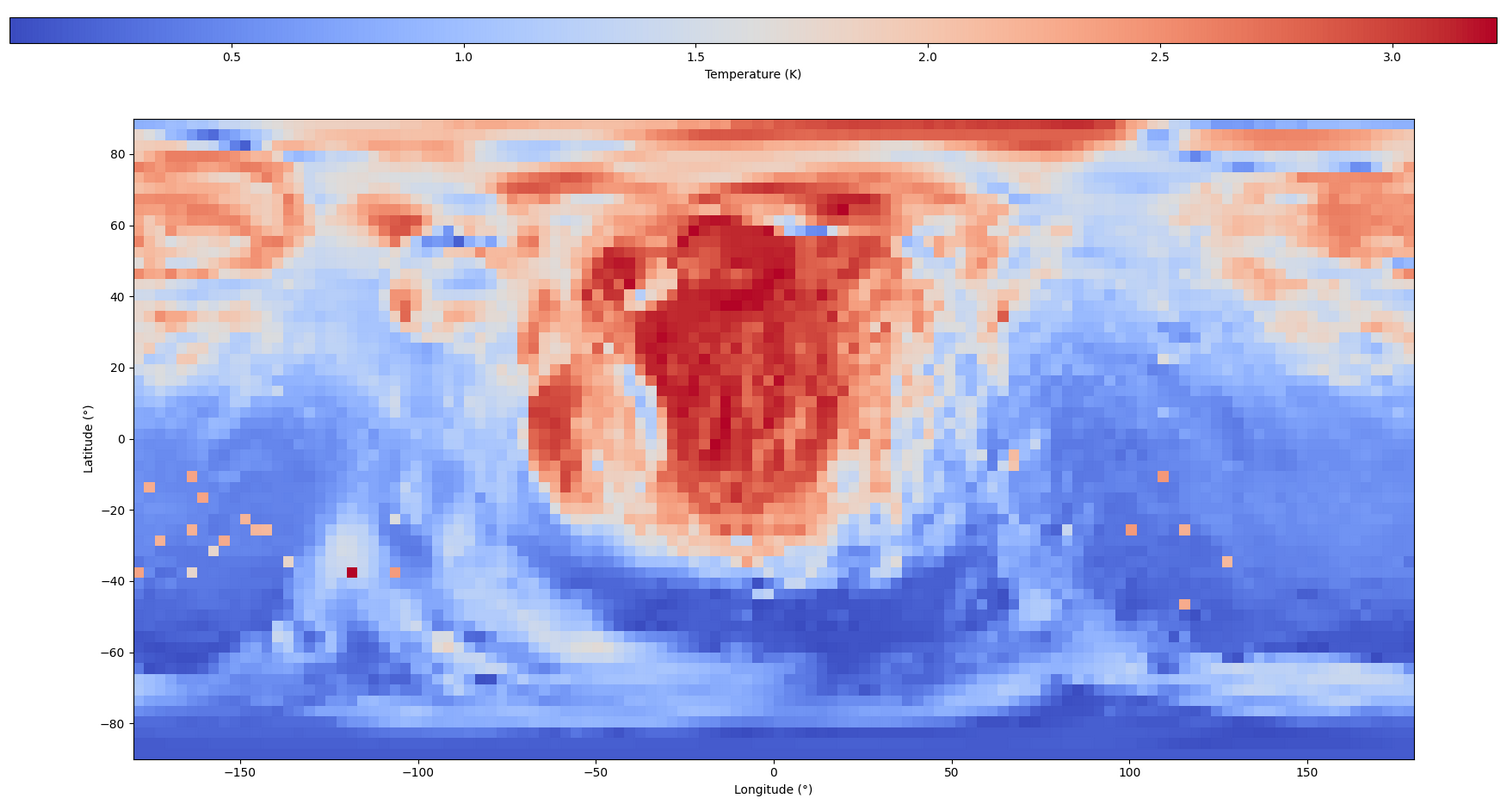
Fig.3: Mars contribution on Phobos surface temperature, up to 3.5K.
Perspectives
We show the importance of a model that takes into account for Mars’s reflection and emission.
However, this model is still under development and currently does not consider the infrared self-heating of the moons. This factor could significantly alter temperatures within craters, which might be crucial for correcting MIRS spectra, particularly in heavily cratered regions.
The temporal albedo variations of Mars (i.e. the dust storms) will also be added in the model as they will completely remove the thermal emission of Mars surface, and increase the albedo.
Acknowledgments
This work is funded by the DIM ORIGIN (Ile de France).
References
[1] Thomas, 1979
[2] Fraeman+, 2012
[3] Fraeman+, 2014
[4] Craddock, 2011
[5] Kuramoto+, 2022
[6] Barucci+, 2021
[7] Ferrari & Leyrat, 2006
[8] Willner+, 2014
[9] Christensen+, 2001
[10] Kuzmin & Zabalueva, 2003
How to cite: Sultana, R., Barucci, A., Leyrat, C., and David, G.: Modelling Martian Moons' Surface Temperature, Europlanet Science Congress 2024, Berlin, Germany, 8–13 Sep 2024, EPSC2024-237, https://doi.org/10.5194/epsc2024-237, 2024.
Introduction
Salt flats are deposits originated from the evaporation of mineral-rich bodies of water, these deposits are usually located in places with growing aridity, which results in the accumulation of chlorides where water has disappeared [1]. These deposits are usually found in the bottom of dried or ephemeral lakes, where the evaporation of water exceeds the recharge, and chlorides are precipitated. Salt flats are important planetary analogues due to their extreme environmental conditions and their resemblance to the processes occurred in other planetary surfaces, especially on Mars [2].
[3] identified several outcrops of chlorides in the martian surface using data from the Thermal Emission Imaging System (THEMIS), on board Mars Odyssey [4]. Most of these locations have been covered by high resolutions datasets, but detailed analysis of most of them remains to be done. In this work we compare one of these locations, near a crater system in west Icaria Planum (-44.22°, -125.99°), with the Uyuni salt flat in Bolivia (-20°, -67°), the largest deposits of this type on Earth, to evaluate the potential of Uyuni as an environmental analogue of Mars.
Data and Methods
For Mars, we used four types of datasets. For the visible range we utilized the global CTX mosaic and two panchromatic and colour HiRISE images [5]. We used two hyperspectral CRISM cubes to check the mineralogy [6]. We used the global MOLA DEM for terrain information (Smith et al., 2001). Finally, we checked the global THEMIS day and night global mosaic [4]. For Earth, we used Landsat-8 images [7].
To analyse the geological setting and evolution of Icaria Planum we used a hybrid mapping approach, incorporating geomorphological and spectral information in a single product [8]. We first created geomorphological units, which were later refined or modified according to the spectral information. We then compared our results with satellite images and geological maps of the Uyuni salt flat. The analysis and mapping of the data were done in the geoprocessing software QGIS with the aid of the Mappy plug-in [9].
Results and discussion
The chloride deposits in Icaria Planum are located on top of a wide and flat area, the zone is a volcanic plateau of late Noachian age according to the global map of [10]. The plateau is surrounded by impact craters, but it is the lowest terrain in the surroundings. Spectral signatures from the CRISM cubes confirm the presence of chlorides in the northern part of the plateau (Figure 1). They mainly appear as unaggregated blocks scattered in the plateau, only some spots show a continuous slab of material, which implies the material has been heavily reworked (Figure 2). Between the chloride deposits are some field of mafic dunes, which are the result of the erosion of the original lavas materials that flooded the zone.
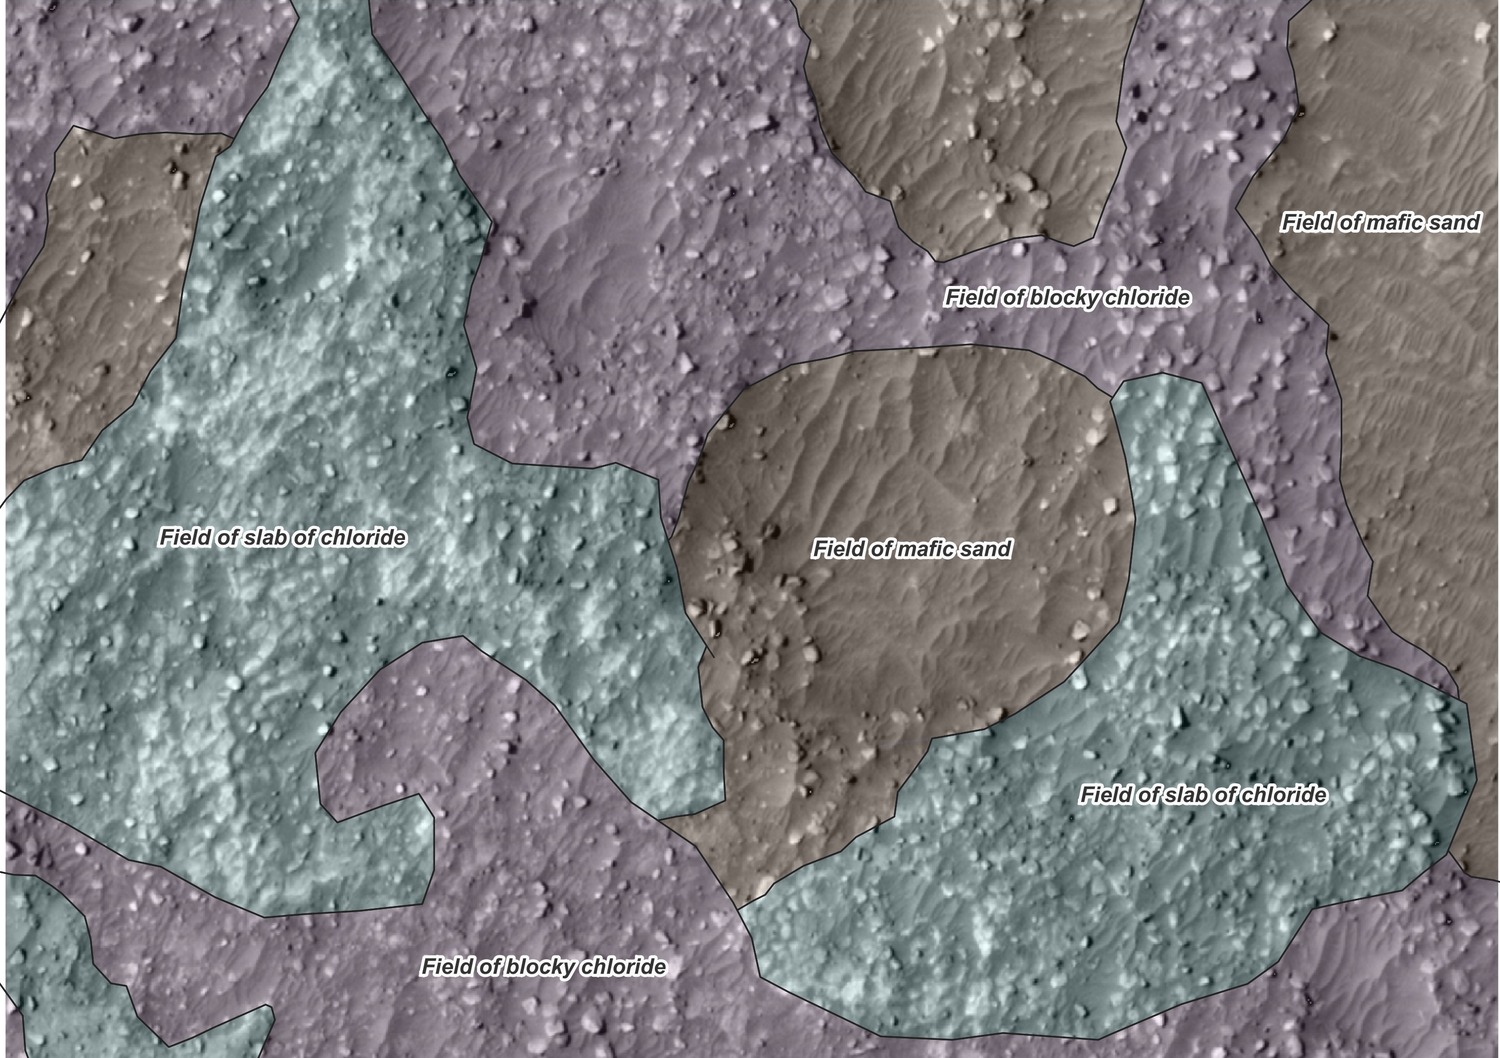
Figure 1: Spectral signature of a CRISM cube, the positive slope at 2000 nm is typical of chlorides.
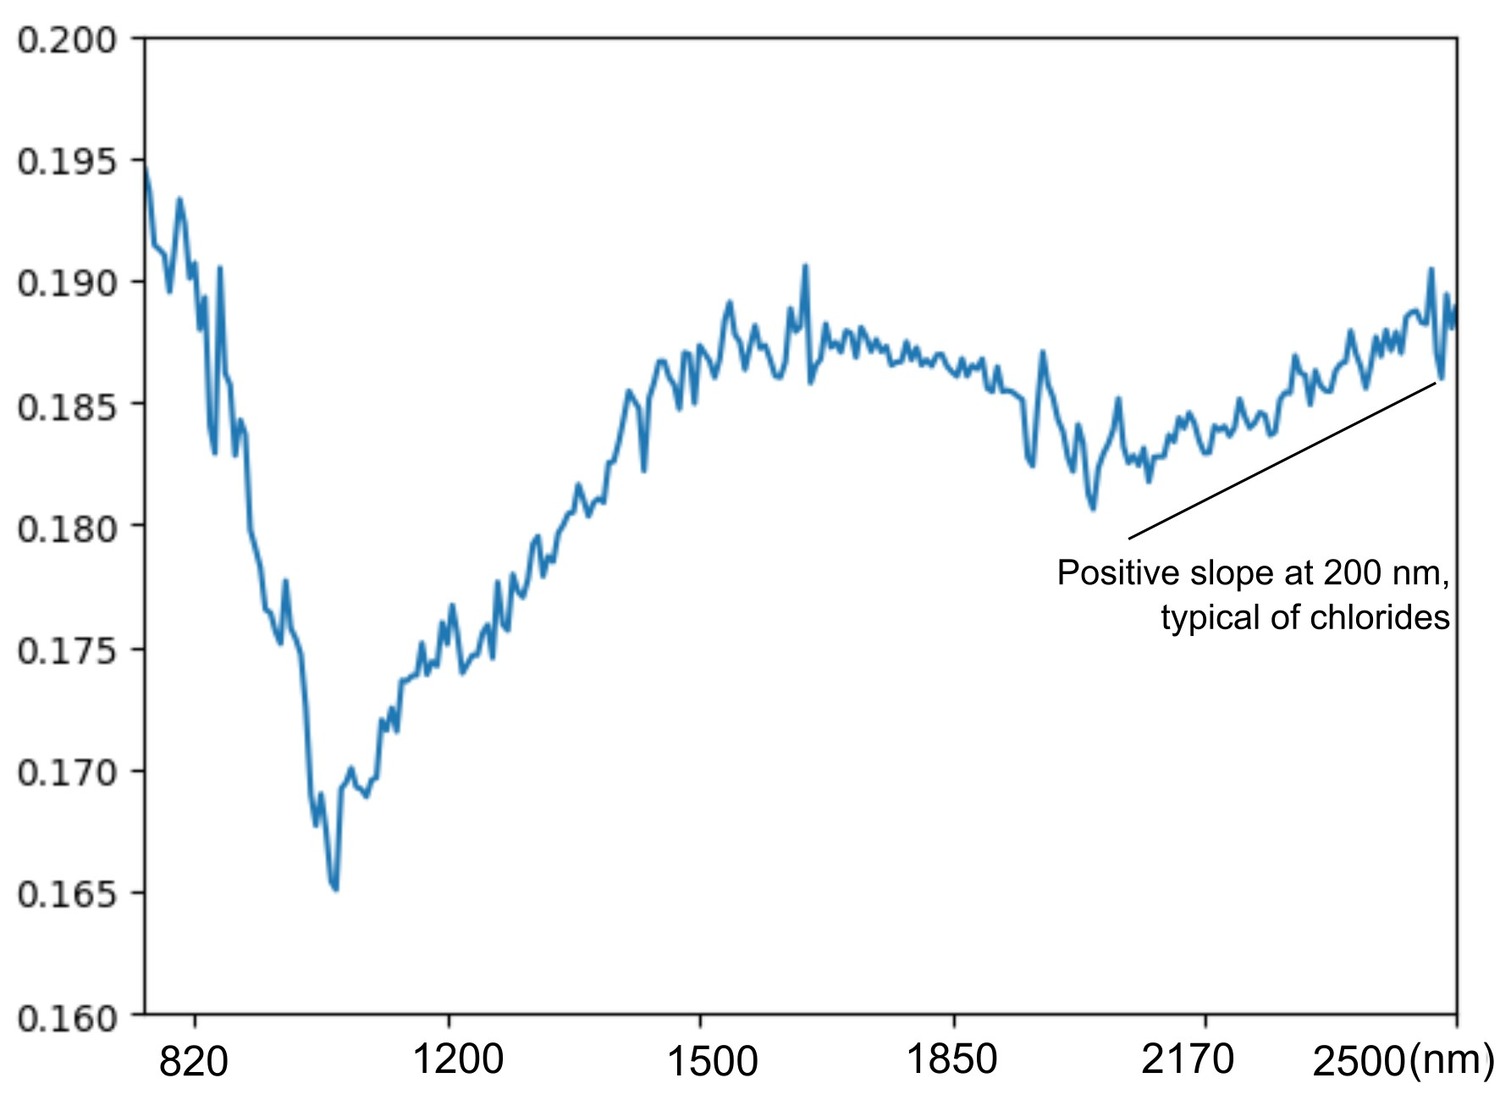
Figure 2: Sample of the typical structure of the flat area where chlorides accumulate.
This distribution of chlorides differs from the typical emplacement of martian chlorides defined by [11], these authors showed that most of the chlorides, although being local depocenters, are accumulated in slopes and closed systems. The deposits in Icaria Planum are widespread and scattered without relation to the slope, which implies they are similar to playa like deposits, as is the case in the Uyuni salt flat [12].
The Uyuni salt flat is not only similar to the Icaria Planum deposits because of its formation, Uyuni is located high in the Andean altiplano, at 2670 m.a.s.l, which creates extreme conditions regarding radiation, temperature, precipitation, and salinity [12]. This resemblance makes Uyuni an integral analogue of at least some of the chloride-rich zones of Mars.
Conclusions
The mapping of the Icaria Planum deposits showed that these chlorides are similar to the Uyuni salt flat, which showcases the importance of the last one as a planetary analogue, and the diversity of salt formation processes that acts in the martian surface.
References
[1] McKnight et al. (2023). Distinct Hydrologic Pathways Regulate Perennial Surface Water Dynamics in a Hyperarid Basin.
[2] Cabrol, N. A., & Grin, E. A. (2003). Overview on the formation of paleolakes and ponds on Mars.
[3] Osterloo et al. (2008). Chloride-Bearing Materials in the Southern Highlands of Mars.
[4] Christensen et al. (2004). The Thermal Emission Imaging System (THEMIS) for the Mars 2001 Odyssey Mission.
[5] McEwen et al. (2007). Mars Reconnaissance Orbiter’s High Resolution Imaging Science Experiment (HiRISE).
[6] Murchie et al. (2007). Compact Reconnaissance Imaging Spectrometer for Mars (CRISM) on Mars Reconnaissance Orbiter (MRO).
[7 ]Roy et al. (2014). Landsat-8: Science and product vision for terrestrial global change research.
[8] Aileen Yingst et al. (2023). A Geologic Map of Vesta Produced Using a Hybrid Method for Incorporating Spectroscopic and Morphologic Data.
[9] Penasa, L., & Brandt, C. H. (2021). europlanet-gmap/mappy: Latest (latest) [Software].
[10] Tanaka et al. (2014). Geologic map of Mars.
[11] Leask, E. K., & Ehlmann, B. L. (2022). Evidence for Deposition of Chloride on Mars From Small‐Volume Surface Water Events Into the Late Hesperian‐Early Amazonian.
[12] Risacher, F., & Fritz, B. (1991). Quaternary geochemical evolution of the salars of Uyuni and Coipasa, Central Altiplano, Bolivia.
How to cite: Jimeno Ruiz, N. and Suarez Valencia, J. E.: Mapping of chloride deposits on Icaria Planum on Mars, and its possible correlation with the Uyuni salt flat in Bolivia, Europlanet Science Congress 2024, Berlin, Germany, 8–13 Sep 2024, EPSC2024-483, https://doi.org/10.5194/epsc2024-483, 2024.
The composition of Phobos is poorly understood and its origin is still an open question [1]. There are two possible scenarios for its formation. Either Phobos is an asteroid captured by Mars, or it formed in-situ in a disc after a giant impact on Mars. The capture scenario is based on surface analysis, which shows a different composition compared to the Martian surface. However, the low density of Phobos suggests a high porosity and/or a significant amount of water ice, which could be the result of re-accretion of debris in Mars' orbit, favouring the in-situ formation scenario [2]. Therefore, if the Martian moon is formed by a giant impact on Mars, its composition will reveal the original conditions on Mars and provide insights into the formation of the planet and its young environment. On the other hand, if Phobos is a captured asteroid, its material will clarify the transport process of volatile components. For all these reasons, the acquisition of new nadir observations is essential to better characterise the composition of Phobos, which is the key to clearly explaining its origin.
As part of the payload of the 2016 ExoMars Trace Gas Orbiter (TGO) mission, the Nadir and Occultation for MArs Discovery (NOMAD) instrument [3] has been observing the Martian atmosphere [4]. Albeit being mainly conceived for trace gases investigation, in nadir mode (NOMAD-UVIS and NOMAD-LNO), the spectrometers’ suite can also measure surface features with a high spectral resolution in the UV and near-IR domain [5]. By focusing on the diffraction orders determining the instantaneous spectral ranges of LNO, these nadir observations can in principle be used to search for new spectral absorptions. In addition to the study of Mars, NOMAD is providing new nadir observations of Phobos [6].
This work focuses on the analysis of near-infrared observations using the NOMAD-LNO data set. For the near-infrared data, BIRA-IASB, with the participation of the ROB, has carried out several tests to correctly calibrate the instrument and determine the optimal observation window. Since March 2023, evaluation of the new Phobos near-infrared data, which include extended observing rates and modified diffraction order combinations, has been underway. At the time of writing, 29 observations of Phobos are available, using different diffraction order combinations. Data acquisition is concentrated on the search for carbonates (2.3 µm to 2.5 µm) and the hydrated mineral feature around 2.7 µm (2.5 µm to 2.8 µm). Due to the very low SNR of these observations, efforts have been made to reduce uncertainties: use of dark detector arrays to remove the background signal, geometric investigations to take account of illumination conditions and the combination of various NOMAD-LNO spectra. Ongoing analysis on NOMAD-LNO observations will be presented, with a quantitative comparison with previous spectral observations of Phobos [7-9] and laboratory measurements [10].
NOMAD is providing additional observations that remain crucial to planetary science. New data are indeed challenging our understanding of the composition, origin and formation of Phobos. In addition, this work is also preparing for the next Japanese mission, the Martian Moons eXploration (MMX) mission, in which the MMX spacecraft will observe and land on Phobos to collect surface samples to be returned to Earth for detailed observations of the Martian moon in particular using data collected by the infrared imaging spectrometer MIRS [11]. This work also contributes to the preparation of the next ESA Hera mission, which is scheduled to make a Mars flyby with observations of Martian Moons in spring 2025.
Acknowledgements
ExoMars is a space mission of the European Space Agency (ESA). The NOMAD experiment is led by the Royal Belgian Institute for Space Aeronomy (IASB- BIRA), assisted by Co-PI teams from Spain (IAA-CSIC), Italy (INAF-IAPS), and the United Kingdom (Open University). This project acknowledges funding by the Belgian Science Policy Office (BELSPO), with the financial and contractual coordination by the ESA Prodex Office (PEA 4000103401, 4000121493, 4000142490), by the Spanish MICINN through its Plan Nacional and by European funds under grants PGC2018-101836-B-I00 and ESP2017-87143-R (MINECO/FEDER), as well as by UK Space Agency through grants ST/V002295/1, ST/V005332/1, ST/Y000234/1 and ST/X006549/1 and Italian Space Agency through grant 2018-2-HH.0. This work was supported by the Belgian Fonds de la Recherche Scientifique – FNRS under grant numbers 30442502 (ET_HOME) and T.0171.16 (CRAMIC) and BELSPO BrainBe SCOOP Project. The IAA/CSIC team acknowledges financial support from the State Agency for Research of the Spanish MCIU through the ‘Center of Excellence Severo Ochoa’ award for the Instituto de Astrofísica de Andalucía (SEV-2017-0709).
References
[1] Fraeman, A. A., et al, 2012. JGR., 117, E00J15.
[2] Le Maistre S., et al., 2019. Icarus 321, 272-290.
[3] Neefs, E., et al, 2015. Appl. Opt. 54, 28, 8494-8520.
[4] Vandaele, A.C., et al, 2019. Nature 568, 521-525.
[5] Oliva, F., et al., 2022. JGR: Planets, 127, e2021JE007083.
[6] Mason, J. P., et al., 2023. JGR: Planets, 128, e2023JE008002.
[7] Fraeman, A. A., et al, 2014. Icarus 29, 196.
[8] Rivkin, A. S., et al, 2002. Icarus, 156, 64.
[9] Murchie, S. 1999. JGR, 104, 9069.
[10] Poggiali, G., et al, 2022. MNRAS, 516, 465.
[11] Barucci, et al., 2021. Earth Planets Space 73, 211
How to cite: Ruiz Lozano, L., Thomas, I. R., Karatekin, Ö., Poggiali, G., Oliva, F., Bellucci, G., D'Aversa, E., Carrozzo, F. G., Daerden, F., Ristic, B., Patel, M. R., López Valverde, M. A., and Vandaele, A. C.: Near infrared reflectance spectra of Phobos with the ExoMars-TGO/NOMAD-LNO spectrometer, Europlanet Science Congress 2024, Berlin, Germany, 8–13 Sep 2024, EPSC2024-925, https://doi.org/10.5194/epsc2024-925, 2024.
The objective of this series of experiments was to support the data interpretation of short period changes in insolation of planetary bodies such as solar eclipses or transits. The temperature response of Martian regolith to the transit of Phobos has been observed by InSight and interpreted in terms of layering in the near surface [Mueller et al. 2021]. Current and future mission may observe similar transits if a suitable thermal infrared instrument is available. An opportunity to observe a similar event with the roles of Mars and Phobos switched may be the rover on the Martian Moons eXplorer (MMX) carrying the Mini-RAD radiometer [Ulamec et al. 2023]. The original mission plan did not foresee a landing on the Mars facing side, but in case the plan is revised due to the changing launch date there might be a chance. There are however open questions about the interpretation of such observations using 1D models of heat conduction [e.g. Mueller et al. 2021]. These models assume that the subsurface is a continuum, while in reality the material consists of particles that are not necessarily small compared to the characteristic depth scale (skin depth) of the material responding to the changes in insolation. The Planetary Ices Laboratory has the necessary equiment to recreate such events on Earth in form of a thermal vacuum chamber and a solar simulator (Fig. 1). The chamber walls can be cooled with liquid nitrogen and a window with mirror on the chamber ceiling allows illumination of an approximately 15 cm diameter spot by the solar simulator. For our test set-up we have placed a tray of about 38x18x2cm filled with regolith analogue material in the center of the chamber (Fig. 2) i.e. encompassing the illuminated spot. The radiometer is set up within the chamber on a rotary stage that allows to move the Field of View of the instrument along the long axis of the tray. The FoV is small enough to fall within the illuminated spot and the rotary stage allows adjustments within the running setup. A small TIR camera also observed the tray. This instrument has lower temperature resolution but provides data on temperature inhomogeneity of the sample. The general approach of simulating the eclipses was to first evacuate the chamber, either refill with 5 mbar CO2 or to leave at <1e-4 mbar, to cool the chamber to below -60 °C, then to illuminate the regolith analogue material until the temperature approaches an equilibrium. After that the solar simulator shutter is closed for a certain duration to simulate an eclipse. This is a more abrupt change in insolation than in reality, however the purpose of these tests is to explore the limits to which our 1-D heat conduction models, that are based on the continuum assumption, can reproduce the response of materials where the layer thicknesses are not large compared to the particle sizes. For this the duration of the insolation excursion is much more important than the shape of the excursion, because the duration governs the depth to which the temperature response extends. The simple on-off state of the insolation will simplify the model calculations. During our time at the planetary ices lab we conducted 8 different tests, consisting of 4 different material configurations and 2 different pressures, corresponding to Mars and space. The first configuration consists of 2-4 mm Mojave Mars Simulant (MMS) filling the tray to a depth of 2 cm. This is intended to correspond to the deeper layers of Mars Regolith. In reality the particle size distribution of regolith is wider but we chose the coarser material to achieve a greater contrast between the layers in the following. The next configuration distributes MMS sieved to < 100 µm over the coarse material. The volume was chosen to correspond to 2 – 3 monolayers at this particle size. This material was chosen to represent airborne Martian dust that is continually removed by dust devils (or, infrequently, by landing rockets) and resettles during the dusty season and dust storms. The next configuration adds about 3 mm more dust by extending the rim of the tray and filling the tray to the new height. This was chosen as an example of a thicker dust layer. Finally, there is a concern that larger clasts (~cm), which can be expected to fill a significant fraction of the FoV, may affect the data inversion, as they cannot be easily modeled using a 1D model. To this end we added such clasts on top of the dust layer. The eclipses followed a sequence of durations that (with exceptions) were 5 sec, 10 sec, 20 sec, 40 sec, 120 sec. For cases where the top layer thermal conductivity was very low we extended the last eclipse to 240 sec. After each eclipse the insolation was left on for at least 3 times the eclipse durations so that temperatures could return to near the pre-eclipse values. The temperature response of the different durations extends to different depths an therefore may sense different layers with different thermophysical properties. The surface temperature was observed using a space qualified radiometer using a thermopile with a spectral bandpass from 8-14 µm at a sampling frequency of 1 Hz. The initial data analysis shows the effect of layering, but for a more complete evaluation the exact test conditions (chamber and sample temperature, solar simulator power) will have to be included in 1 D heat conduction models that are work in progress. Fitting these data under these well known conditions (boundary conditions, material properties) will show how accurate 1D continuum models are for the interpretation of short term changes in insolation such as transits. Depending on the results we will re-evaluate the interpretation of the InSight data. Acknowledgements: This project has received funding from the European Union's Horizon 2020 research and innovation programme under grant agreement No 871149.
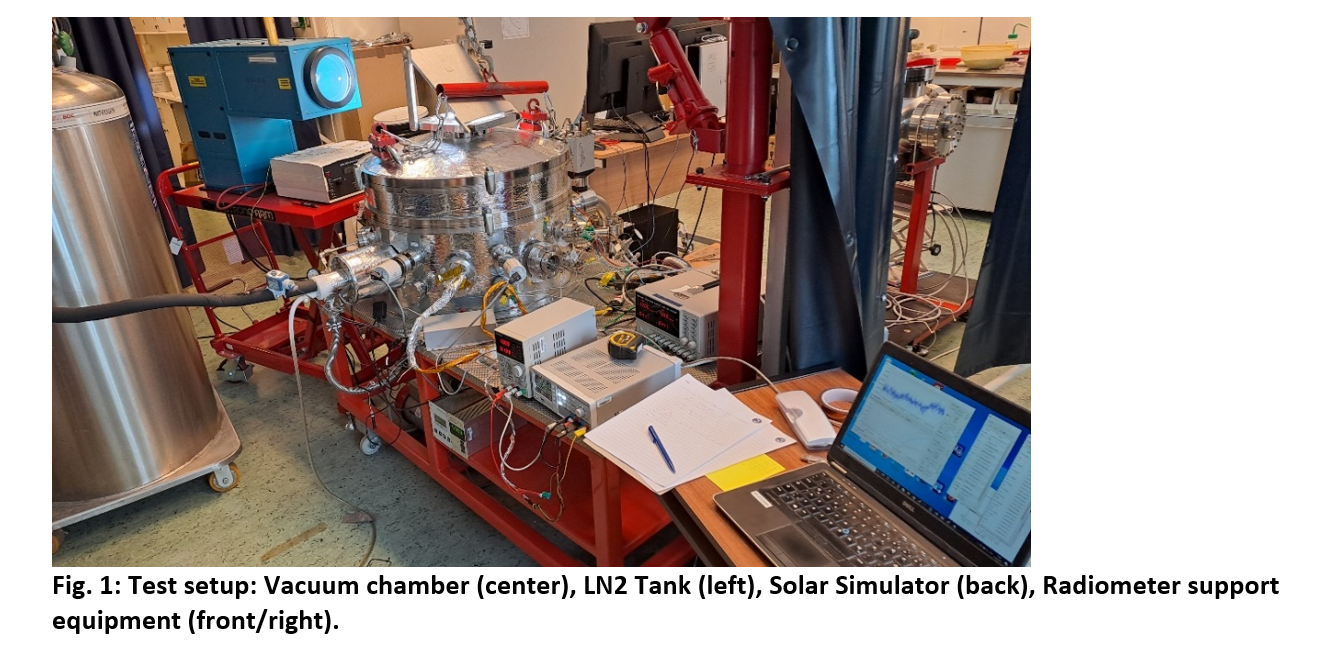
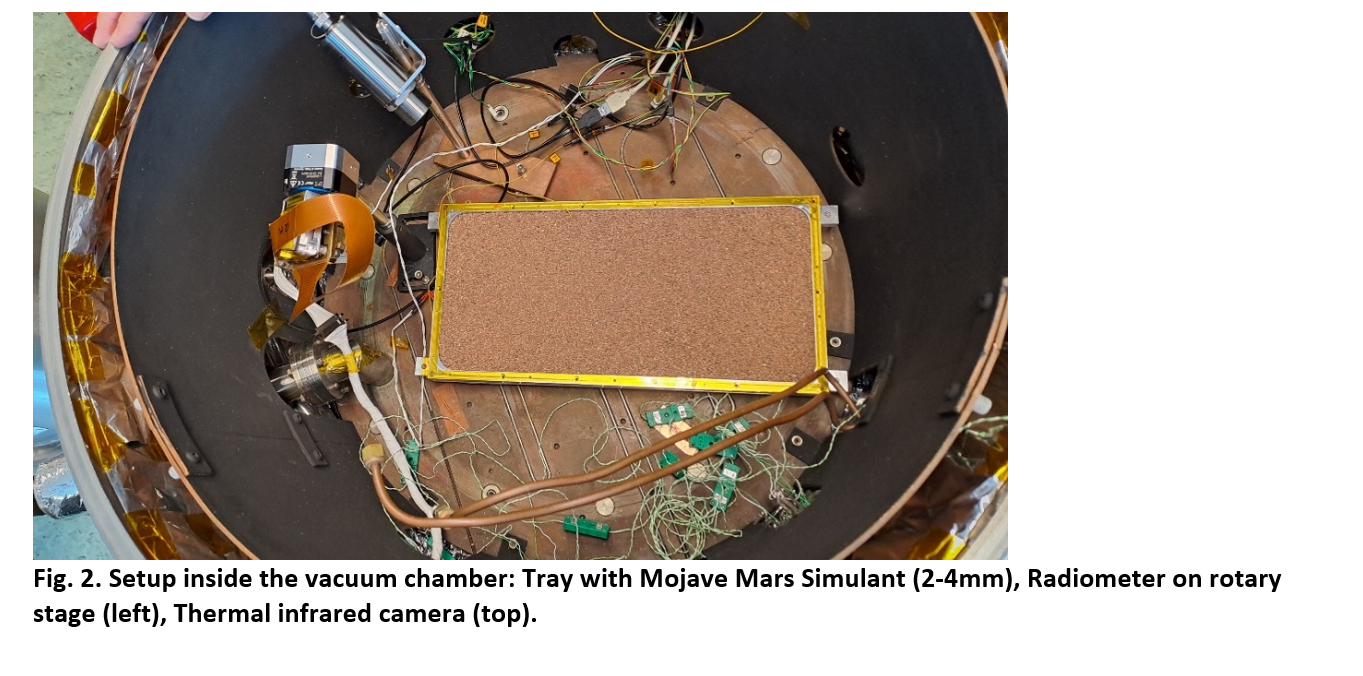
How to cite: Müller, N., Knollenberg, J., Kaufmann, E., Hagermann, A., and Grott, M.: Analogue simulation of the temperature response of Mars surfaces to Phobos transits, and vice-versa, Europlanet Science Congress 2024, Berlin, Germany, 8–13 Sep 2024, EPSC2024-1007, https://doi.org/10.5194/epsc2024-1007, 2024.
MIRS (MMX InfraRed Spectrometer) is the imaging spectrometer (0.9-3.6 µm) [1] of the JAXA MMX (Martian Moon eXploration) mission [2]. The mission will be launched in the autumn 2026 to the Martian system, with an arrival around Mars planned in autumn 2027. The main objective of the mission is to study the two Martian moons, Phobos and Deimos, to collect samples of Phobos and bring them back to Earth in 2031. Another major objective of the mission [3] and the MIRS instrument [1] is to answer key science questions regarding the transport processes of dust and water in the Martian atmosphere [3], such as: how do local and regional dust storms form, grow and evolve? What is the diurnal behaviour of water ice clouds (formation, transport, dynamics)?
The MMX probe will be injected into a quasi-circular equatorial orbit around Mars at an altitude of about 6000 km from the surface. From this particular orbit, three different observation modes of MIRS are expected for Mars observations (see Figure 1) in addition to the limb mode: the so-called nominal mode whose purpose is to monitor up to low-medium latitudes, global mapping mode that covers most of the lighted Martian disk up to high latitudes (± 60°), and region of interest mode that provides temporal resolution (down to 15 minutes) above a chosen area. Each mode will be used to study the spatial and temporal variations of the aerosols (atmospheric dust, water and CO2 ice), and their fine diurnal variations. Indeed, the particular orbit of MMX (the second probe after Hope from EMM [4] to be in equatorial orbit) will allow MIRS to provide high-resolution spectral images in near-infrared and at very different local times, which will certainly contribute to answer to the questions addressed above. 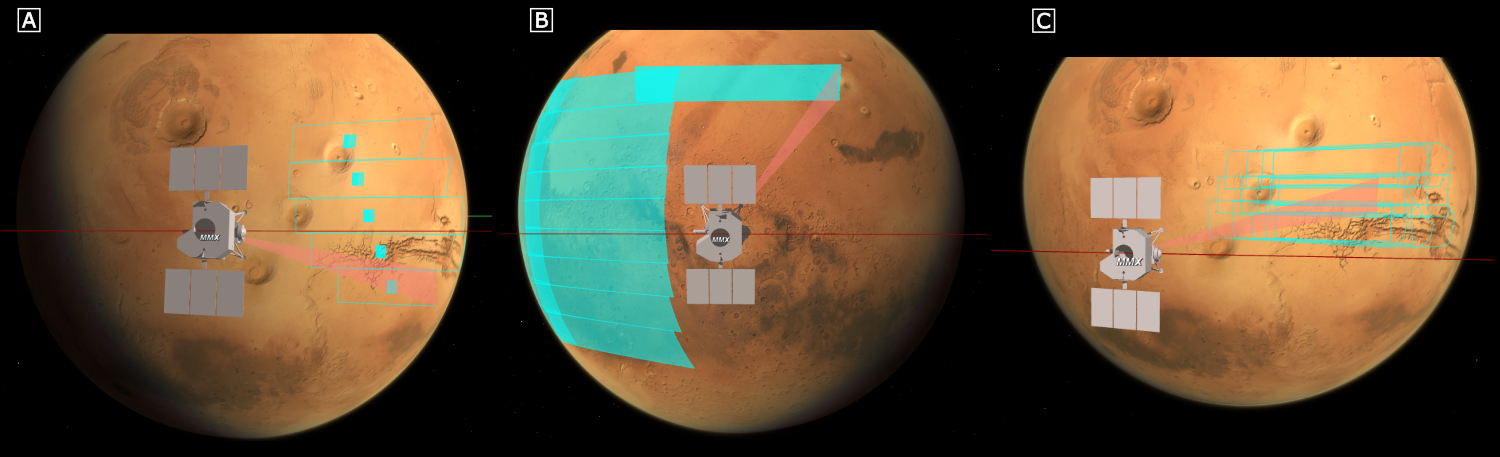
Figure 1: Illustration of the three expected observation modes of MIRS in addition to the limb mode: [A] nominal mode, [B] global mapping mode and [C] region of interest mode. Credits: CNES.
The retrieval pipeline for the MIRS observations is being prepared in coordination between the instrument team and the Mars Sub Science Team of the MMX mission. The two retrieval modules for trace gas and aerosols with nadir and limb observations are currently under development and will be validated by testing them on existing OMEGA/Mars Express data (e.g., [5], [6], [7]). In this study, focused on the aerosol retrievals, we use the DISORT (DIScrete-Ordinate-method Radiative Transfer) code [8, 9] through the pyRT_DISORT Python module [10] to simulate the expected radiance of the Martian atmosphere that MIRS will measure. First, we will present the parameter space exploration (estimated at up to 10 dimensions) of the radiative transfer model done to quantify the impact of each physical parameter (e.g., observation angles, surface albedo) on the generated spectra. Then, we will discuss the look-up table created by using different algorithms to explore the parameter space and their sampling in order to optimise the size of the look-up table (estimated at almost 75 million spectra), the computation time to create it, and to search in it. This table will be used to retrieve the aerosol properties in the flight data, which allows a faster retrieval than spectrum-to-spectrum inversion (given the large quantity of data that will be returned by MIRS). Finally, we will present MIRS images simulated with DISORT in real conditions during Phase 0 (orbit insertion and phasing), corresponding to the arrival of the MMX probe around Mars in 2027, for the different MIRS observation modes. These simulated data will be used to test the retrievals with the look-up table for future observations of Mars, get an understanding of the reachable performances, and help in defining the Phase 0 Mars set of observations.
Acknowledgments:
We thank the MMX JAXA teams for their efforts and CNES for the financial support and collaboration to build the MIRS instrument.
References:
[1] Barucci M. A. et al. (2021) Earth, Plan. and Space, 73, 211. [2] Kuramoto K. et al. (2022) Earth, Plan. and Space, 74, 12. [3] Ogohara K. et al. (2021) Earth, Plan. and Space, 74, 1. [4] Amiri H. E. S. et al. (2022) Space Sciences Reviews, 218:4. [5] Nakagawa H. et al. (2022) Seventh International Workshop on the Mars Atmosphere: Modelling and Observations, id3562. [6] Aoki S. et al. (2024), Japan Geoscience Union Meeting 2024. [7] Kazama A. et al. (2024), The Tenth International Conference on Mars. [8] Connour K. & Wolff M. (2023) GitHub repository, pyRT_DISORT. [9] Stammes K. et al. (1988) Applied Optics, 27, 2502-2509. [10] Stammes K. et al. (2017) Astrophys. Source Code Library, 1708.006.
How to cite: Leseigneur, Y., Fourgeaud, L., Gautier, T., Lasue, J., Stcherbinine, A., Bertrand, T., Sawyer, É., Jouquey, M., Théret, N., Kazama, A., Aoki, S., Doressoundiram, A., Nakagawa, H., and Barucci, A.: Preparing Martian Atmospheric Observations with MIRS, the MMX Imaging Spectrometer, Europlanet Science Congress 2024, Berlin, Germany, 8–13 Sep 2024, EPSC2024-456, https://doi.org/10.5194/epsc2024-456, 2024.
The deuterium/hydrogen isotopic ratio, D/H, is one of the main keys to understand the origin of water on several celestial bodies within the Solar System and its evolution over time in their atmospheres.
In the atmosphere of Mars, this D/H ratio is on average 5 to 6 times higher than what is found on Earth. Although water is present only in very low quantities, this particularly high deuterium enrichment, supported by various geological indicators such as the presence of valleys, indicates a wet past for the red planet. To understand this result and how the water has escaped from Mars' atmosphere, the study of HDO – the main source of changes in the D/H ratio on the planet – and its annual cycle appears essential, particularly regarding its seasonal behavior in the upper atmosphere where water vapor can be photodissociated and then ejected.
The Mars PCM (Planetary Climate Model), formerly GCM (Global Climate Model), offers numerous possibilities and effectively models the planet's topography, seasonal phenomena, transport phenomena, and cloud-related phenomena such as condensation, each playing a significant role in the behavior of HDO in the Martian atmosphere throughout the year. This model, coupled with observations and data from the ACS (Atmospheric Chemistry Suite), has shed light on the HDO cycle in recent years. However, differences still exist between the model results and the observations. This is particularly the case for the vertical distribution of water vapor in the upper atmosphere. Some improvements, concerning, for example, dust, are examined, and their effects are studied and discussed. One of them is the implementation of a more realistic dust particles size distribution in the model, following a Gaussian function. These improvements provide a better understanding of the HDO cycle as well as a more reliable completion of observations. The goal is to further understand the nature and origin of the high deuterium enrichment on the red planet.
How to cite: Petzold, G. and Montmessin, F.: Modeling the HDO cycle on Mars : focus on the dust effect, Europlanet Science Congress 2024, Berlin, Germany, 8–13 Sep 2024, EPSC2024-595, https://doi.org/10.5194/epsc2024-595, 2024.
NOMAD [1] is one of the four instruments on board ESA’s Trace Gas Orbiter and consists of three channels: SO, LNO, and UVIS. The SO channel is dedicated to solar occultation measurements and thus probes the Martian terminator. SO is an infrared spectrometer (2.3-4.3 µm) composed of an echelle grating with an acousto-optic tunable filter for the selection of the diffraction orders. SO has been regularly scanning the atmosphere of Mars from the troposphere to the upper thermosphere since the beginning of the science operations of the Trace Gas Orbiter on April 21, 2018. One diffraction order is ~25 cm-1, and six diffraction orders are scanned at each occultation. The spectral resolution is ~0.15 cm-1, and the signal-to-noise ratio is ~2500. The field of view varies between 1.6 km and 1.85 km, and the vertical sampling varies between 0.1 km and 1 km depending on the beta-angle of TGO. The vertical resolution of the profiles is ~2.5 km. Recently, in 2024, SO started to scan 12 diffraction orders per occultation, dividing the vertical sampling by two but improving the coverage of several species. The resulting vertical resolution is then reduced to a maximum of 50 %. The instrument function of SO was described in ref. [2].
The retrieval of CO2 density and temperature was described in ref. [3]. The radiative transfer computations are performed with the ASIMUT software [4]. The regularisation of the profiles is carefully fine-tuned with an iterated Tikhonov method [3, 5]. This fine-tuning of the regularisation helps to better constrain some variabilities in the profiles that are, for instance, produced by tides and gravity waves. The regularisation does not add any a priori information to the retrieved profiles.
The diffraction order 132 (2966 to 2930 cm-1) is used to infer the CO2 density and temperature in the troposphere (altitudes below ~50 km), while the CO2 density and temperature are inferred in the mesosphere (~50 to ~100 km) from diffraction orders 148 (3326 – 3353 cm-1) and 149 (3348 – 3375 cm-1). Previously, the retrievals in the mesosphere were done only with order 148 (3138 measurements from 2018 to 2023) for the thermosphere, but diffraction order 149 (2880 measurements from 2018 to 2023) is now added to the retrieval pipeline. Diffraction order 148 is sensitive to CO2 density but weekly sensitive to temperature, while diffraction order 149 is highly sensitive to temperature in addition to CO2 density. Diffraction order 165 (3708 – 3738 cm-1) is used to retrieve CO2 density and temperature in the upper thermosphere (140 – 190 km). The lower bounds of the diffraction orders are due to the saturation of the lines[3]. Nevertheless, a full profile combining GEM-Mars [6, 7] and the retrieved profiles from the diffraction orders 132 and 148 (altitudes below 100 km) is provided for the retrievals of other species whose lines are dependent on temperature.
We analysed the longitudinal variations of temperature for some profiles with very close solar longitude, local solar time, and latitude around 60°. Only non-migrating tides (non-synchronous with the relative position of the Sun) can be analysed as the set of profiles corresponds to tight ranges in local times: either 0 h, 9 h, or 15 h. The local times close to 0 h cover the Northern hemisphere in the first half year and the Southern hemisphere in the second half year. The local times close to 9 h and 15 h cover the Southern hemisphere in the first half year and the Northern hemisphere in the second half year. Some preliminary results concerning four sets of profiles in Martian year 35 where longitudinal variations could be inferred were presented in [8]. This analysis was now extended to more than fifty of those sets of profiles from Martian years 34 to 37. Amongst the results, we found an important wavenumber-1 structure at 9 h around LS 60° and 110° in the Southern hemisphere with very similar amplitude and phase for Martian years 35 to 37. Still, we found no structure higher than 1% of the background temperature at 15 h around LS 85° in the Southern hemisphere.
Comparisons to simulations from a GCM [6, 7] show some large differences in the amplitude of longitudinal variations in the mesosphere, especially closer to aphelion in the Southern hemisphere, showing that the dynamical processes occurring at that time might still need to be better constrained. Comparisons to the results of measurements from other instruments are ongoing to confirm those results obtained with SO.
How to cite: Trompet, L., Neary, L., Thomas, I., Aoki, S., Daerden, F., Erwin, J., Mahieux, A., Robert, S., López-Valverde, M. Á., Liuzzi, G., Villanueva, G., Brines, A., Bellucci, G., Patel, M., and Vandaele, A. C.: Study of Mars mesosphere longitudinal temperature variations from NOMAD-SO onboard ESA’s TGO., Europlanet Science Congress 2024, Berlin, Germany, 8–13 Sep 2024, EPSC2024-877, https://doi.org/10.5194/epsc2024-877, 2024.
Abstract
In this work we present an update on the analysis described in [15,21], focused on the characterization of Martian dust microphysical properties through the investigation of the TGO/NOMAD [1] UVIS and LNO channels’ combined nadir data. These observations cover ultraviolet-visible and near-infrared wavelengths respectively, an extended range that allows constraining the dust densities and sizes. Spatially and temporally coincident data are analysed through the MITRA radiative transfer (RT) tool [2,3,4,16].
Being the spectral surface albedo a key element in the RT simulations, we define a method to derive it by exploiting MEx/OMEGA data. As a by-product of this analysis, we plan to obtain a global Mars surface albedo map covering visual (VIS) and near-infrared (NIR) wavelengths.
- Introduction
Airborne dust drives the Red Planet’s thermal structure and climate [6,7,8,9,10], the distribution and circulation of atmospheric gases and has a role in triggering water ice clouds formation [5,17]. These mechanisms are affected by dust composition, abundance and microphysics. The investigation of NOMAD UVIS and LNO nadir data, can provide significant information on the properties of the integrated dust column down to the surface, hence contributing in our understanding of the evolution of Mars’ atmosphere.
- Instrument and observations
Among NOMAD’s three spectrometers [1], UVIS and LNO channels can observe in nadir geometry in the ultraviolet-visible (UV-VIS, 0.2 – 0.65 µm) and NIR (2.2 – 3.8 µm) ranges respectively. Therefore, if combined, they allow retrieving the dust microphysical properties in the whole atmospheric integrated column. We consider observations encompassing from the second half of Martian Year (MY) 34 to the first half of MY37, an extended interval within which dust global and seasonal trends can be analyzed.
- Method
UVIS data are exploited down to 0.36 μm, matching the lower wavelength of the surface albedo spectra ingested in the RT model. These are obtained by processing MEx/OMEGA data with a modified version of the SAS technique [14], nominally correcting the spectral shape from the gases and aerosols contribution. We modify the method in order to determine if the observations can be considered as aerosols-free, hence avoiding biases deriving from the assumed aerosols properties in the original correction. As far as LNO is concerned, only spectral orders from 168 to 202 are adopted [15,21], since they cover a wavelength range (2.20 - 2.55 μm) that is approximately devoid of strong absorption lines, hence allowing a reliable estimation of the spectral continuum. This way, no gases correction is required in our modified SAS.
The retrievals are performed through MITRA tool, deriving the temperature-pressures profiles from [11] and considering dust optical constants from [12,13]. A benchmarking with the ones recently published in [19] is also foreseen.
Summary
This study presents an update of the method described in [15,21], focused on retrieving Martian dust microphysical properties from NOMAD UVIS and LNO nadir observations. We updated the method for deriving the spectral surface albedo in order to reduce eventual biases introduced in the original correction.
We plan to analyze all spatially and temporally coincident UVIS and LNO observations, in order to track the evolution of dust properties in different MYs and verify how they compare to those retrieved at high altitude with NOMAD SO channel’s data [20].
Acknowledgements
ExoMars is a space mission of the European Space Agency (ESA) and Roscosmos. The NOMAD experiment is led by the Royal Belgian Institute for Space Aeronomy (IASB- BIRA), assisted by Co-PI teams from Spain (IAA-CSIC), Italy (INAF-IAPS), and the United Kingdom (Open University). This project acknowledges funding by the Belgian Science Policy Office (BELSPO), with the financial and contractual coordination by the ESA Prodex Office (PEA 4000103401, 4000121493), by the Spanish MICINN through its Plan Nacional and by European funds under grants PGC2018-101836-B-I00 and ESP2017-87143-R (MINECO/FEDER), as well as by UK Space Agency through grants ST/V002295/1, ST/V005332/1, ST/Y000234/1 and ST/X006549/1 and Italian Space Agency through grant 2018-2-HH.0. The IAA/CSIC team acknowledges financial support from the State Agency for Research of the Spanish MCIU through the ‘Center of Excellence Severo Ochoa’ award for the Instituto de Astrofísica de Andalucía (SEV-2017-0709). This work was supported by the Belgian Fonds de la Recherche Scientifique – FNRS under grant numbers 30442502 (ET_HOME) and T.0171.16 (CRAMIC) and BELSPO BrainBe SCOOP Project. US investigators were supported by the National Aeronautics and Space Administration. Canadian investigators were supported by the Canada Space Agency.
References
[1] Neefs, E., et al, 2015. Appl. Opt. 54, 28, 8494-8520.
[2] Oliva, F., et al, 2016. Icarus 278, 215-237.
[3] Sindoni, G., et al, 2013. EPSC2013.
[4] Oliva, F., et al, 2018. Icarus 300, 1-11.
[5] Vandaele, A.C., et al, 2019. Nature 568, 521-525.
[6] Kahre, M.A., et al, 2008. Icarus 195, 576-597.
[7] Korablev, O. ,et al, 2005. Adv. Space Res. 35, 21–30.
[8] Gierasch, P.G., Goody, R.M., 1972. J. Atmos. Sci. 29, 400–402.
[9] Pollack, J.,et al, 1979. J. Geophys. Res. 84, 2929–2945.
[10] Määttänen, A., et al, 2009. Icarus 201, 504-516.
[11] Millour, E., et al., 2019. EPSC-DPS 2019
[12] Wolff, M.J., et al, 2009. J. Geophys. Res., 114, E9.
[13] Wolff, M.J., et al, 2010. Icarus, 208.
[14] Geminale, A., et al, 2015. Icarus 253, 51-65.[16]Aoki, S., et al. 2019. J. Geophys. Res.: Planets,124, 3482-3497.
[15] Oliva, F., et al., 2021. 15th EPSC, EPSC2021-501.
[16] D'Aversa, E., Oliva, et al., 2022. Icarus, 371, 114702.
[17] Aoki, S., et al. 2019. JGR: Planets,124, 3482-3497.
[18] Wolff, M. et al., 2019. Icarus, 332, 24-29.
[19] Martinkainen, J., et al., 2023. APJ Suppl.Ser. 268:47
[20] Stolzenbach, A., et al., 2023. JGR Planets, 128
[21] Oliva, F., et al., 2024. XIX Congr. Naz. Sc. Pl., Bormio 2024.
How to cite: Oliva, F., D'Aversa, E., Bellucci, G., Carrozzo, F. G., Ruiz Lozano, L., Karatekin, O., Altieri, F., Daerden, F., Thomas, I. R., Ristic, B., Patel, M. R., Mason, J., Willame, Y., Depiesse, C., López Valverde, M. Á., Vandaele, A. C., and Sindoni, G.: Martian dust properties through NOMAD UVIS-LNO nadir datasets’ investigation: analysis update, Europlanet Science Congress 2024, Berlin, Germany, 8–13 Sep 2024, EPSC2024-994, https://doi.org/10.5194/epsc2024-994, 2024.
Our knowledge of the temperature structure in the upper atmosphere of Mars (understood here as upper mesosphere/thermosphere, layers between ~80 and 200 km of altitude from the surface) has significantly improved in the last decade thanks to the data provided by the MAVEN/NASA, Mars Express/ESA, and ExoMars-TGO/ESA missions [e.g. 1, 2, 3]. However, aspects such as the variation of temperatures with local time or with latitude are still poorly characterized due to the sampling limitation of the different instruments, and rely mostly on the information provided by Global Climate Models (GCMs). Recent model-data comparisons [4] show that GCMs have problems in reproducing the observed local time variation of the temperatures in the mesopause, but similar comparisons are missing at other regions in the upper atmosphere.
Here we analyze infrared spectra measured by the NOMAD instrument on ExoMars-TGO using the solar occultation technique [5] during 3 Mars years to derive CO2 density profiles, from which we build temperature profiles assuming hydrostatic equilibrium. These temperatures allow us to characterize, for example, the seasonal and latitudinal variability of the thermosphere and to study topics such as the effects of dust events on the thermospheric energy balance.
We compare the NOMAD temperatures with predictions by the Mars Planetary Climate Model (M-PCM), a state-of-the-art ground-to-exobase GCM for Mars [6, 7]. This comparison helps to alleviate the limited coverage of the NOMAD dataset by complementing the observations with predictions at other locations and times, and is useful to interpret the observed temperature variability and to validate the model.
We also compare our derived temperatures with publicly available mesospheric/thermospheric temperatures derived from other instruments and other missions, allowing a more complete local time coverage, and extending the study to a wider altitude range.
Our preliminary results show that M-PCM predicts well the temperatures in the thermosphere except in the evening terminator, when observed temperatures are about 20-30 K larger than in the model. Given that the evening terminator is strongly affected by dynamical processes, this result points to deficiencies in the circulation or tidal structure predicted by the model.
References
[1] Jain, S.K., E. Soto, J.S. Evans, et al., Thermal structure of Mars’ middle and upper atmospheres: Understanding the impacts of dynamics and solar forcing. Icarus, 393, doi:10.1016/j.icarus.2021.114703 (2023)
[2] Forget, F., F. Montmessin, J.-L. Bertaux, et al., Density and temperatures of the upper Martian atmosphere measured by stellar occultations with Mars Express SPICAM. JGR, 114, doi:10.1029/2008JE003086 (2009)
[3] López-Valverde, M.A., B. Funke, A. Brines, et al., Martian atmospheric temperature and density profiles during the first year of NOMAD/TGO solar occultation measurements. JGR Planets, 128, doi:10.1029/2022JE007278 (2023)
[4] Gupta, S., R.V. Yelle, N.M. Schneider, et al., Thermal structure of the Martian upper mesosphere/lower thermosphere from MAVEN/IUVS stellar occultations. JGR Planets, 127, doi:10.1029/2022JE007534 (2022)
[5] Vandaele, A.-C., J.J. López-Moreno, M.R. Patel, et al., NOMAD, an integrated suite of three spectrometers for the ExoMars Trace Gas Mission: Technical description, science objectives and expected performance. Space Science Reviews, 214, doi:10.1007/s11214-018-0517-2 (2019)
[6] Forget, F., F. Hourdin, R. Fournier, et al., Improved general circulation models of the Martian atmosphere from the surface to above 80 km. JGR, 104, doi:10.1029/1999JE001025 (1999)
[7] González-Galindo, F., M.A. López-Valverde, F. Forget, et al., Variability of the Martian thermosphere during eight Martian years as simulated by a ground-to-exosphere global circulation model. JGR Planets, 120, doi:10.1002/2015JE004925 (2015)
Acknowledgements:
The IAA/CSIC team acknowledges financial support from the Severo Ochoa grant CEX2021-001131-S and by grants PID2022-137579NB-I00, RTI2018-100920-J-I00 and PID2022-141216NB-I00 all funded by MCIN/AEI/10.13039/501100011033. A. Brines acknowledges financial support from the grant PRE2019-088355 funded by MCIN/AEI/10.13039/501100011033 and by ’ESF Investing in your future’. ExoMars is a space mission of the European Space Agency (ESA) and Roscosmos. The NOMAD experiment is led by the Royal Belgian Institute for Space Aeronomy (IASB-BIRA), assisted by Co-PI teams from Spain (IAA-CSIC), Italy (INAF-IAPS), and the United Kingdom (Open University). This project acknowledges funding by the Belgian Science Policy Office (BELSPO), with the financial and contractual coordination by the ESA Prodex Office (PEA 4000103401, 4000121493), by Spanish Ministry of Science and Innovation (MCIU) and by European funds under grants PGC2018-101836-B-I00 and ESP2017-87143-R (MINECO/FEDER), as well as by UK Space Agency through grants ST/V002295/1, ST/V005332/1, ST/Y000234/1 and ST/X006549/1 and Italian Space Agency through grant 2018-2-HH.0. This project has received funding from the European Union’s Horizon 2020 research and innovation program under grant agreement No 101004052.
How to cite: González-Galindo, F., Riera, C., López-Valverde, M. Á., Funke, B., Brines, A., Modak, A., Stolzenbach, A., Sanz, R., López-Moreno, J. J., Rodríguez-Gómez, J., Forget, F., Millour, E., Thomas, I., Patel, M., Bellucci, G., and Vandaele, A.-C.: Temperature variability in the upper atmosphere of Mars, Europlanet Science Congress 2024, Berlin, Germany, 8–13 Sep 2024, EPSC2024-955, https://doi.org/10.5194/epsc2024-955, 2024.
NOMAD [1] (Nadir and Occultation for MArs Discovery) is a multi-channel spectrometer onboard the ExoMars 2016 Trace Gas Orbiter (TGO), which began its observations in April 2018. Among other two (LNO and UVIS), the Solar Occultation (SO) channel covers the infrared (IR) spectrum from 2.3 to 4.3 µm (2320 to 4350 cm-1). Composed of an echelle grating in Litrow configuration, a total of 6 diffraction orders (with a typical width from 20 to 35 cm-1) are selected during each solar occultation using an Acousto-Optical Tunable Filter (AOTF) with a sample rate of about ~1 s, allowing a vertical resolution of typically 1 km. In order to optimize the information content that can be retrieved from the data, we analyzed Level 1 calibrated transmittances [2, 3] from four diffraction orders: 134 (3011-3035 cm−1), 136 (3056-3081 cm−1), 168 (3775-3805 cm−1) and 169 (3798-3828 cm−1). At the IAA-CSIC we developed processing tools specifically designed to handle and remove some systematics present in the NOMAD data, such as spectral shift and bending on the baseline of the spectra [4]. In addition, we performed an in-house characterization of the measurement noise using covariance matrices, identifying the true random component of the noise. This improvement allowed us to obtain homogeneous vertical profiles from the surface to an altitude about ~120 km. The profiles shown here have been retrieved combining two diffraction orders, this is, performing a global fit using spectra from two orders simultaneously. We combined pairs of orders 134 or 136 with 168 or 169 using them at different altitude ranges. The first two contain relatively weak absorption lines (S~10−21 cm−1/(molecule·cm−2) allowing the sample of the low atmosphere. On the contrary, the second set of orders contain strong lines close to center of the ν3 band(S~10−19 cm−1/(molecule·cm−2) which are useful to sample the upper atmosphere. This methodology is possible only when both orders have been measured during the same solar occultation, and although it limits the number of occultations available, it is necessary in order to avoid optically thick lines. Typically, we used low altitude orders (134/136) below 60 km and high altitude orders (168/169) above 60 km.
The content presented here is a follow-up work building upon several previous studies [5–8]. We extended the dataset selecting a total of 6561 occultations taken during Martian Years (MY) 34,35 and 36. We discuss detailed seasonal and latitudinal maps, showing the vertical distribution of the water vapor abundance and its variability thought the year. A summary of this work can be seen in Fig. 1, where we show the seasonal variation of all the retrieved water vapor profiles.
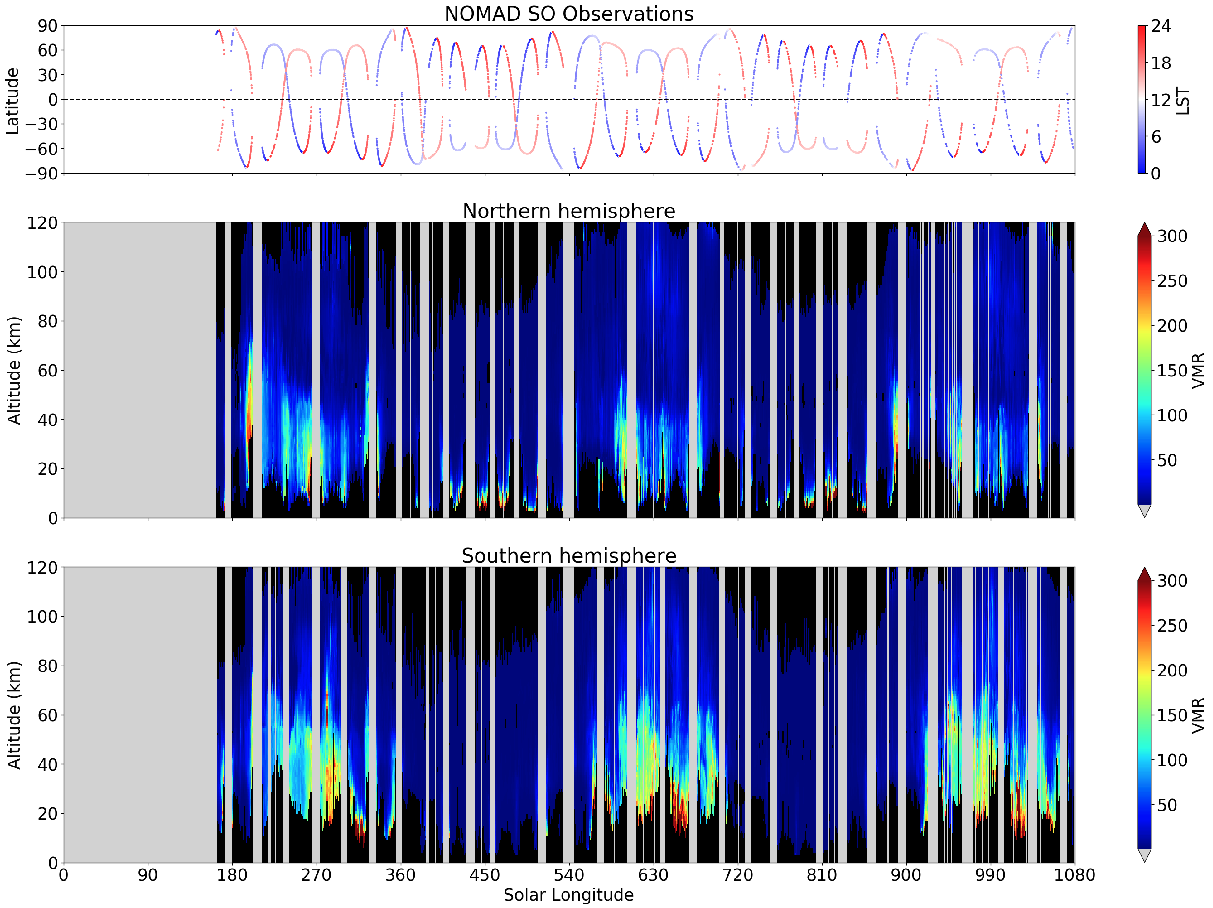
Figure 1: Vertical distribution of water vapor during MYs 34, 35 and 36 for the Northern (middle panel) and Southern (bottom panel) hemispheres. Horizontal axis shows the Solar longitude. Top panel indicates the latitude and local time of the observations.
Figure 1 clearly shows a repeated pattern in both hemispheres. Water vapor is present in a more vertically extended range during the Southern summer (perihelion season) whereas it is mostly confined to low altitudes (below 20 km) during the aphelion season, which corresponds to the Northern summer. Also, the characteristic Global Dust Storm (GDS) that took place in 2018 can be seen at the beginning of the MY 34 (LS~190º), showing a distinctive peak in water abundance in the northern hemisphere that is not repeated again.
In addition, we analyzed in detail the latitudinal distribution of water vapor during the perihelion season. We noticed a strong vertical plume at 60ºS - 50ºS injecting H2O into the mesosphere, reaching abundances of about ~50 ppmv at 100 km. We observed this event repeatedly in the three Martian years analyzed, although with inter-annual variations in both its magnitude and timing. The plume showed a weaker structure with less abundance during MY 34. We suggest that this difference respect to MYs 35 and 36 could possibly due to indirect effects of the MY 34 GDS. A summary of this analysis is presented in Fig. 2 where a storng water vapor injection can be seen in MYs 35 and 36 (panels B and C respectively).
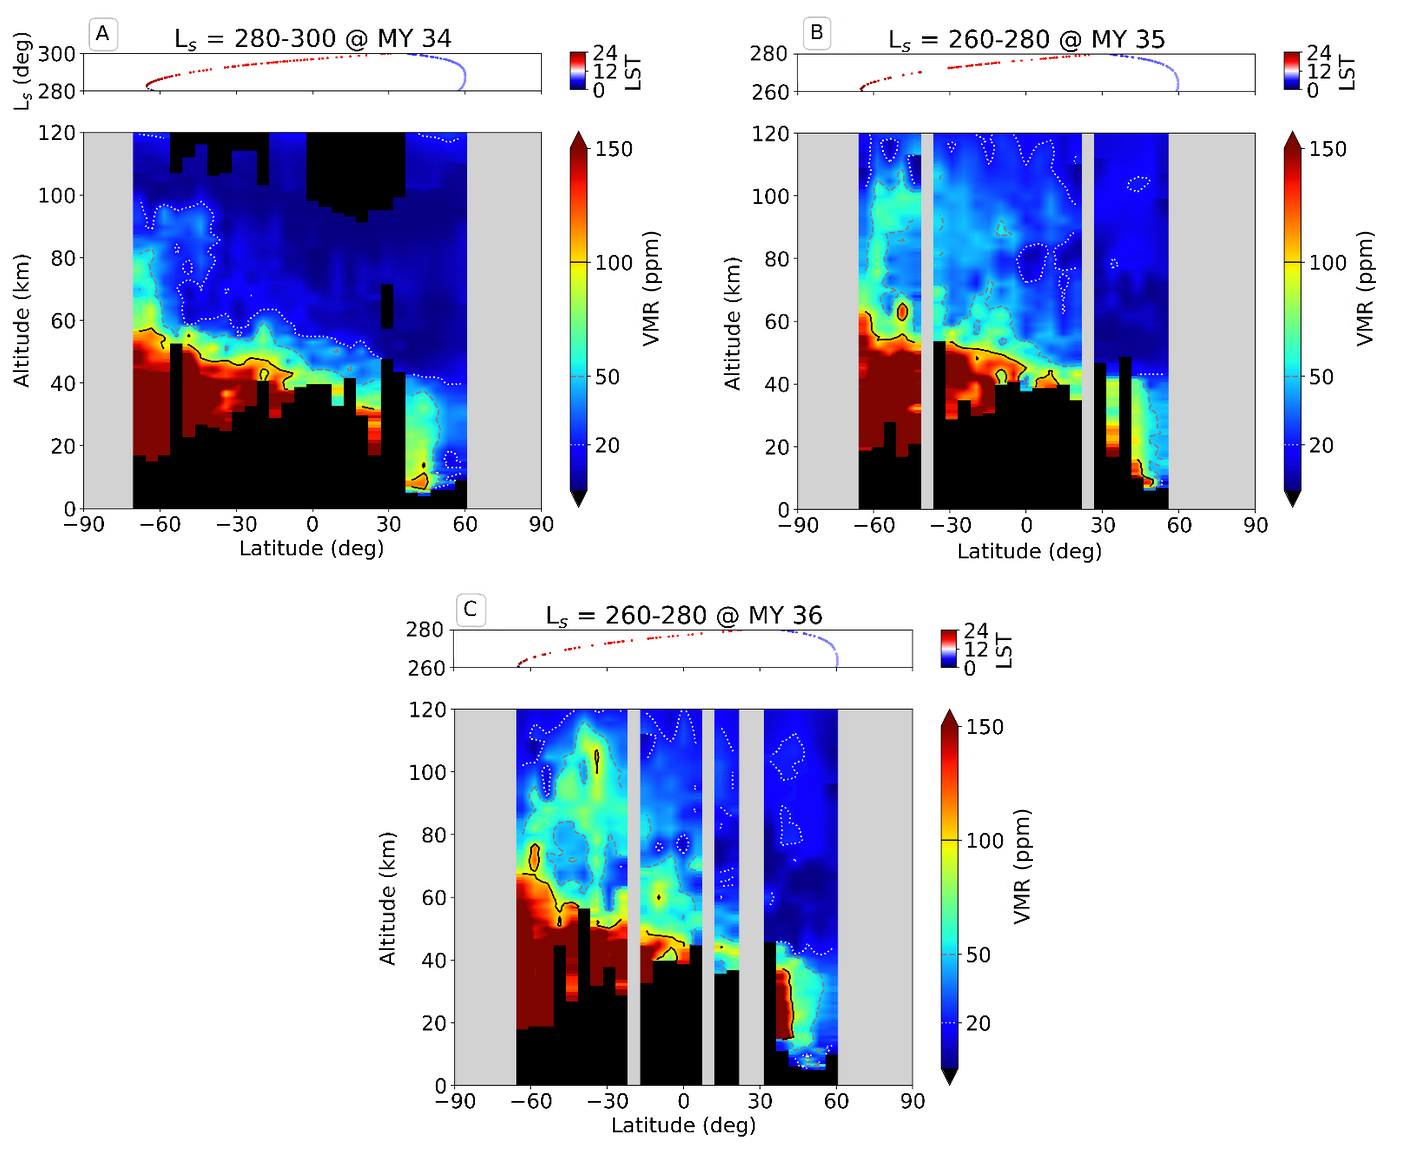
Figure 2: Water vapor latitudinal variation during LS = 260º-280º for MYs 34, 35 and 36 (panels A, B and C respectively). Dots in top panels indicate latitude, Solar Longitude and Local Solar Time of the observations.
Acknowledgments
The IAA/CSIC team acknowledges financial support from the Severo Ochoa grant CEX2021-001131-S and by grants PID2022-137579NB-I00,RTI2018-100920-J-I00 and PID2022-141216NB-I00 all funded by MCIN/AEI/ 10.13039/501100011033. A. Brines acknowledges financial support from PRE2019-088355 funded by MCIN/AEI/10.13039/501100011033. ExoMars is a space mission of the European Space Agency (ESA) and Roscosmos. The NOMAD experiment is led by the Royal Belgian Institute for Space Aeronomy (IASB-BIRA), assisted by Co-PI teams from Spain (IAA-CSIC), Italy (INAF-IAPS), and the United Kingdom (Open University). This project acknowledges funding by the Belgian Science Policy Office (BELSPO), with the financial and contractual coordination by the ESA Prodex Office (PEA 4000103401, 4000121493), by Spanish Ministry of Science and Innovation (MCIU) and by European funds under grants PGC2018-101836-B-I00 and ESP2017-87143-R (MINECO/FEDER), as well as by UK Space Agency through grants ST/V002295/1, ST/V005332/1, ST/Y000234/1 and ST/X006549/1 and Italian Space Agency through grant 2018-2-HH.0. This project has received funding from the European Union’s Horizon 2020 grant No 101004052. US investigators were supported by the NASA. Canadian investigators were supported by the Canadian Space Agency. We want to thank M. Vals, F. Montmessin, F. Lefevre, F. Forget and the broad LMD/IPSL team supporting the Mars PCM.
References
1. Vandaele, A. C. (2018). Space Science Reviews, 214.
2. Thomas, I. R. (2022). Planetary and Space Science, 218.
3. Trompet, L. (2023). Journal of Geophysical Research: Planets, 128(3).
4. López-Valverde, M. A. (2023). Journal of Geophysical Research: Planets, 128(2).
5. Brines, A. (2023). Journal of Geophysical Research: Planets, 128(11).
6. Aoki, S. (2019). Journal of Geophysical Research: Planets, 124(12).
7. Aoki, S. (2022). Journal of Geophysical Research: Planets, 127(9).
8. Villanueva, G. L. (2022). Geophysical Research Letters, 49(12).
How to cite: Brines, A., Lopez-Valverde, M. A., Stolzenbach, A., Modak, A., Funke, B., González-Galindo, F., López-Moreno, J. J., Sanz-Mesa, R., Aoki, S., Vandaele, A. C., Daerden, F., Thomas, I., Erwin, J., Trompet, L., Ristic, B., Villanueva, G., Liuzzi, G., Patel, M., and Bellucci, G.: Global Vertical Distribution of Water Vapor in the Martian Atmosphere for 6 years of ExoMars-TGO/NOMAD observations, Europlanet Science Congress 2024, Berlin, Germany, 8–13 Sep 2024, EPSC2024-1018, https://doi.org/10.5194/epsc2024-1018, 2024.
NOMAD [1] (Nadir and Occultation for MArs Discovery) is a multi-channel spectrometer onboard the ExoMars 2016 Trace Gas Orbiter (TGO), which began its observations in April 2018. Among other two (LNO and UVIS), the Solar Occultation (SO) channel covers the infrared (IR) spectrum from 2.3 to 4.3 µm (2320 to 4350 cm-1). Composed of an echelle grating in Litrow configuration, a total of 6 diffraction orders (with a typical width from 20 to 35 cm-1) are selected during each solar occultation using an Acousto-Optical Tunable Filter (AOTF) with a sample rate of about ~1 s, allowing a vertical resolution of typically 1 km. The high spectral resolution (λ/∆λ ~17000) and the relatively low signal to noise ratio of this instrument (~2500) make NOMAD SO suitable for the detection of hydrogen chloride HCl. This trace species, although until now considered to be a negligible compound in the Martian atmosphere [2, 3], it has been detected systematically by two instruments onboard TGO: the Atmospheric Chemistry Suite (ACS) [4] and more recently NOMAD [5]. Several works suggest the surface of Mars to be a source of chloride minerals and perchlorate salts [6], which along with interactions surface-atmosphere could allow for chlorine photochemistry happening on the martian atmosphere. On Earth, one of the main sources of HCl is the volcanic activity [7], so the detection of this species on Mars may be an indicator of active geological processes. Multiple ongoing studies are trying to characterize the climatology of HCl on Mars, currently not completely understood, looking for possible relationships between temperature and other atmospheric species such as dust or water vapor.
At the IAA we have carried out a study with the objective of identifying not only sources but seasonal variability of HCl by analyzing NOMAD spectra. This early study [8] using a simplified processing pipeline allowed us to detect HCl during the perihelion season of MYs 34 and 35, confirming previous results from [5]. Here, as a follow-up work of that study, we applied a modified version of our IAA-CSIC NOMAD processing pipeline [9-12] in order to increase the sensitivity required for the detection of weak HCl absorption lines, we have analyzed a total of 2536 solar occultations measured during Martian Years 34, 35 and 36. Among those modifications, we improved the methodology used for the characterization of the spectral continuum, now being able to detect systematic oscillations with amplitudes similar to the measurement noise (10-4 in transmittance). We have performed retrievals using NOMAD spectra from diffraction orders 129 (2899 - 2922 cm-1) and 130 (2921 - 2945 cm-1). In order to obtain robust HCl detections, we used the spectra from three detector bins on each ocucltation, retrieving an independent vertical profile form each bin. We present HCl vertical profiles and the seasonal variability of this species from a climatological view, revealing possible links with water vapor and dust.
Acknowledgments
The IAA/CSIC team acknowledges financial support from the Severo Ochoa grant CEX2021-001131-S and by grants PID2022-137579NB-I00, RTI2018-100920-J-I00 and PID2022-141216NB-I00 all funded by MCIN/AEI/ 10.13039/501100011033. A. Brines acknowledges financial support from the grant PRE2019-088355 funded by MCIN/AEI/10.13039/501100011033 and by ’ESF Investing in your future’. ExoMars is a space mission of the European Space Agency (ESA) and Roscosmos. The NOMAD experiment is led by the Royal Belgian Institute for Space Aeronomy (IASB-BIRA), assisted by Co-PI teams from Spain (IAA-CSIC), Italy (INAF-IAPS), and the United Kingdom (Open University). This project acknowledges funding by the Belgian Science Policy Office (BELSPO), with the financial and contractual coordination by the ESA Prodex Office (PEA 4000103401, 4000121493), by Spanish Ministry of Science and Innovation (MCIU) and by European funds under grants PGC2018-101836-B-I00 and ESP2017-87143-R (MINECO/FEDER), as well as by UK Space Agency through grants ST/V002295/1, ST/V005332/1, ST/Y000234/1 and ST/X006549/1 and Italian Space Agency through grant 2018-2-HH.0. This project has received funding from the European Union’s Horizon 2020 research and innovation program under grant agreement No 101004052. US investigators were supported by the National Aeronautics and Space Administration. Canadian investigators were supported by the Canadian Space Agency. We want to thank M. Vals, F. Montmessin, F. Lefevre, F. Forget and the broad LMD/IPSL team supporting the continuous development of the Mars PCM.
References
1. Vandaele, A. C. (2018). Space Science Reviews, 214, 1-47.
2. Hartogh, P. (2010). Astronomy & Astrophysics, 521, L49.
3. Villanueva, G. L. (2013). Icarus, 223(1), 11-27.
4. Korablev, O. (2021) . Science Advances 7, eabe4386.
5. Aoki, S. (2021). Geophysical Research Letters 48, e2021GL092506.
6. Glavin, D. P. (2013). Journal of Geophysical Research: Planets 118, 1955–1973.
7. Graedel, T. (1995) . Global Biogeochemical Cycles 9, 47–77.
8. Belmote-Gimenez, A. (2023) Mater Thesis, University of Granada.
How to cite: Brines, A., Lopez-Valverde, M. A., Stolzenbach, A., Modak, A., Funke, B., González-Galindo, F., Belmonte-Gimenez, A., Lopez Moreno, J. J., Sanz-Mesa, R., Aoki, S., Vandaele, A. C., Daerden, F., Thomas, I., Erwin, J., Trompet, L., Ristic, B., Villanueva, G. L., Liuzzi, G., Patel, M., and Bellucci, G.: HCl Variability in the Martian Atmosphere observed with ExoMars-TGO/NOMAD during 6 years of Solar Occultations, Europlanet Science Congress 2024, Berlin, Germany, 8–13 Sep 2024, EPSC2024-1125, https://doi.org/10.5194/epsc2024-1125, 2024.
To inform future Mars spacecraft development, it is important to understand the impact of new observational platforms on our ability to measure Mars’ global climate properties and to identify weather patterns in the Martian atmosphere. In particular, recent studies have begun to focus on constellations of multiple orbital weather-monitoring satellites in anticipation of new missions to Mars in the coming decade [1-4].
We present a series of Observing System Simulation Experiments (OSSEs) that were carried out to determine the optimal configuration and payload for potential future weather-monitoring satellites. This is based on the ability of a data assimilation system to reproduce the atmospheric state under clear, global dust storm, and regional dust storm conditions, while accounting for observational uncertainties.
Method
To simulate the impact of atmospheric observations that do not yet exist for Mars, we used an “Observing System Simulation Experiment” (OSSE) framework. This approach has been applied for more than 30 years to evaluate the effects of future instruments on monitoring the Earth’s climate system. Our OSSE framework had three components:
First, the Nature Run (NR) was a GCM simulation at higher-than-standard spatial resolution, which represented the true state of the atmosphere. The point of using the OSSE framework is that the true state of the atmosphere is known exactly; something that is not possible with real atmospheres. This allows us to isolate the differences between observing platforms rather than focusing on the differences between model and reality. For the NR we used the Mars PCM [5] at 2o x 2o horizontal resolution. The NR covered three meteorologically different 60o-Ls periods during Mars Year (MY) 34, shown in Fig. 1: a clear period with no dust storms (Ls = 60-120o), a period with a global dust storm (Ls = 180-240o), and a period with a regional dust storm (Ls = 300-360o).
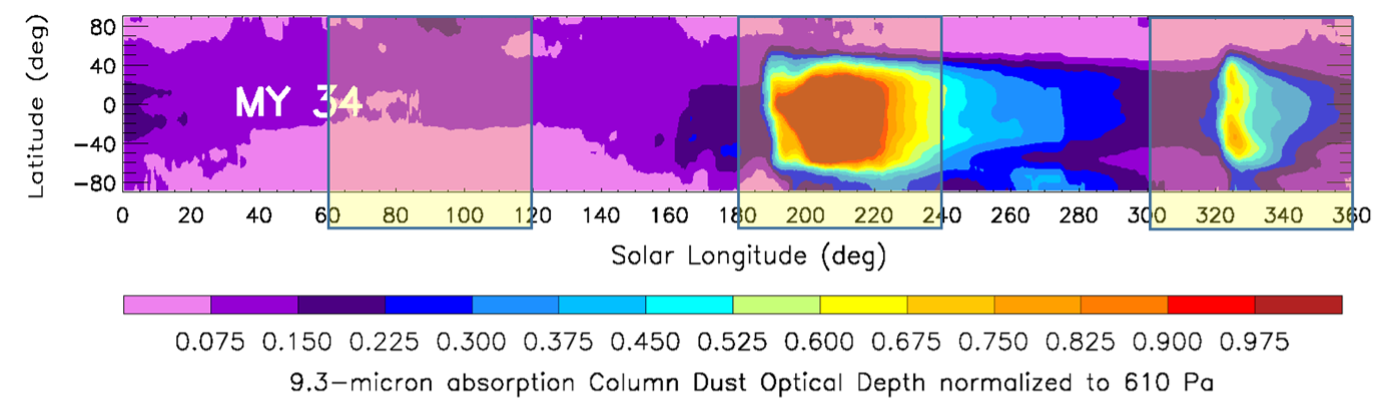
Figure 1: Mars Year 34 infrared column dust optical depth as a function of time of year and latitude [6]. The three study periods are indicated by boxes [4].
Second, the synthetic observations were created to mimic as closely as possible what an instrument would observe if it were observing the simulated Mars atmosphere. Our synthetic observations represented retrievals of atmospheric temperature profiles, dust opacity profiles, and column dust optical depth measurements made by the existing instruments MRO-MCS, ExoMars TGO-ACS-TIRVIM, and EMM-EMIRS, and proposed or desirable future instruments, such as a low-altitude near-polar orbiter that cycles through the full range of local times over 14 sols, a 5720-km altitude low-inclination orbiter, and areostationary orbiters, along with various combinations of these spacecraft. The experiments varied the instruments studied (point and imaging radiometers observing in the thermal infrared) and observational strategies (nadir, off-nadir, and limb).
Finally, the data assimilation scheme combined the observations and GCM at “standard” spatial resolution (5.625o x 3.75o) into a sequence of “reanalyses”, and we compared these reanalyses with the “true” state of the atmosphere in the NR. We used the Local Ensemble Transform Kalman Filter (LETKF) with 36 ensemble members [7]. Figure 2 illustrates the process schematically.
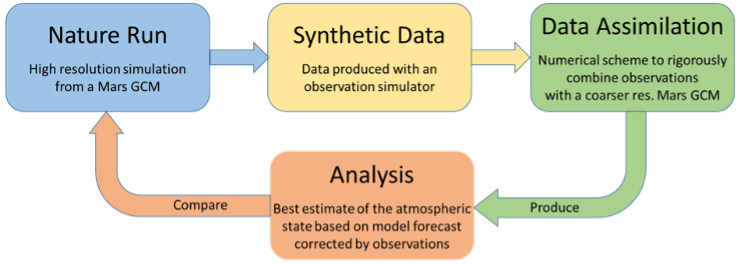
Figure 2: Flow diagram showing an Observing System Simulation Experiment for Mars [4].
Results
We quantified the accuracy of each reanalysis by computing several diagnostics, foremost among which was the root-mean-square difference (RMSD) between the reanalysis and the NR (“truth”). This was computed for observed variables (temperature, dust) and for unobserved variables (surface pressure, horizontal wind components). The latter are updated dynamically by the GCM during the assimilation process so that they converge (in principle) to a state where they are in balance with the measured temperature field, within observational uncertainty. We also studied higher order diagnostics such as the amplitude and phase of the thermal tides.
Figure 3 shows an example of the column dust optical depth RMSD throughout the global dust storm period, for several instrument configurations.
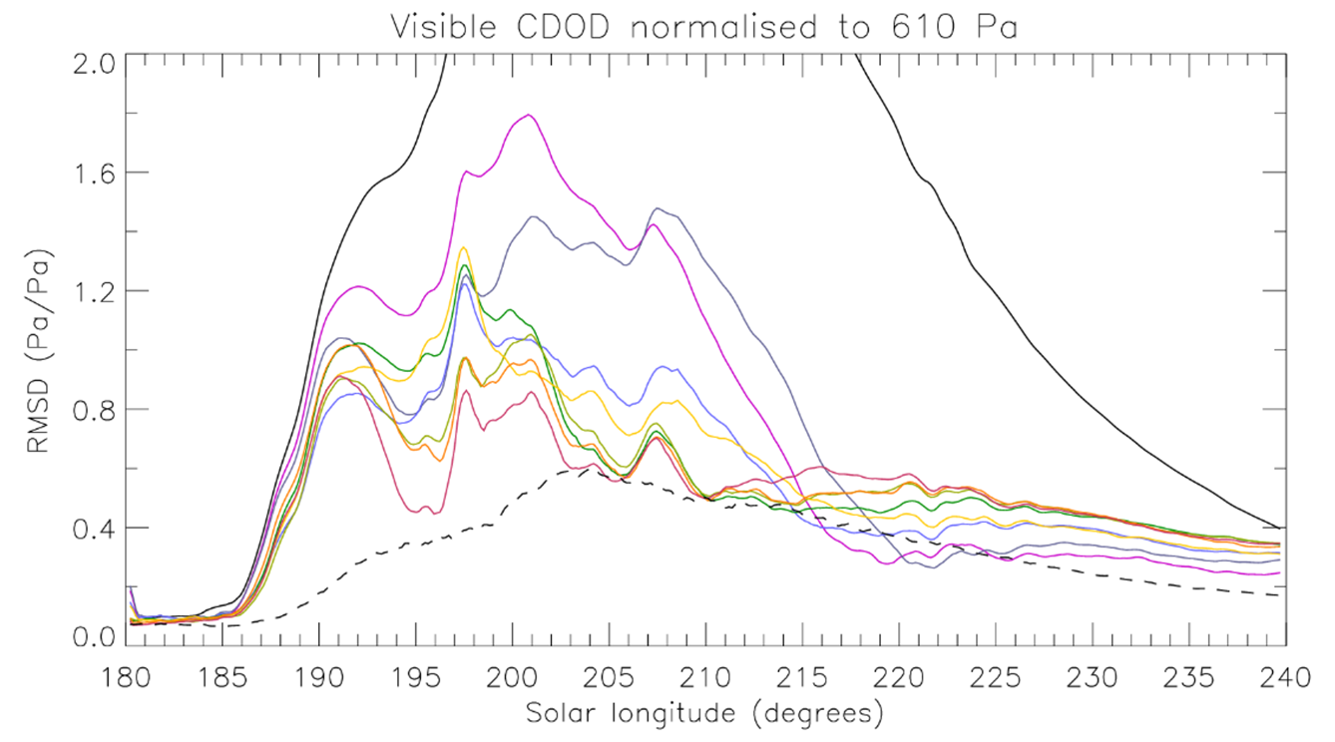
Figure 3: Visible column dust optical depth RMSD normalised to 610 Pa during the global dust storm period of Mars Year 34 [4]. The RMSD is an area-weighted, global average of the difference between the reanalysis and the Nature Run. Individual lines include a GCM simulation using a climate dust scenario with no observations assimilated (black), MRO-like observations (magenta), a near-polar low altitude orbiter (grey), three areostationary platforms (olive), and combinations of areostationary and other orbiters (yellows and greens). Some other lines show configurations that will not be included in the presentation. The dashed black line is the observational error.
In dust storm conditions, the ability of the assimilation to correctly reconstruct the weather generally increases with the comprehensiveness of the observing constellation, in terms of the number of platforms, spatial coverage, and variety of observations. While several orbital configurations perform equally well when looking at global or daily-averaged meteorological fields, significant differences between configurations emerge when looking at the diurnal cycle or at regional scale. Large observational uncertainties greatly affect the accuracy of the results.
Outlook
This approach can be applied to constellations of SmallSats focused on Mars weather monitoring, assuming the availability of simple payloads dedicated to temperature and dust observations. The assessment of the effect of direct wind measurements (e.g., using a Doppler LIDAR or sub-mm sounder on larger orbital platforms) and the impact on the weather forecasting capability would be valuable topics for follow-on studies.
Acknowledgments
This work was carried out partly under the ESA SWIMALONG project, contract number 4000138021/22/NL/DB. RY was supported by UAE University grants G00003322 and G00003407.
References
[1] Montabone et al. (2020), NASA White Paper, Bull. AAS, 53, 281, 10.3847/25c2cfeb.0cdca220.
[2] Montabone et al. (2020), Access2Space Workshop, JHU APL.
[3] Montabone et al. (2021), EPSC2021-625, 10.5194/epsc2021-625.
[4] Montabone et al. (2023), ESA report SWIM-OU-TN-002, contract no. 4000138021/22/NL/DB.
[5] Forget et al. (1999), JGR Planets, 104(E10), 24155-24175, 10.1029/1999JE001025.
[6] Montabone et al. (2020), JGR Planets, 125, e2019JE006111, 10.1029/2019JE006111.
[7] Young et al. (2022), JGR Planets, 127, e2022JE007312, 10.1029/2022JE007312.
How to cite: Young, R., Montabone, L., Millour, E., Paardekooper, D., Parfitt, C., and Wilson, C.: Assessing the impact of present and future orbiters on Mars weather monitoring using data assimilation, Europlanet Science Congress 2024, Berlin, Germany, 8–13 Sep 2024, EPSC2024-1029, https://doi.org/10.5194/epsc2024-1029, 2024.
The ExoMars Trace Gas Orbiter (TGO) mission is a joint venture of the space agencies ESA and ROSCOSMOS which was launched in 2016 and carries onboard instruments dedicated to studying the trace gas compositions of the Martian atmosphere. NOMAD (Nadir and Occultation for MArs Discovery) is one such instrument that housed three observing channels named UVIS (the Ultra Violet and Visible Spectrometer), LNO (Limb Nadir Occultation) and SO (Solar Occultation) to scan the Martian atmosphere in nadir and limb geometries [1]. The SO channel of NOMAD operates in the IR (Infra-Red) region of the solar spectrum in the wavelength range 2.3 – 4.3µm. The SO spectrometer contains an echelle grating which can produce diffraction patterns of multiple orders but only one order is allowed to fall onto the detector selected by an AOTF (Acousto Optical Tunable Filter) filter. Spectral region of diffraction orders from 186 – 191 contains well-separated and strong absorption lines of CO. The NOMAD-SO channel is using diverse diffraction orders to monitor the CO due to its importance in understanding the dynamics and chemistry of the Martian atmosphere. CO is produced in the upper Martian atmosphere by the photolysis of CO2 and destroyed by the hydroxyl (OH) radicals in the lower atmosphere. Hydroxyl radicals thus recycle CO into CO2. The study of the CO vertical distribution is important to understand the photo-chemical stability of the atmosphere. CO not only links the chemistry of the carbon and odd hydrogen families but is a long-lived species which also serves as a dynamical tracer.
At IAA-CSIC we have developed a preprocessing scheme to clean the NOMAD calibrated data from a number of systematics and prepare them for inversion of different atmospheric species [2,3,4,5]. Those systematics are spectral shift of the absorption lines and spectral bending which occurs due to thermally induced mechanical stress on the detector [6]. The work presented here is in continuation with our previous work on the retrievals of CO [3] wherein the retrieval scheme has been described in detail. Our previous study reveals two crucial factors that need to be considered for a correct CO retrieval, one is the saturation of spectral lines in diffraction orders 186 and 190, those used in our work to derive CO. The second one is the use of observed temperature and pressure in the retrieval rather than the climatological T/P from GCMs (general circulation model). For order 190, the absorption lines become saturated below 70 km while for orders 186, the lines remain unsaturated for most of the atmospheric region below this altitude. In the altitudes above 70 km, the absorptions in 186 are dominated by random noise but the lines in 190, due to their strength remain clear. Due to this fact, an adequate combination of these two diffraction orders is recommended for performing CO inversions from TGO solar occultation data.
In this work, we will present the improved CO vertical densities using this strategy and the impact on the CO distribution.
References
[1] Vandaele, A. C., Lopez-Moreno, J. J., Patel, M. R., Bellucci, G., Daerden, F., Ristic, B., ... & NOMAD Team. (2018). NOMAD, an integrated suite of three spectrometers for the ExoMars trace gas mission: Technical description, science objectives and expected performance. Space Science Reviews, 214, 1-47.
[2] López‐Valverde, M. A., Funke, B., Brines, A., Stolzenbach, A., Modak, A., Hill, B., ... & NOMAD team. (2023). Martian atmospheric temperature and density profiles during the first year of NOMAD/TGO solar occultation measurements. Journal of Geophysical Research: Planets, 128(2), e2022JE007278.
[3] Modak, A., López‐Valverde, M. A., Brines, A., Stolzenbach, A., Funke, B., González‐Galindo, F., ... & Vandaele, A. C. (2023). Retrieval of Martian atmospheric CO vertical profiles from NOMAD observations during the first year of TGO operations. Journal of Geophysical Research: Planets, 128(3), e2022JE007282.
[4] Stolzenbach, A., López Valverde, M. A., Brines, A., Modak, A., Funke, B., González‐Galindo, F., ... & Vandaele, A. C. (2023). Martian atmospheric aerosols composition and distribution retrievals during the first Martian year of NOMAD/TGO solar occultation measurements: 1. Methodology and application to the MY 34 global dust storm. Journal of Geophysical Research: Planets, 128(11), e2022JE007276.
[5] Brines, A., López‐Valverde, M. A., Stolzenbach, A., Modak, A., Funke, B., Galindo, F. G., ... & Vandaele, A. C. (2023). Water vapor vertical distribution on Mars during perihelion season of MY 34 and MY 35 with ExoMars‐TGO/NOMAD observations. Journal of Geophysical Research: Planets, 128(11), e2022JE007273.
[6] Liuzzi, G., Villanueva, G. L., Mumma, M. J., Smith, M. D., Daerden, F., Ristic, B., ... & Bellucci, G. (2019). Methane on Mars: New insights into the sensitivity of CH4 with the NOMAD/ExoMars spectrometer through its first in-flight calibration. Icarus, 321, 671-690.
Acknowledgements:
The IAA/CSIC team acknowledges financial support from the Severo Ochoa grant CEX2021-001131-S and by grants PID2022-137579NB-I00, RTI2018-100920-J-I00 and PID2022-141216NB-I00 all funded by MCIN/AEI/ 10.13039/501100011033. A. Brines acknowledges financial support from the grant PRE2019-088355 funded by MCIN/AEI/10.13039/501100011033 and by ’ESF Investing in your future’. ExoMars is a space mission of the European Space Agency (ESA) and Roscosmos. The NOMAD experiment is led by the Royal Belgian Institute for Space Aeronomy (IASB-BIRA), assisted by Co-PI teams from Spain (IAA-CSIC), Italy (INAF-IAPS), and the United Kingdom (Open University).
How to cite: Modak, A., Lopez-Valverde, M. A., Brines, A., Stolzenbach, A., Funke, B., Gonzalez-Galindo, F., Lopez-Moreno, J. J., Sanz, R., Aoki, S., Thomas, I., Erwin, J., Trompet, L., Villanueva, G., Liuzzi, G., Patel, M., and Bellucci, G.: Improving the Retrieval of Vertical Profiles of CO in the Martian Atmosphere from NOMAD Solar Occultation Observations, Europlanet Science Congress 2024, Berlin, Germany, 8–13 Sep 2024, EPSC2024-1120, https://doi.org/10.5194/epsc2024-1120, 2024.
Introduction: Martian dust storms play a crucial role in the red planet's climate and weather patterns, affecting both atmosphere and surface conditions over various time scales [1]. Orbital data help track these storms, which pose challenges for spacecraft operations and energy production [2], [3], [4] and [5]. Although monitoring is precursor, accurate forecasting is essential for future Mars exploration [6]. Supervised machine learning (SML) has already been used for automatic detection of Martian dust storms from visible images [7], [8]. However, we are not aware of SML and/or unsupervised machine learning (UML) being utilized for this application with other data sources.
Data: Montabone et al. (2015) have already identified a certain degree of interannual repeatability of large-scale dust storms from zonal mean of column dust optical depth normalized to the reference 610 Pa pressure level (CDOD@610) [9]. A novel approach relying exclusively on UML (see Figure 1) has been developed to detect, aggregate and track Martian large-scale dust events both in space and time (ST-DATMADE), from the publicly-available, multiannual (from Martian Year (MY) 24 to 36) CDOD@610 dataset described in Montabone et al. (2015, 2020) [9], [10]. Large-scale dust events are characterized by surface areas ≥1.6×10⁶ km2 and last more than two Martian days [2]. Normalized CDOD is used to remove topographic features (plains, volcanoes etc.) which affect the distribution of dust within the column. The dataset contains gridded observation maps and kriged maps from CDOD satellite retrievals. Being spatially interpolated, regularly kriged maps (see Figure 2, 1st column) are more relevant to use for SML application compared to irregularly gridded maps.
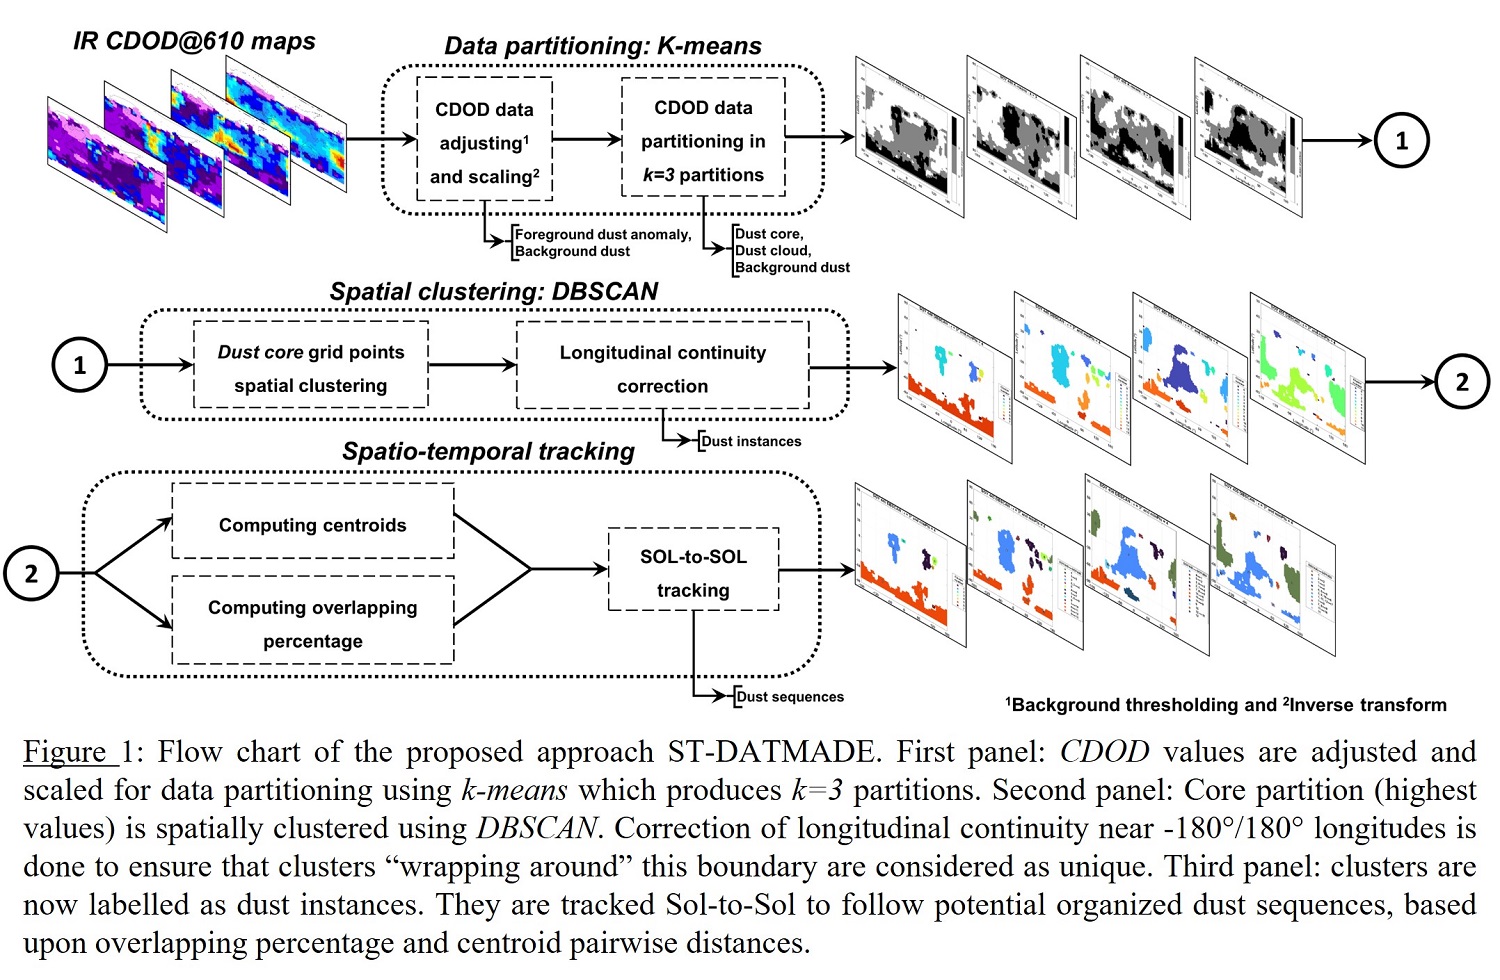
Detection: Detection of dust events involves the identification of spatio-temporal anomalies in CDOD maps. A dust event is defined as a temporal series of dust episodes characterized by foreground dust anomalies. A foreground dust anomaly refers to a significant increase in CDOD observed during a given Sol (Martian day), regardless of spatial dimension, relative to the background dust level. Background dust refers to the typical or baseline level of diffused dust present in the Martian atmosphere. Therefore, to facilitate the recognition of these anomalies, a “background/foreground” segmentation is initially performed to enhance subsequent data partitioning (see Figure 1). The CDOD data distribution is adjusted by mapping the lowest data associated with background dust into a threshold value, , calculated as follows:

The low dust loading season (LDLS) is a multiannual period between LS (Solar Longitude) = 10° and LS = 140° where there is almost no large-scale dust injection [11]. Here, the LDLS background, , is defined as the 95th percentile () of CDOD during LDLS between MY24 and MY36. It represents the multi-annual atmospheric background during the “clear” season. Additionally, the daily background, , is defined as the 33rd percentile () of CDOD at a given Sol and MY. It considers that the background dust may evolve as dust events may increase the surrounding dust opacity.
Furthermore, the adjusted dataset distribution is extremely and positively skewed, in such case an inverse transform may help to reduce the skewness, making the distribution more symmetrical and evenly distributed, particularly when addressing extreme dust events, [12]. This brings extreme values closer to average values. Within an episode of foreground dust anomaly, distinct features are identified as dust core and dust cloud. A dust core is a value-based partition where atmospheric dust injection is likely. A dust cloud is a value-based partition where atmospheric dust diffusion is likely. Grouping between background dust, dust cloud and dust core is realized through CDOD values partitioning in k=3 partitions using a widely-known UML algorithm: k-means [13]. See Figure 1 and Figure 2, 2nd column.
Aggregation: Density-Based Spatial Clustering of Applications with Noise (DBSCAN) algorithm ([14]) is used for spatial clustering of the partition with the highest CDOD values (i.e. dust core). A dust instance is an individual, isolated spatial-based cluster within the dust core partition, produced by DBSCAN (see Figure 1 and Figure 2, 3rd column).
Tracking: A series of space-coherent and time-continuous dust instances is organized into a dust sequence. To track instances from one Sol to another (Sol-to-Sol) the pairwise centroid distances of consecutive Sols is compared to a “sphere of membership” (SOM). As well as the percentage of overlapping (OLP) of instances from consecutive Sols. Thereby, it is possible to track dust event instances Sol-to-Sol and to deduce whether they form sequences (see Figure 1 and Figure 2, 4th column).
Catalog: Previous section of tracking provides Sol-to-Sol cluster assignments (instances organized in sequences) allowing to build a catalog of dust event instances tagged with an “id” with format: MY.._Sol_..._1,2,3 etc. Space-consistent and time-continuous instances are labelled with a sequence “id” as: MY.._A,B,C, etc. (see Table 1).
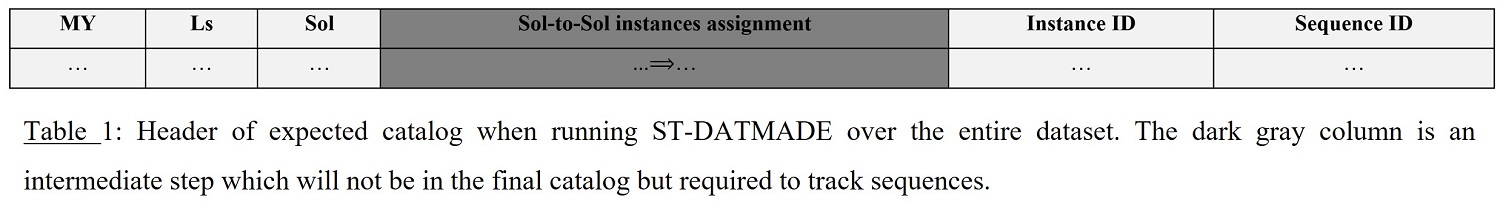
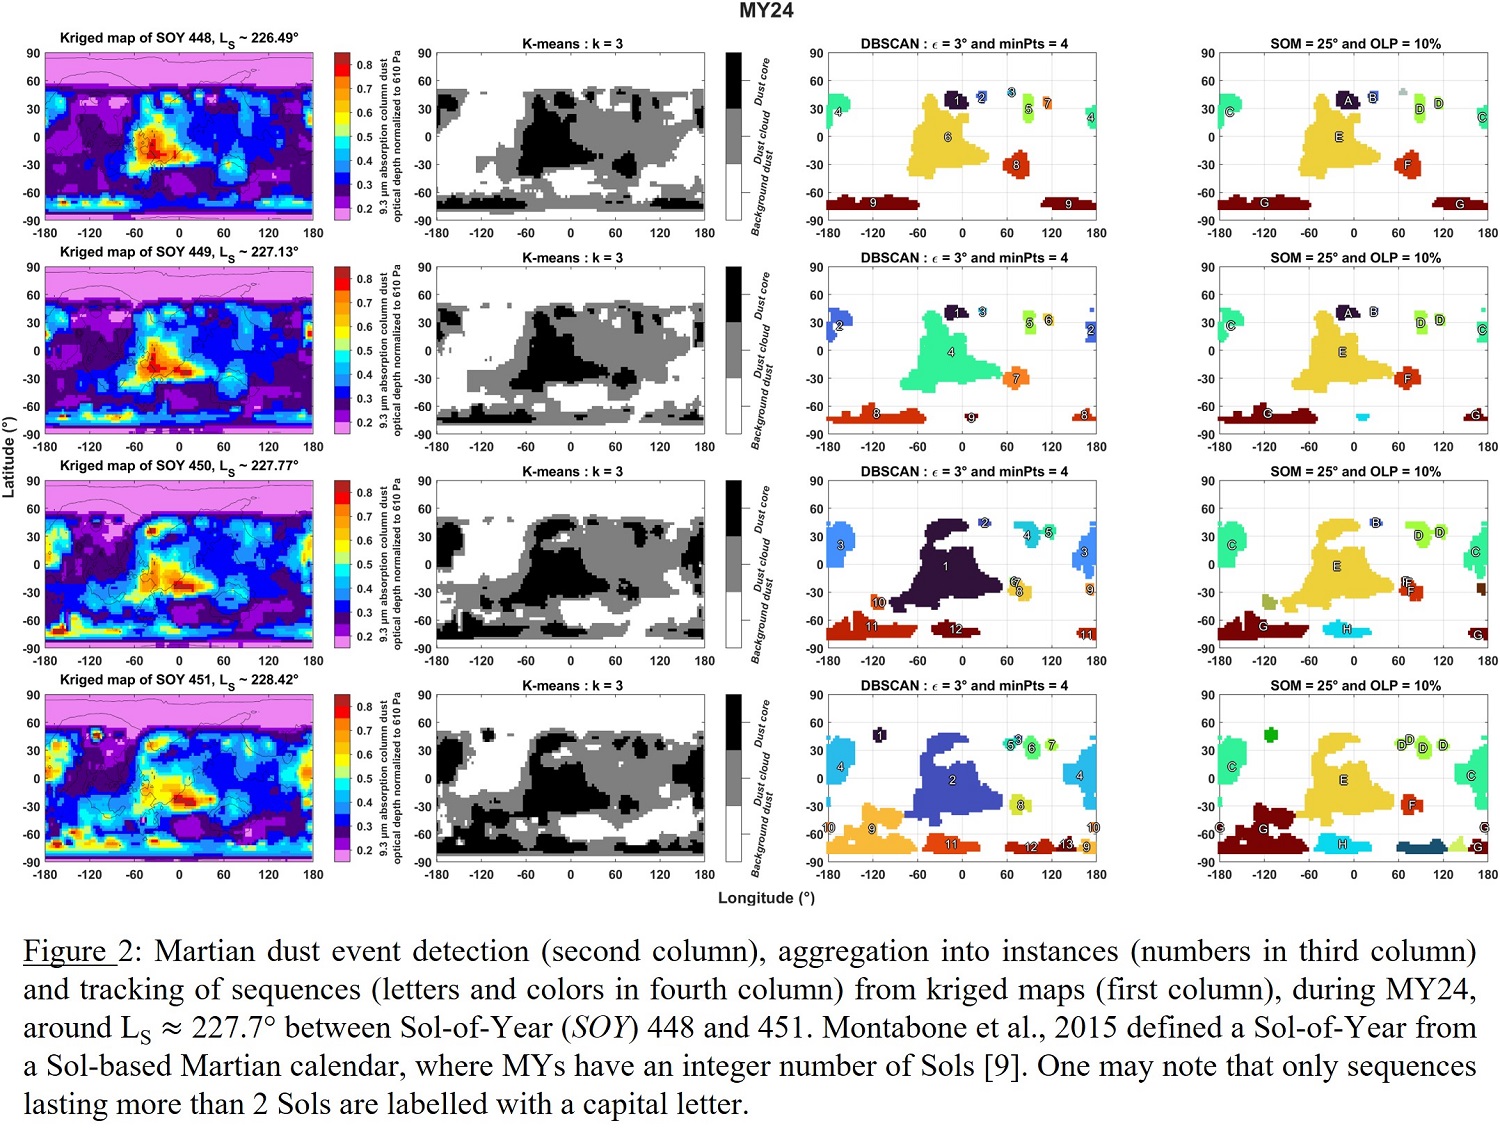
Statistics: This catalog will allow a comprehensive analysis of large-scale dust events based on CDOD data. In particular, their spatio-temporal distribution through trajectories, region of origination, LS of origination etc. as well as intensity distribution through area and CDOD statistical features (mean, median etc.).
Acknowledgments: The authors would like to acknowledge the use of the publicly available dataset on the LMD webpage: http://www-mars.lmd.jussieu.fr/mars/dust_climatology/index.html and the NASA PDS webpage:
https://pdsatmospheres.nmsu.edu/data_and_services/atmospheres_data/MARS/montabone.html.
References:
[1] L. Montabone and F. Forget, 2018, http://hdl.handle.net/2346/74226
[2] B. A. Cantor et al., 2001, https://doi.org/10.1029/2000JE001310
[3] H. Wang and M. I. Richardson, 2015, https://doi.org/10.1016/j.icarus.2013.10.033
[4] M. Battalio and H. Wang, 2021, https://doi.org/10.1016/j.icarus.2020.114059
[5] C. Gebhardt et al., 2022,
https://www-mars.lmd.jussieu.fr/paris2022/abstracts/poster_Gebhardt_Claus.pdf
[6] L. Montabone et al., 2022,
https://www-mars.lmd.jussieu.fr/paris2022/abstracts/oral_Montabone_Luca.pdf
[7] R. Alshehhi and C. Gebhardt, 2022, https://doi.org/10.1186/s40645-021-00464-1
[8] K. Ogohara and R. Gichu, 2022, https://doi.org/10.1016/j.cageo.2022.105043
[9] L. Montabone et al., 2015, https://doi.org/10.1016/j.icarus.2014.12.034
[10] L. Montabone et al., 2020, https://doi.org/10.1029/2019JE006111
[11] F. Forget and L. Montabone, 2017, http://hdl.handle.net/2346/72982
[12] B. G. Tabachnick and L. S. Fidell, Using Multivariate Statistics. Pearson Education, 2013.
[13] S. Lloyd, 1982, https://doi.org/10.1109/TIT.1982.1056489
[14] M. Ester et al., 1996, https://www2.cs.uh.edu/~ceick/7363/Papers/dbscan.pdf
How to cite: Lombard, T. and Montabone, L.: Spatio-Temporal Detection, Aggregation and Tracking of Martian Large-Scale Dust Events, Europlanet Science Congress 2024, Berlin, Germany, 8–13 Sep 2024, EPSC2024-1334, https://doi.org/10.5194/epsc2024-1334, 2024.
Introduction
Cyclic absorption of solar radiation generates oscillations in atmospheric fields. These oscillations are called atmospheric or thermal tides, which are furthermore modified by topography, surface properties, and atmospheric absorber concentration. This leads to a complex mix of sun-synchronous and non sun-synchronous tides that propagate around the planet eastward and westward. A major aspect of the study is to obtain some global insight into the Martian atmospheric ter-diurnal oscillations seen at a very small collection of lander sites using a Mars Climate Database (MCD) General Circulation Model (GCM).
Observations and Methods
Here we used hourly binned surface pressure observations by Mars Science Laboratory (MSL), InSight, Viking Lander (VL) 1, and VL2 to calculate harmonic components with a Fast Fourier Transform (FFT) for each location. A window of three sols was used to get at least one observation for each hour. The binned value was averaged in case of multiple observations per hour. Amplitudes and phases were then calculated for the middle sol of the three-sol window. The analysis was performed for each station by sliding the window over all the pressure data that was available for each platform.
For the MCD GCM surface pressure data, we used a similar approach except that one-sol window was used for each location. These global GCM fields allow for mapping of the evolving tide harmonic results and, further, decomposing these into constituent eastward and westward propagating components. That was done by taking a 2D FFT (in time and longitudes) for the diurnal pressure fields. Moreover, we used special GCM simulations with and without the effect of radiative heating by water ice clouds provided by the LMD team.
Results
MSL and InSight showed very similar seasonal cycles with highest ter-diurnal amplitudes at about Ls 60◦ , Ls 130◦ , and Ls 320◦ (Figure 1) . The latest amplitude peak corresponds to a ”C” dust storm and is also visible in the diurnal and semi-diurnal tidal amplitudes. However, during the ”A” dust storm (at about Ls 230◦) neither platforms detected amplitude spikes. Observed VL1 and VL2 ter-diurnal amplitudes seem to be lacking a clear structure, but VL1 showed quite repeatable and similar pattern as MSL and InSight during the first half of the year. In addition, global dust storms during MY 12 (1977b) and 15 were clearly detected by the ter-diurnal tide amplitude. However, ter-diurnal amplitude did not show a clear response during the 1977a planet-encircling dust storm. The global dust storm during MY 34 was visible in the MSL pressure data demonstrating the highest ter-diurnal amplitude during the MSL mission by now.
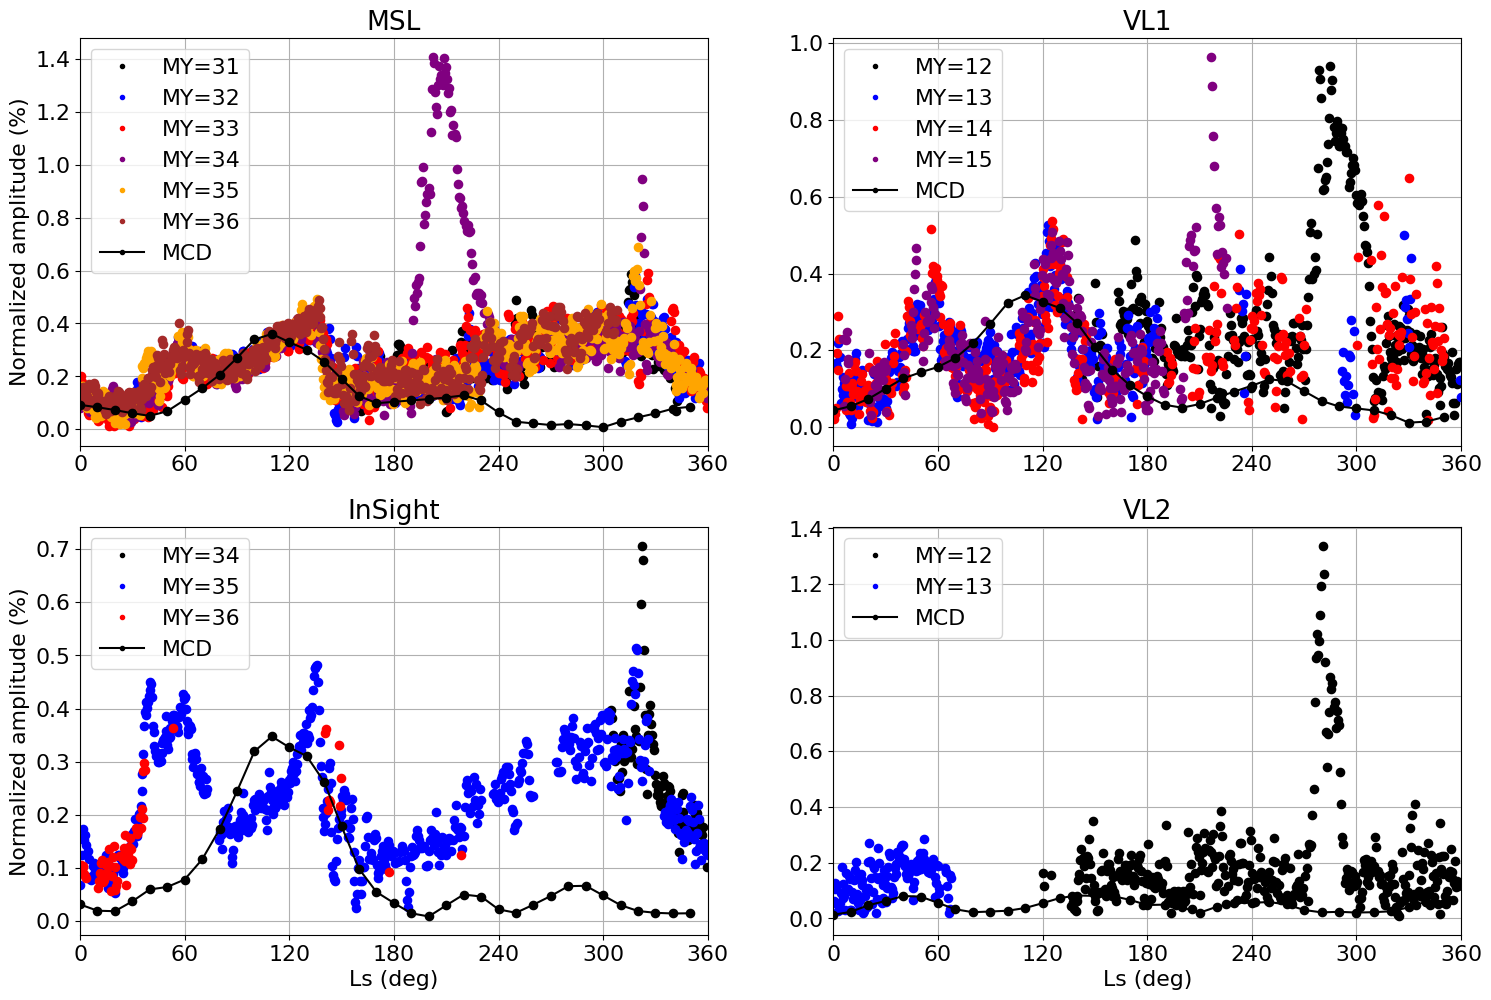 Figure 1: Ter-diurnal amplitudes (normalized by the diurnal mean pressure, %) from the MSL, InSight, VL1, and VL2 observations as well as from MCD as a function of the season (Ls).
MSL and InSight showed very similar pattern in ter-diurnal phases as well, with values between 05-07 LTST most of the year and 08-10 LTST during Ls 60◦-120◦ (Figure 2). Phases observed by the Viking Landers were lacking a clear structure, but VL1 showed some pattern at the start of the year. The phases predicted by the MCD data were in quite good agreement with observations, except for the MSL.
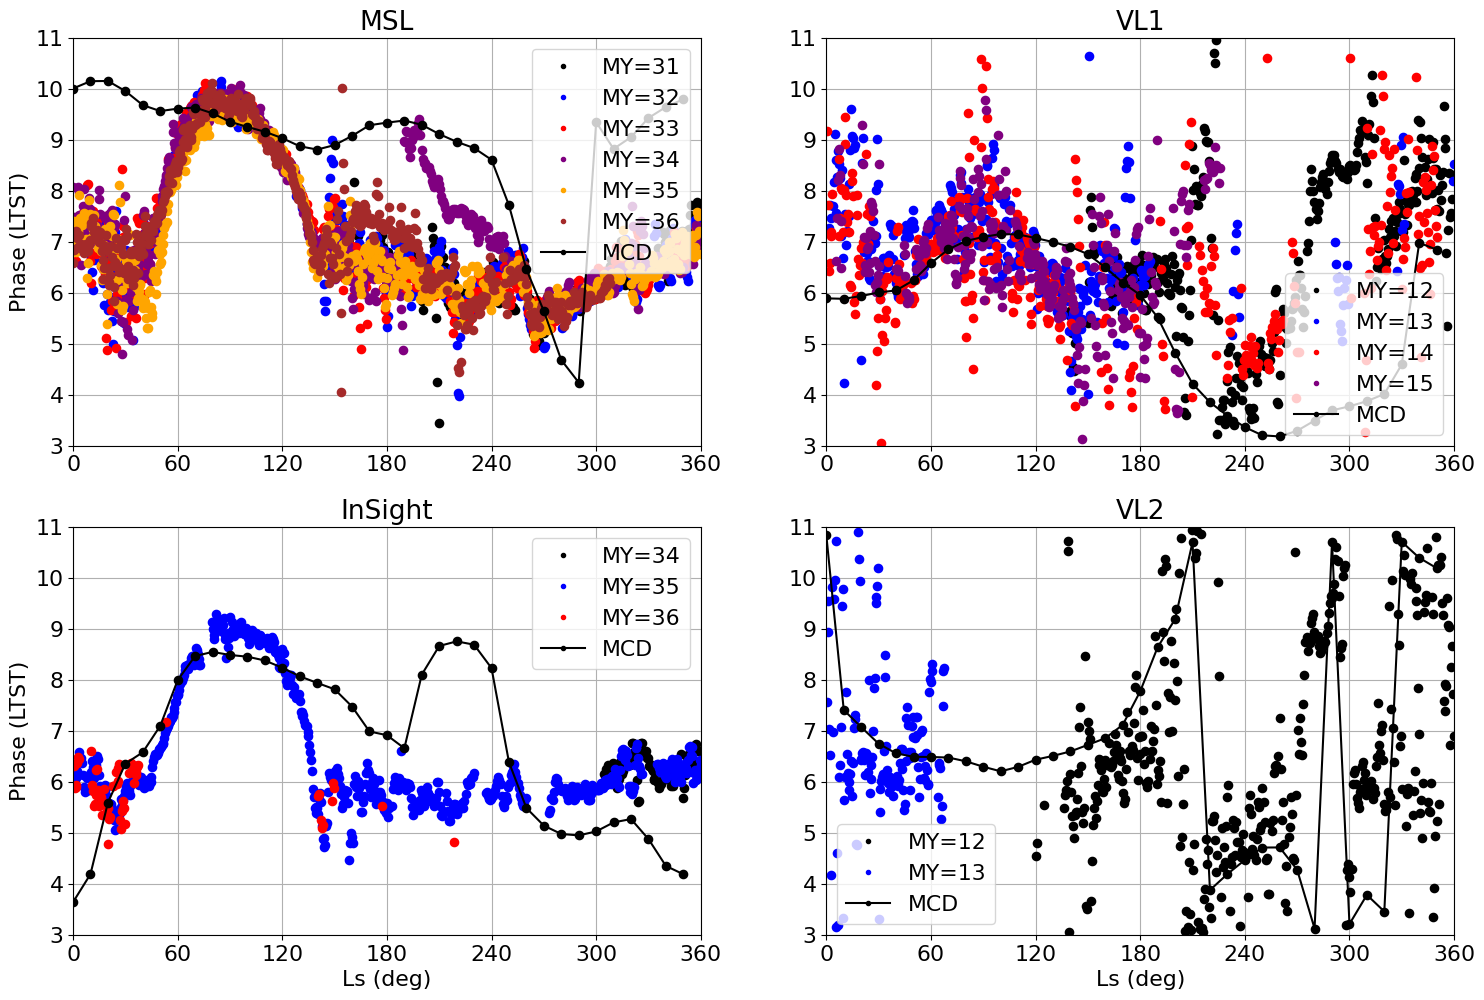
Figure 2: Same as Figure 1 but for the ter-diurnal phases (LTST).
Overall, calculations on MCD pressure data seem to underestimate ter-diurnal amplitudes throughout the year, especially during the dusty season. Globally, MCD predicted weakest amplitudes at the equinoxes, while strongest ones were predicted in summertime for both hemispheres with a clear wavenumber 6 pattern in longitude during northern hemisphere summer (Ls 90◦, Figure 3). During this time, model results suggest that the two most prominent modes are the sun-synchronous ter-diurnal tide (TW3) and an eastward propagating TE3 tide. The meridional structure of TE3 (Figure 4) mode is characteristic of a resonantly-enhanced Kelvin wave, with a uniform latitude structure.
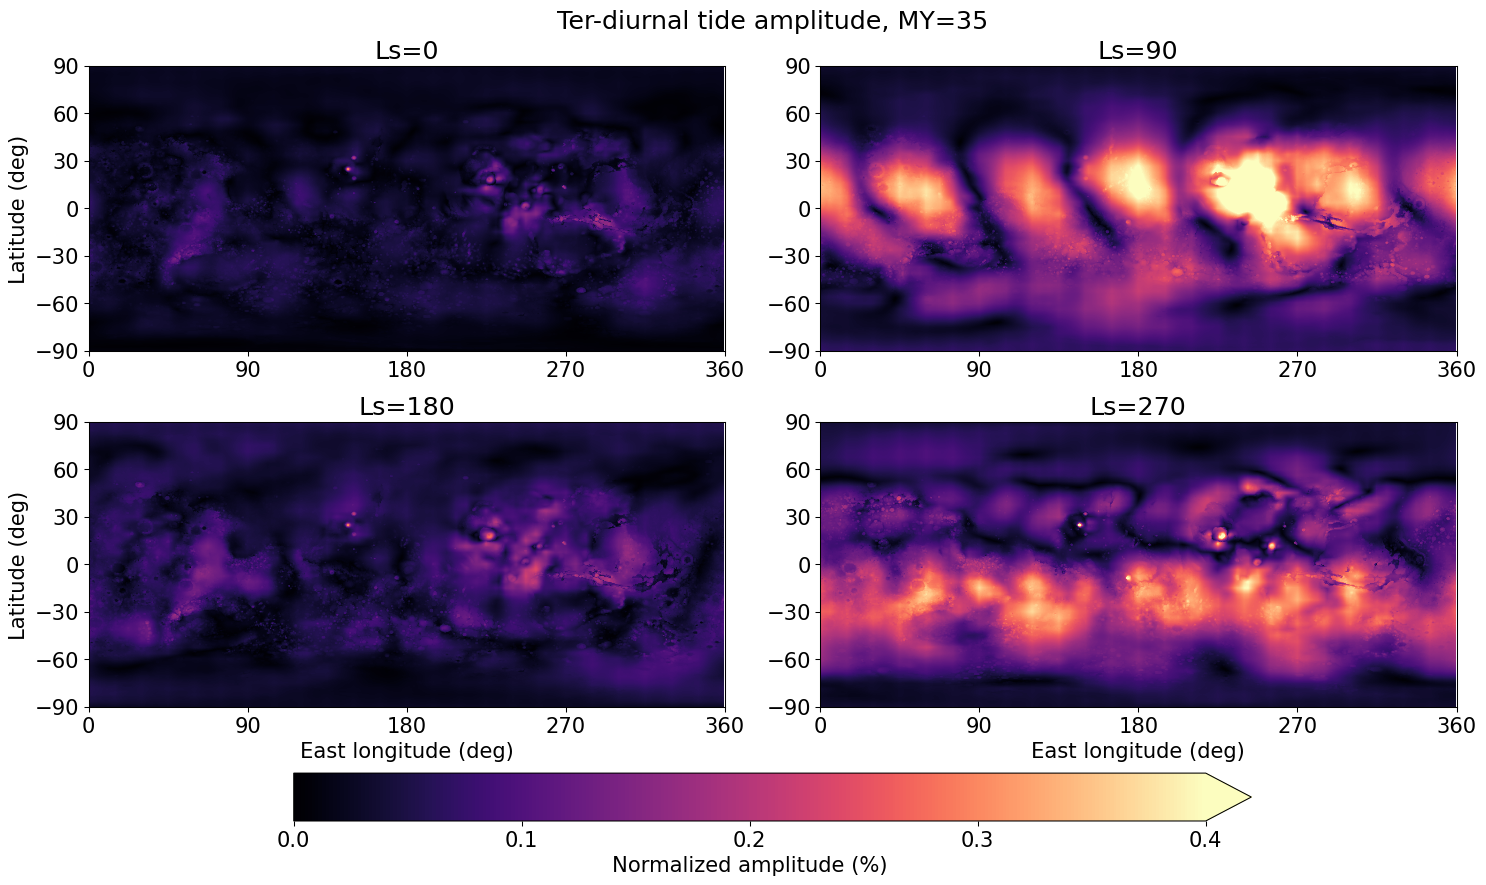
Figure 3: Global ter-diurnal tide normalized amplitudes from the Mars Climate Database for Ls 0◦, Ls 90◦, Ls 180◦, and Ls 270◦.

Figure 4: Ter-diurnal amplitudes for westward (TW) and eastward (TE) propagating zonal wavenumber 1–4 components as a function of latitude from the MCD for each season.
Additional GCM simulations with and without radiative active water ice clouds suggest that TE3 mode amplitude peaks at the equator and is much less prominent without radiatively active water ice clouds (Figure 5). Moreover, the observed delay and advance of the ter-diurnal phase (Figure 2), as well as the amplitude patterns (Figure 1) indicate that the TE3 mode has a characteristic of the resonantly-enhanced ter-diurnal Kelvin wave. This is because MSL/InSight and VL1 are separated by about 180 degrees of longitude, and therefore the phase deviation due to the Kelvin wave would be similar at the 3 locations, as seen in the data. Interaction between solar radiation and zonal wave 6 variations in topography and surface properties (thermal inertia and albedo) may generate this mode. By contrast, TW3 tide was stronger away from the equator and was present for a much longer fraction of the year (Figures 4 and 5). This component may be a result of direct solar forcing or nonlinear interaction between diurnal and semi-diurnal tides.
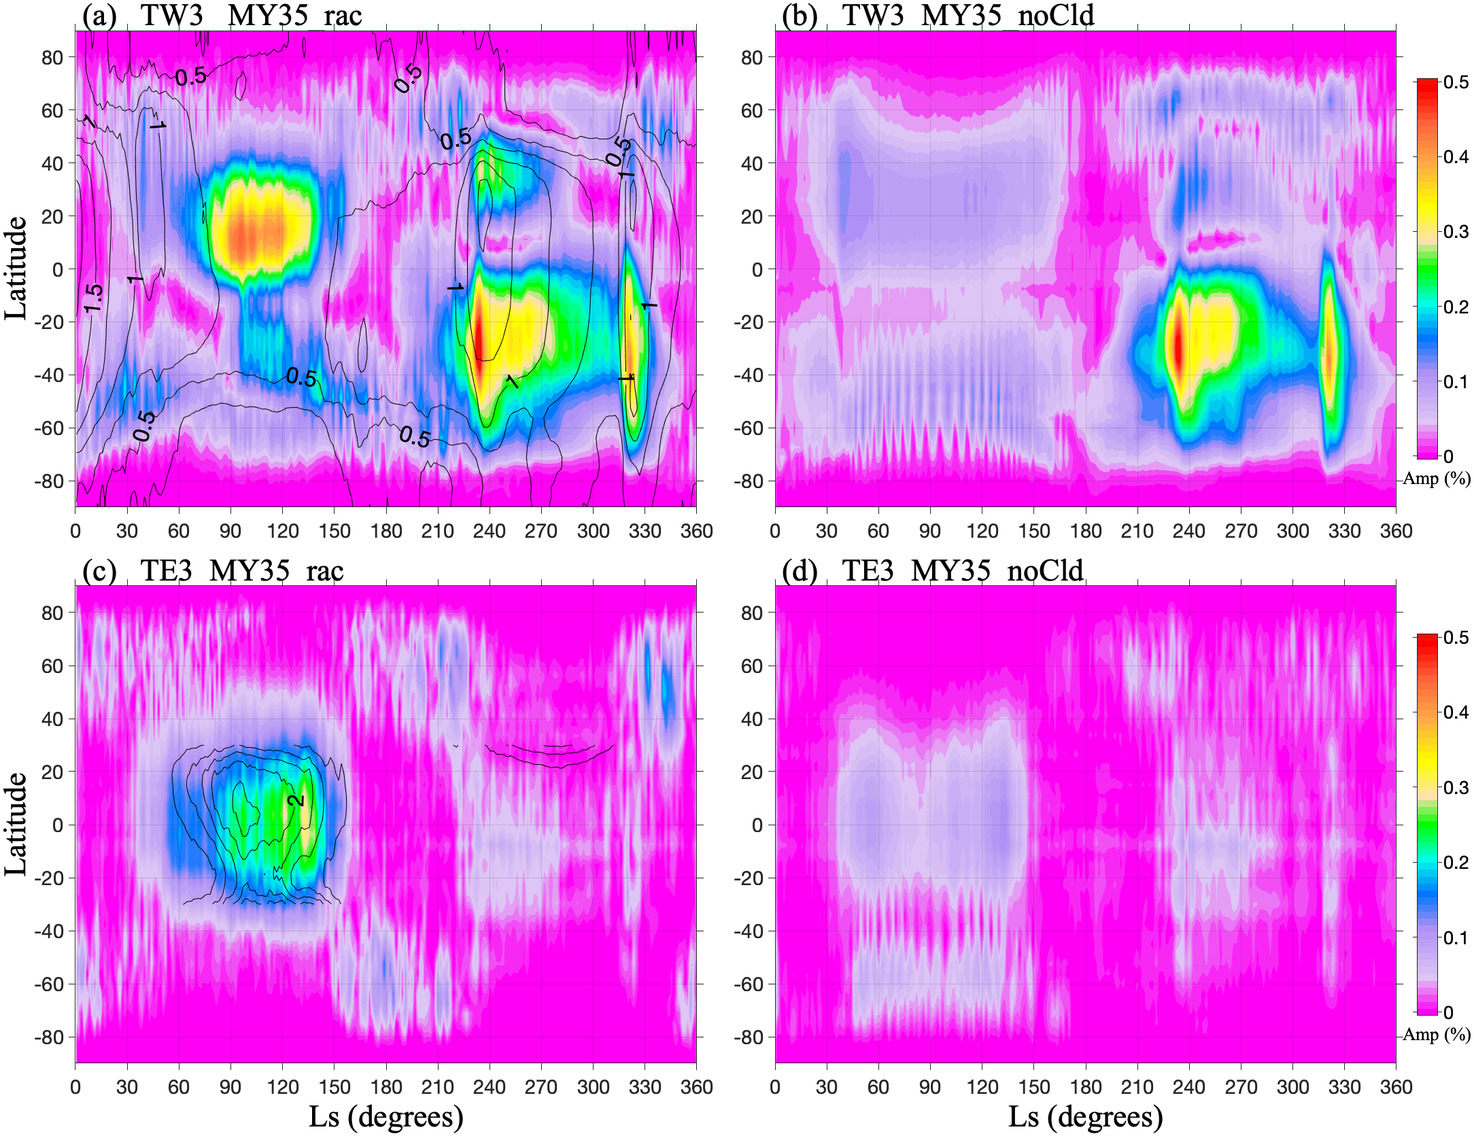
Figure 5: Seasonal normalized amplitude evolution of TW3 and TE3 modes with (left panel) and without (right panel) the effect of radiative heating by water ice clouds from the LMD GCM simulation. Dust column opacity contours are shown on the TW3 field and water ice cloud contours (limited to tropics) are shown on the TE3 field.
Based on this investigation, it seems to be reasonable to infer that ter-diurnal tide has a seasonal cycle at least near the equator, which is strongly influenced by water ice clouds. Nonetheless, the amplitude is typically lower than that for the diurnal and semi-diurnal tides. Definitely more modeling studies are needed to understand the behavior and forcing mechanisms of this important component of the Martian atmospheric tide.
Reference
Joonas Leino, Ari-Matti Harri, John Wilson, et al. Ter-diurnal Atmospheric Tide on Mars. ESS Open Archive . April 26, 2024. DOI: 10.22541/essoar.171415900.05448468/v1
How to cite: Leino, J., Harri, A.-M., Wilson, J., Banfield, D., Lemmon, M., Paton, M., Rodríguez-Manfredi, J., and Savijärvi, H.: Ter-diurnal Thermal Tide on Mars, Europlanet Science Congress 2024, Berlin, Germany, 8–13 Sep 2024, EPSC2024-36, https://doi.org/10.5194/epsc2024-36, 2024.
Please decide on your access
Please use the buttons below to download the supplementary material or to visit the external website where the presentation is linked. Regarding the external link, please note that Copernicus Meetings cannot accept any liability for the content and the website you will visit.
Forward to presentation link
You are going to open an external link to the presentation as indicated by the authors. Copernicus Meetings cannot accept any liability for the content and the website you will visit.
We are sorry, but presentations are only available for users who registered for the conference. Thank you.
Please decide on your access
Please use the buttons below to download the supplementary material or to visit the external website where the presentation is linked. Regarding the external link, please note that Copernicus Meetings cannot accept any liability for the content and the website you will visit.
Forward to session asset
You are going to open an external link to the asset as indicated by the session. Copernicus Meetings cannot accept any liability for the content and the website you will visit.
We are sorry, but presentations are only available for users who registered for the conference. Thank you.