
 1,2,3,3,5
- 1LATMOS/IPSL, UVSQ Université Paris‐Saclay, Sorbonne Université, CNRS, Paris, France (salman.raza@latmos.ipsl.fr)
- 2LMD-IPSL, CNRS, Sorbonne Université, Paris, France
- 3Université Paris-Saclay GEOPS UMR 8146, Orsay, France
- 4LESIA, Observatoire de Paris, Université PSL, Paris France
- 5UGA, CNRS, Institut des Géosciences de l’Environnement (IGE), UMR 5001, 38041 Grenoble, France
Introduction and Motivation
The Cassini probe (2004-2017) had onboard a RADAR operating both in an active and passive (or radiometry) mode at 2.2-cm wavelength. In its active mode, the RADAR recorded the backscatter from the surface (through the normalized radar backscatter cross section σ0) while in its passive mode it measured brightness temperatures (Tb). Both resolved and unresolved observations of Enceladus have concluded on the extremely radar-brightness of Enceladus, the largest in the Solar system [1,2]. Such radar-brightness can be partially explained by the presence of ultra-clean water ice particles at Enceladus’s surface, in particular in the SPT (South Polar Terrain), which offers a favorable medium for scattering. Nevertheless, so far none of the purely random wave scattering models have succeeded to reproduce the measured σ0 or radar albedos. Therefore, it remains an outstanding question to identify the scattering structures responsible for such high radar returns [4, 5]. Furthermore, during Cassini’s unique close flyby of Enceladus’ SPT (E16 flyby) swathing an area of few tens of kilometers, the Cassini RADAR used as a radiometer revealed thermal anomalies that had not been detected in the infrared [3]. However, the amplitude of the internal heat flux remains to be constrained.
To understand better both the scattering and thermal anomalies of Enceladus’ SPT, we developed a model able to jointly simulate Cassini active and passive observations. Comparison to the E16 data provide new insights into the compositional, thermal and structural properties of the subsurface of Enceladus’ SPT.
Method
To predict the backscatter (σ0) and thermal emission in the microwave domain we combine two models: (1) a thermal model providing depth profiles of the physical temperature beneath the surface at the E16 flyby epoch, and (2) a radiative transfer model to simulate both active and passive observations.
Thermal Model – We adapted a multilayer thermal model called Multi-layered Implicit Heat Transfer Solver to the case of Enceladus. This model accounts for Solar flux at the surface and a possible endogenic heat flux from the bottom [4]. The subsurface of Enceladus is modeled as a bi-layer medium with an icy porous regolith overlying a denser water ice substrate. The main parameters of the model are the porosities of the top and bottom layers ϕ1 and ϕ2 (which primarily control the effective thermal properties), the thickness d of the top layer and the endogenic heat flux (Fendo). Based on plume deposition rate modeling [5] a value of up to 90% was assumed for ϕ1. The thickness d is unknown, but [5] suggest it could be up to 700 meters and at least few decimeters based on [6]. We thus vary d from 10 cm to 500 meters. Lastly, Fendo is assumed to be in the range 0 - 0.5 W/m2 based on both infrared and microwave observations [7,3].Fig. 1 displays simulated temperature profiles obtained for ϕ1 = 60%, ϕ2= 10%, d = 10 m at the SPT for different values of Fendo. As Fendo increases, temperatures at depth increase up to values larger than 100 K. Further, the temperature profiles clearly show a discontinuity at the transition from the top to the bottom layer, the top layer acting like an insulating layer (especially if very porous). Additional analyses with different parameter combinations will be presented. The thermal model outputs are used as inputs for the radiative transfer model.
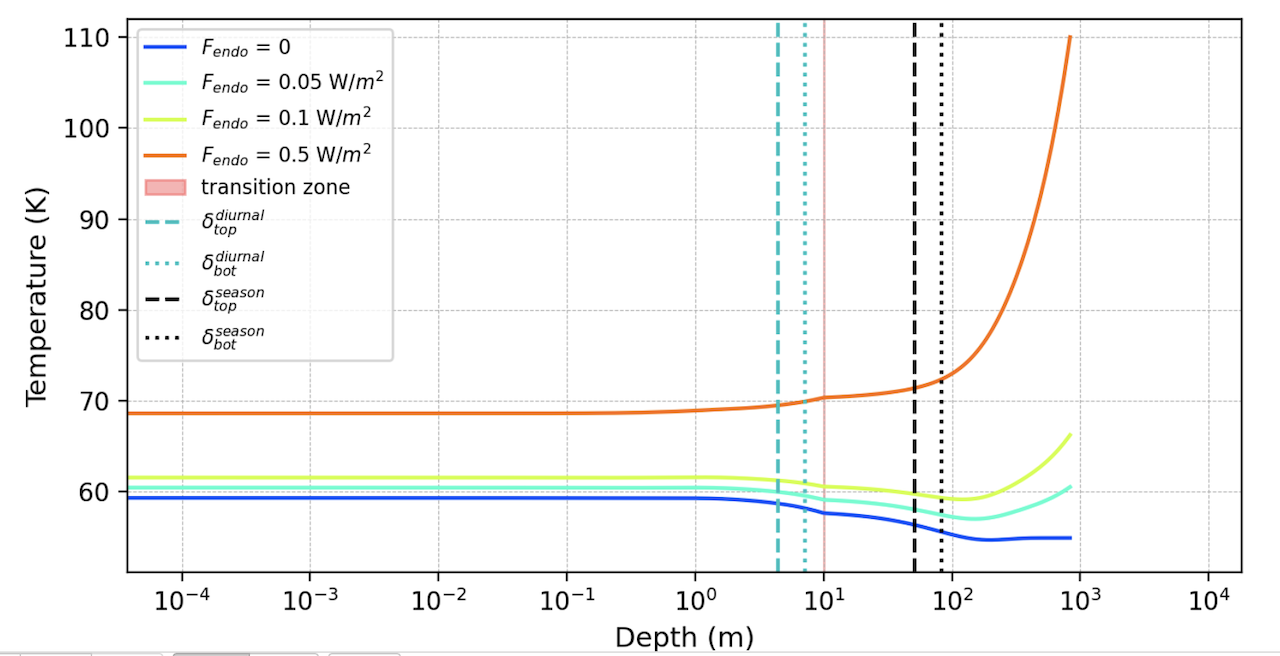
Fig. 1: Temperature profiles for a bi-layer subsurface model at latitude=-60°, longitude=150° at the epoch of the E16 flyby. And δtop/bottomseason/diurnal are the diurnal and seasonal skin depths for both layers.
RT Model - We used the Snow Microwave Radiative Transfer model, a multi-layer RT model initially designed for snow or sea-ice [8]. The assumed effective permittivity of the water ice subsurface depends on its porosity and includes possible contaminants fraction, here assumed as organic dust. The parameters of the RT model are thus the dust fraction and the water ice grain radius size (r1, r2) in the top and bottom layers. It is consistent with the assumptions on ϕ1, ϕ2 and d used for the thermal model. We vary r from 50 microns to 1 mm [9].
Preliminary Results
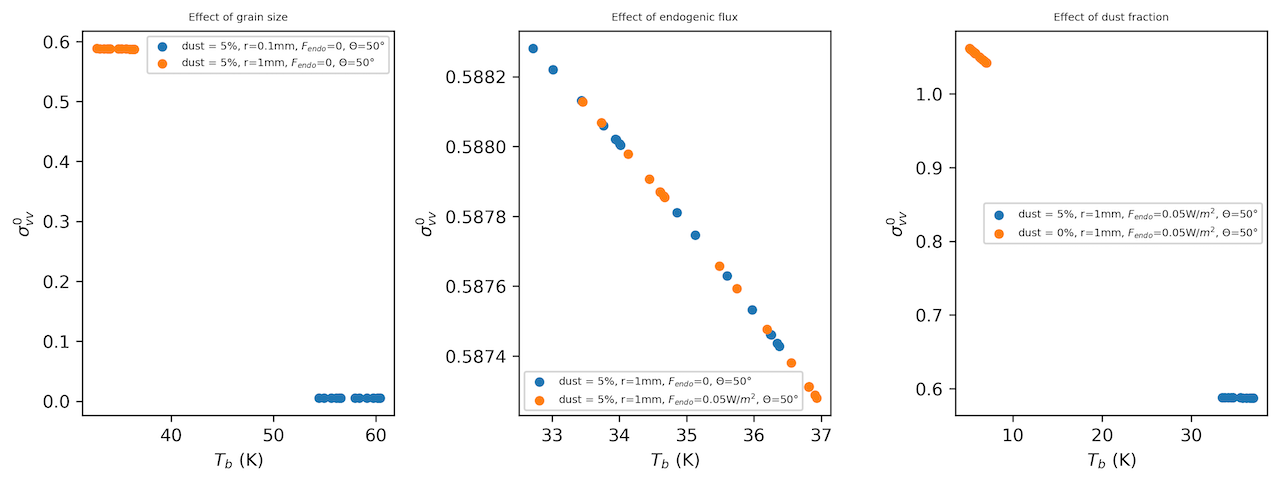
Fig. 2: SMRT outputs for different cases noted in subplot legends and titles. Radar backscatter (σVV0 ) and brightness temperature (Tb) is for vertical polarization.
Fig. 2 presents outputs from the SMRT model in the case of a monolayer water ice subsurface with a constant porosity of 50% and the geometry of observation of the E16 flyby. Each simulation points corresponds to different locations at the SPT. We investigated the effect of r, Fendo and dust fraction on both σ0 and Tb. As expected, these quantities are anti-correlated. In particular, as the r increases volume scattering increases leading to larger σ0and smaller Tb. Decreasing the dust fraction has a similar effect as dusts are more absorbent than pure water ice and thus not favorable to volume scattering. Adding an endogenic heat flux has primarily an effect on Tb.
Fig. 3 displays the comparison between the E16 active and passive Cassini RADAR observations and outputs from the model used in monolayer configurations. While the Tb range of values is well reproduced, the model predicts σ0 much smaller than the ones measured. In the presentation we will explore more assumptions.
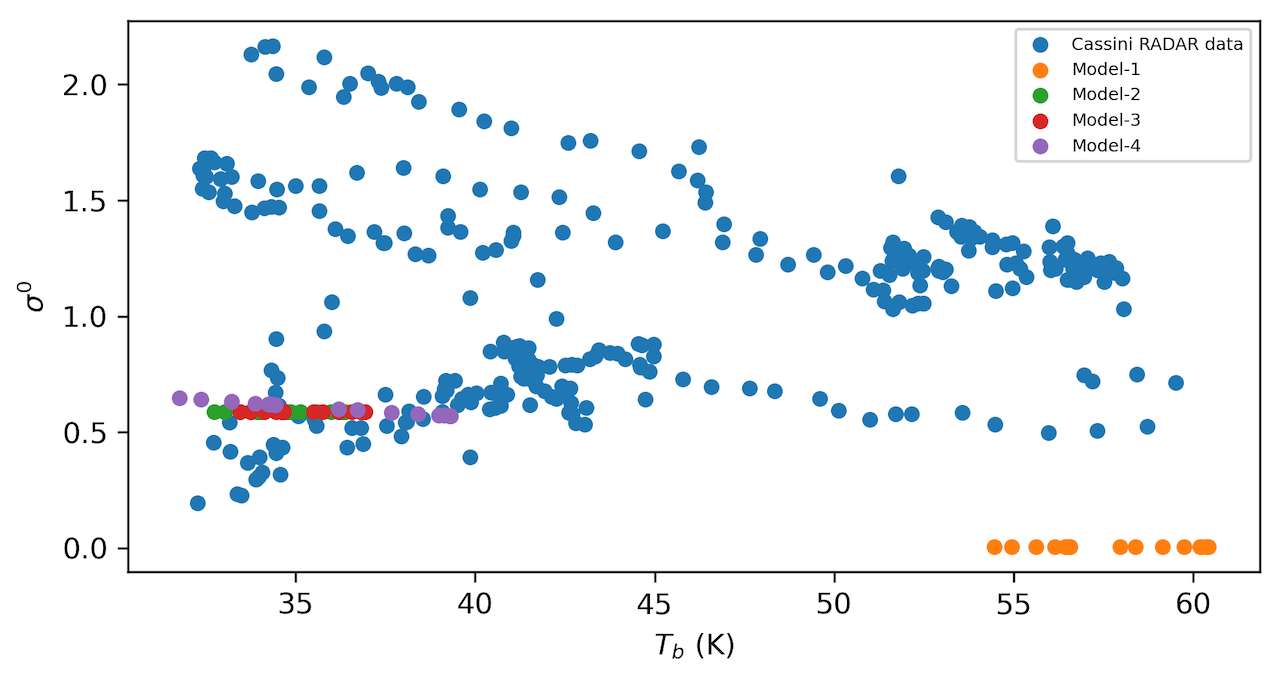
Figure 3: Comparison of the data and model outputs obtained for different combinations of parameters (1. dust = 5%, r = 0.1 mm, Fendo=0, Θ=50◦, 2. dust = 5%, r = 1 mm, Fendo=0, Θ=50◦, 3. dust = 5%, r = 1 mm, Fendo=0.05W/m2, Θ=50◦, 4. dust = 0%, r = 0.2 mm, Fendo=0.05W/m2, Θ=50◦).
References
[1] Le Gall et al., 2019, Geophysical Research Letters 46, 11747–11755
[2] Le Gall et al., 2023, Icarus 394, 115446.
[3] Le Gall et al., 2017, . Nature Astronomy 1, 0063.
[4] Mergny et al., 2023, Article Submitted.
[5] Martin et al., 2022, Icarus 392, 115369.
[6] Black et al., 2001, Icarus 151, 167–180.
[7] Howett et al., 2011, Geophys. Res. 116, E03003
[8] Picard et al., 2018, Geoscientific Model Development 11, 2763–2788.
[9] Jaumann et al., 2007, Icarus 193, 407.
How to cite: Raza, M. S., Le Gall, A., Bonnefoy, L., Schmidt, F., Leyrat, C., Mergny, C., and Picard, G.: Insigths into scattering and thermal anomalies at Enceladus’ SPT from the active and passive Cassini radar observations., Europlanet Science Congress 2024, Berlin, Germany, 8–13 Sep 2024, EPSC2024-1032, https://doi.org/10.5194/epsc2024-1032, 2024.