EPSC Abstracts
Vol. 17, EPSC2024-1034, 2024, updated on 03 Jul 2024
https://doi.org/10.5194/epsc2024-1034
Europlanet Science Congress 2024
© Author(s) 2024. This work is distributed under the Creative Commons Attribution 4.0 License.

Investigating Polarimetric Effects with Fractal Clusters of Nano-Phase Iron Particles in Space Weathering
 ,
,- TU Dortmund, Image Analysis Group, Electrical Engineering and Information Technology, Germany (mirza.arnaut@tu-dortmund.de)
1. Introduction
Spectral analysis of reflectance measurements is a well-established method for studying the lunar surface, supported by data from the Moon Mineralogy Mapper (M3) [1]. However, these data only provide partial insights, as focusing solely on intensity overlooks critical information like polarization. Despite the foundational work by Shkuratov and Opanasenko [2], further exploration of the lunar surface's polarimetric properties has been limited. The inclusion of the PolCam on the KPLO [3] promises new data for developing models that enhance our understanding of these properties. Polarization, more sensitive to surface structure than reflectance, helps model grain size distribution [2, 4]. This study aims to broaden the application of polarization to assess its impact in various contexts, focusing on nano-phase iron particles from space weathering [5, 6]. These particles alter the reflectance spectrum, causing darkening, reddening, and absorption feature obstruction, which are essential factors in spectral analysis. We explore how these particles when integrated into olivine, affect parameters like cross-section, albedo, phase function, and linear polarization degree and how their cluster's shape influences these parameters.
2. Methods
Our model requires (1) a cluster of particles and (2) a light-scattering framework.
Geometry: A particle cluster is generated using the FracVAL algorithm [7], setting the average particle size to 10nm and standard deviation to σr=1.5, with a total of 256 particles. This method employs the fractal dimension to alter the cluster structure; dimensions near 1, 2, and 3 shape the cluster into string-like, layered, and densely packed forms, respectively. Selected dimensions are 1.4, 1.7, 2.0, 2.3, and 2.6. The fractal dimension also acts as a measure of density, with higher values indicating a more compact cluster and smaller bounding box, resulting in increased overall density.
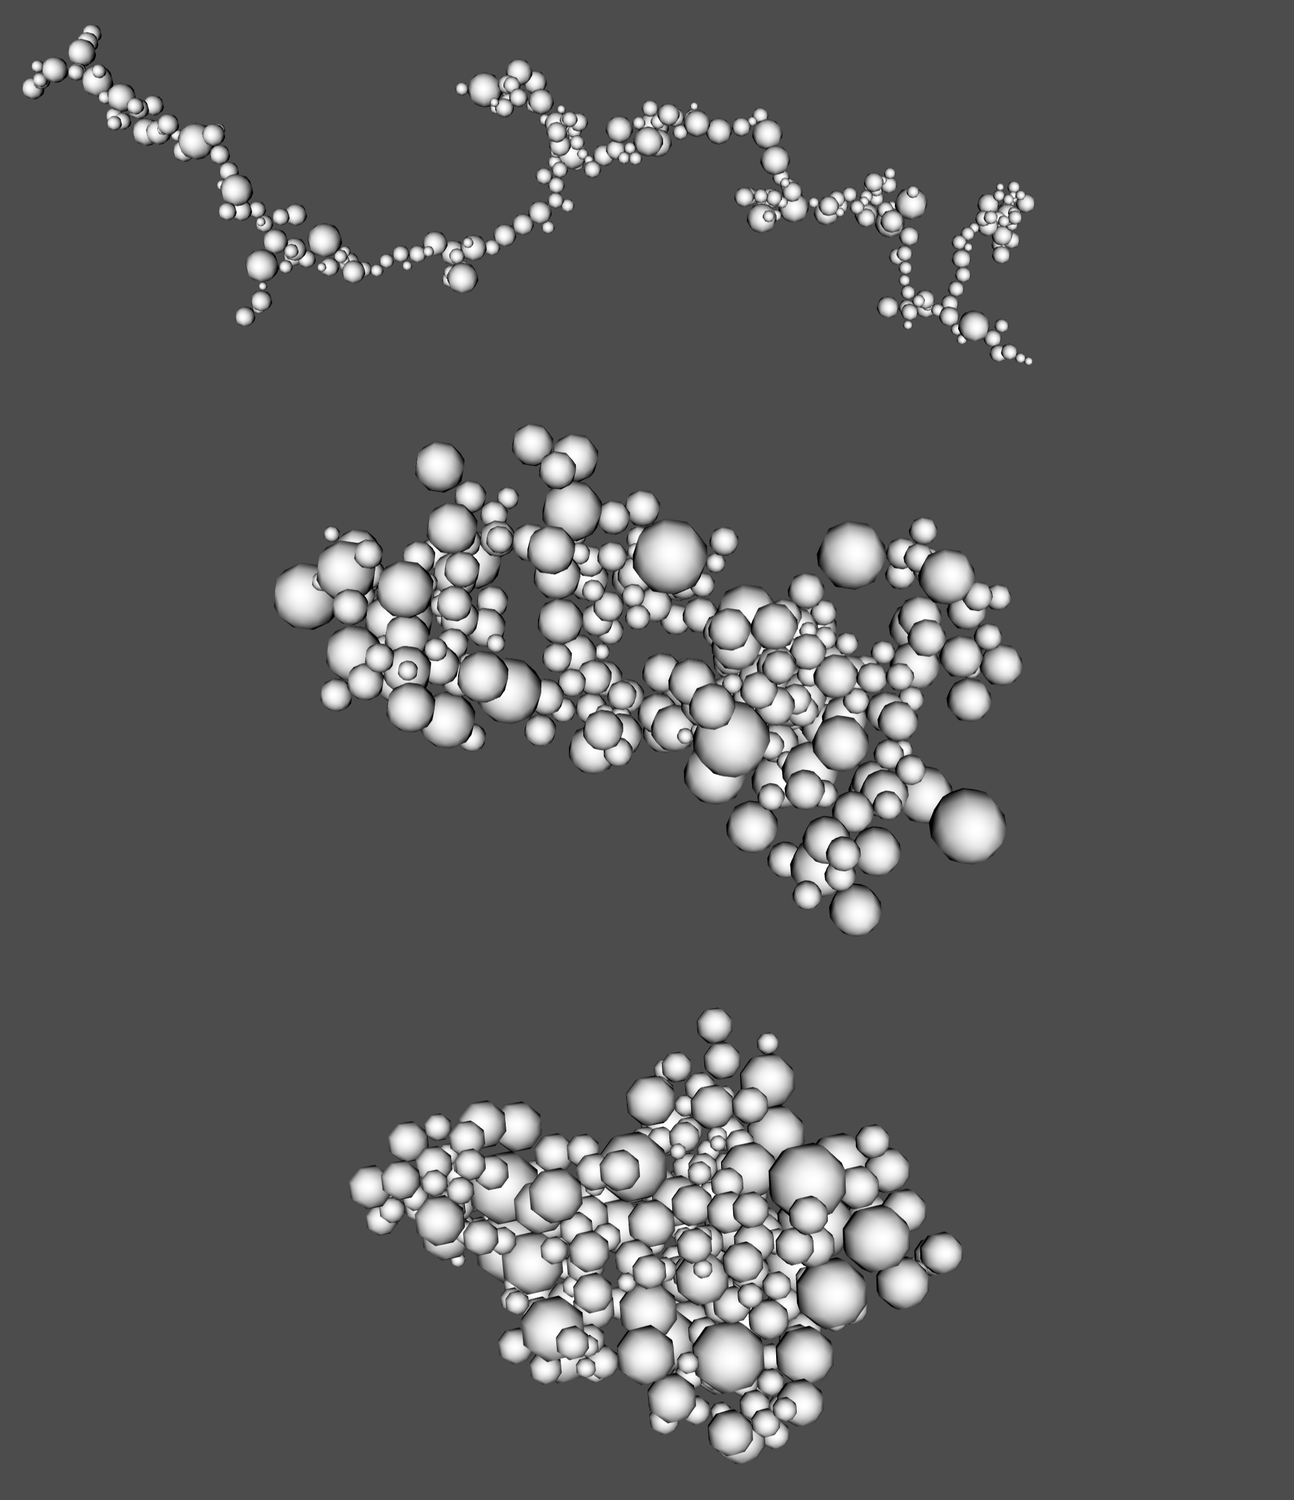
Figure 1: Clusters with 256 particles generated with a fractal dimension of 1.4 (top), 2.0 (middle), and 2.6 (bottom).
Light Scattering: We employ our light-scattering framework, YASF [8], which utilizes the T-matrix method to model the specified particle configurations. The refractive indices for iron particles[9] and olivine[10] are retrieved from online databases and adjusted to fit a designated wavelength vector. Subsequently, the computed values for the cross-section, albedo, phase function, and degree of linear polarization are archived in compressed Python pickle files, which can be integrated into a dashboard for further analysis. Two distinct dashboard types have been developed:
1. It is possible to independently observe particle cluster configurations, displaying all stored information and selecting the angle-dependent dataset from a list: https://arnaut-epsc2024-view.streamlit.app/
2. Data sets for comparison can be selected from a list, and the wavelengths of interest can be modified to improve the analysis of data dependent on the phase angle: https://arnaut-epsc2024-compare.streamlit.app/
3 Results
Examining only the wavelength-dependent quantities, the cross-sections and the albedo, there appears to be slight variation among the different cluster types. The cross-sections seem to exhibit a peak at the fractal dimension of 2.3 since both the higher fractal dimension of 2.6 and dimensions smaller than 2.0 result in reduced values. This pattern is also observed in the albedo, yet alterations in the cluster’s shape do not reveal any new features in the data.
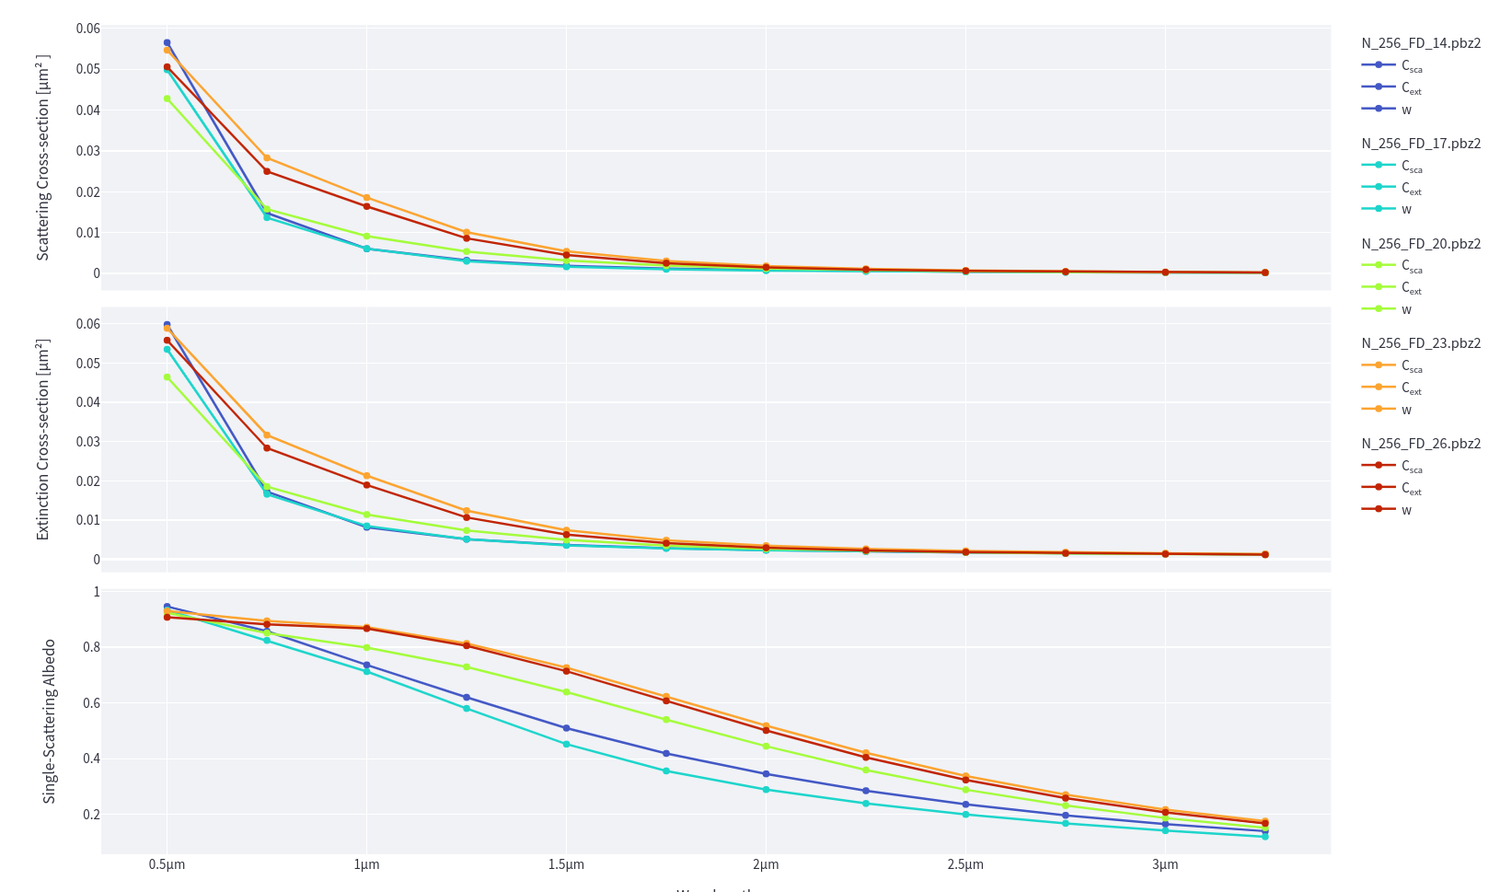
Figure 2: Comparison of the cluster types' cross-sections and albedos.
This perspective changes when we consider phase angle-dependent quantities, such as the phase function and the degree of linear polarization. The phase function, in particular, shows a high sensitivity to variations in the fractal dimension. As the dimension increases, there is a decrease in multiple scattering, causing the peak to shift from smaller to larger phase angles. This phenomenon is even more pronounced at longer wavelengths. Unfortunately, the phase function cannot be measured directly and must be estimated using models such as the Hapke model [11].
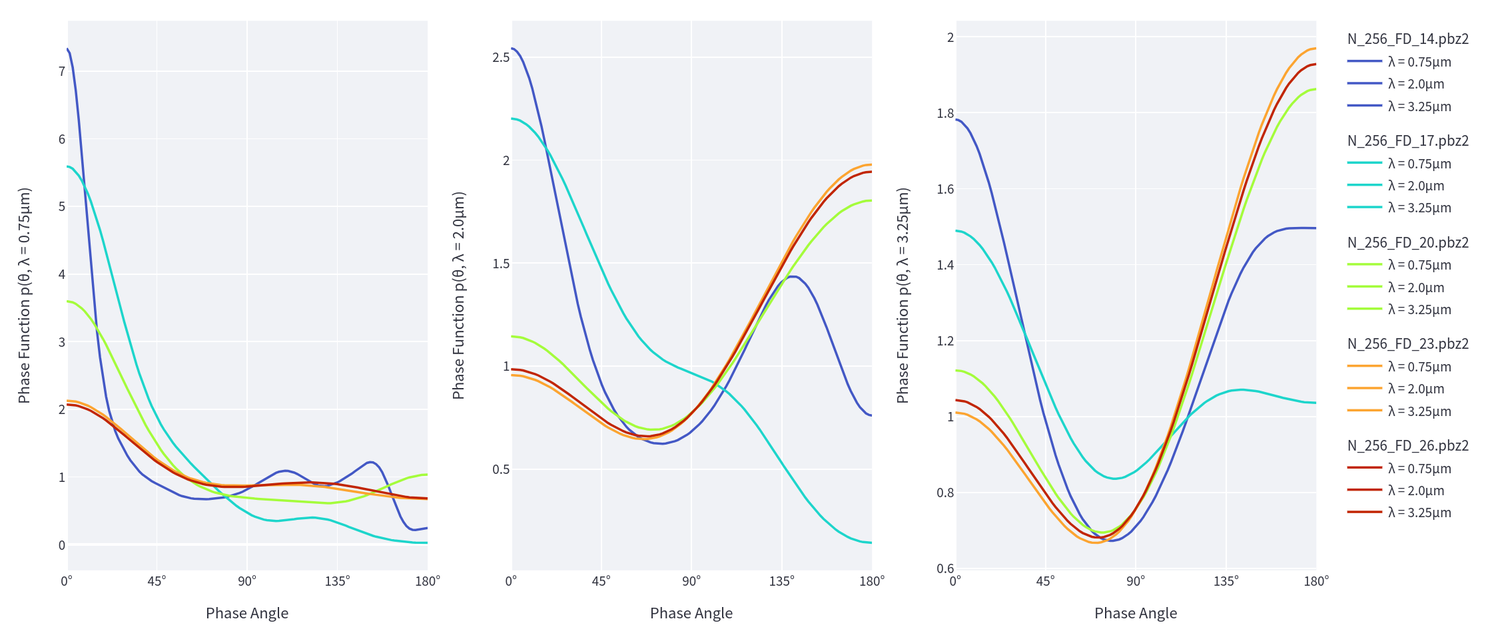
Figure 3: Comparison of the phase function between the cluster types.
In contrast, the degree of linear polarization is a measurable quantity [2, 4]. The most notable characteristic is the degree of linear polarization peak, which occurs near 75°. Maintaining a fractal dimension greater than 2 results in fewer particle interactions. This effect is evident in the modeled polarimetric data, where clusters with a higher fractal dimension maintain a consistent maximum across all wavelengths. In contrast, clusters with a lower fractal dimension exhibit two significant changes: a peak position shift and a maximum value reduction. These shifts are particularly noticeable at short wavelengths, where the peak moves toward smaller phase angles, and at long wavelengths, it shifts slightly toward larger phase angles.
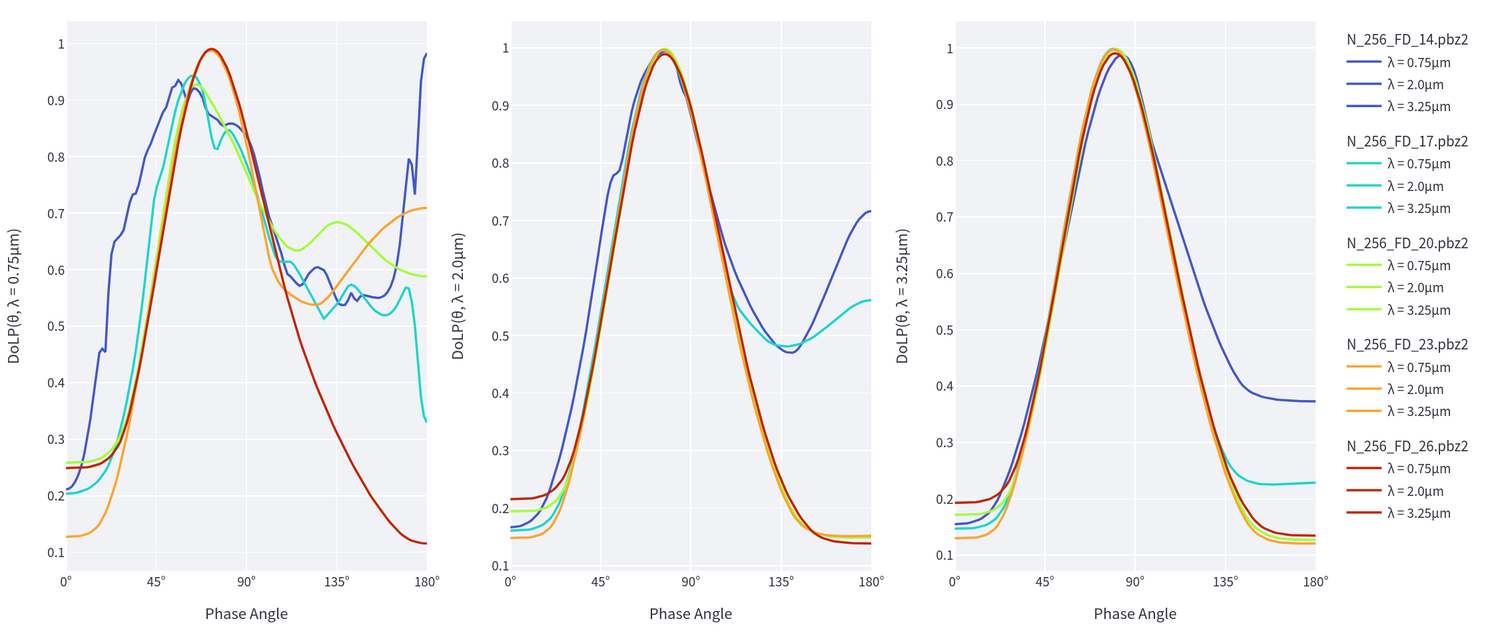
Figure 4: Comparison of the phase angle dependence of the degree of linear polarization between the cluster types.
4 Conclusion and Outlook
Changes in the concentration of iron particles clearly affect the optical characteristics of the cluster. Although these fluctuations cause only slight changes in albedo (similarly derived from reflectance models such as the phase function), they have a more noticeable influence on polarimetric measurements, which are sensitive to the structure of the particles. Specifically, the angle at which the degree of linear polarization reaches its maximum correlates with the concentration of iron particles in the medium, suggesting that this characteristic may indicate space weathering. These findings also coincide with observational findings done by Shkuratov et al. in 2007 [12]. This study serves as an example of the utility of polarimetric data in fields traditionally dominated by reflectance data. The proverb ’there is no data like more data’ holds true, emphasizing that incorporating diverse data sources is crucial for expanding our knowledge of the lunar surface.
References
[1] R. O. Green, et al. (2011) JGR 116.
[2] Y.G. Shkuratov, N.V. Opanasenko (1992) Icarus 99.2 p.468–484.
[3] C.K. Sim, et al. (2020) PASP 132.1007 015004
[4] C. Wöhler, et al. (2024) AJ p.187.
[5] C.M. Pieters, S.K. Noble (2016) JGRP 121.10 pp.1865–1884.
[6] K.S. Wohlfarth, et al. (2019) AJ 158.2 p.80.
[7] J. Morán,et al (2019) CPC 239 pp. 225–237.
[8] M. Arnaut, et al. (2024) Zenodo 11193988.
[9] M.R. Querry (1985) Optical constants.
[10] D. Fabian, et al. (2001) A&A 378.1 pp. 228–238.
[11] B. Hapke (2012) Cambridge University Press.
[12] Y.G. Shkuratov, et al. (2007) Icarus 187.2 pp. 406–416.
How to cite: Arnaut, M., Schauten, D., Nagel, C., and Wöhler, C.: Investigating Polarimetric Effects with Fractal Clusters of Nano-Phase Iron Particles in Space Weathering, Europlanet Science Congress 2024, Berlin, Germany, 8–13 Sep 2024, EPSC2024-1034, https://doi.org/10.5194/epsc2024-1034, 2024.