
Venus surface temperature derived from VIRTIS on Venus Express in comparison to the Venus Climate Database
 1,4,2,3,
- 1Free University Berlin, Geosciences, Berlin, Germany (nils.mueller@dlr.de)
- 2Department of Physics, Oxford University, United Kingdom
- 3Laboratoire de Météorologie Dynamique (LMD/IPSL), Sorbonne Université, Paris, France
- 4Institute of Planetary Research, German Aerospace Center (DLR), Berlin, Germany
The temperature and dynamics of the planetary boundary layer (PBL), i.e. the atmosphere closest to the surface, are important to many aspects of Venus science. The characteristics of the PBL are critical for the exchange of angular momentum between atmosphere and solid planet possibly affecting the planets spin rate (Mueller et al. 2012, Navarro et al. 2018, Margot et al. 2020). Stability of surface minerals is temperature dependent and a related temperature albedo feedback has been proposed to stabilize the Venus climate (Hashimoto and Abe 2005). Some gravity science investigations are enabled by thermal tides, which include the PBL (Cascioli et al. 2021). The dielectric behavior of minerals is temperature dependent and apparent changes of radar emissivity with surface elevation have been interpreted in terms of mineralogy (Brossier et al. 2021). Even more relevant for the remote sensing of surface mineralogy is that for determination of surface emissivity in the near infrared the surface temperature has to be known very well (Kappel et al. 2015).
The PBL is not well resolved by in-situ data. The temperature gathered during the descent of the many Venera missions does not have a very high sampling frequency and has high uncertainty so that the PBL is not discernable (Seiff et al. 1985). The temperature sensors of the four Pioneer Venus descent probes all failed above the PBL at about 12 km about mean planetary radius, so that no details of the PBL are included in the Venus International Reference Atmosphere (Seiff et al. 1985). The last descent probe VeGa 2 observed at a higher frequency and better uncertainty but the results between 1 and 6 km were considered implausible, because the observed temperature lapse rate exceeded the calculated adiabatic lapse, i.e. the stratification should have been unstable.
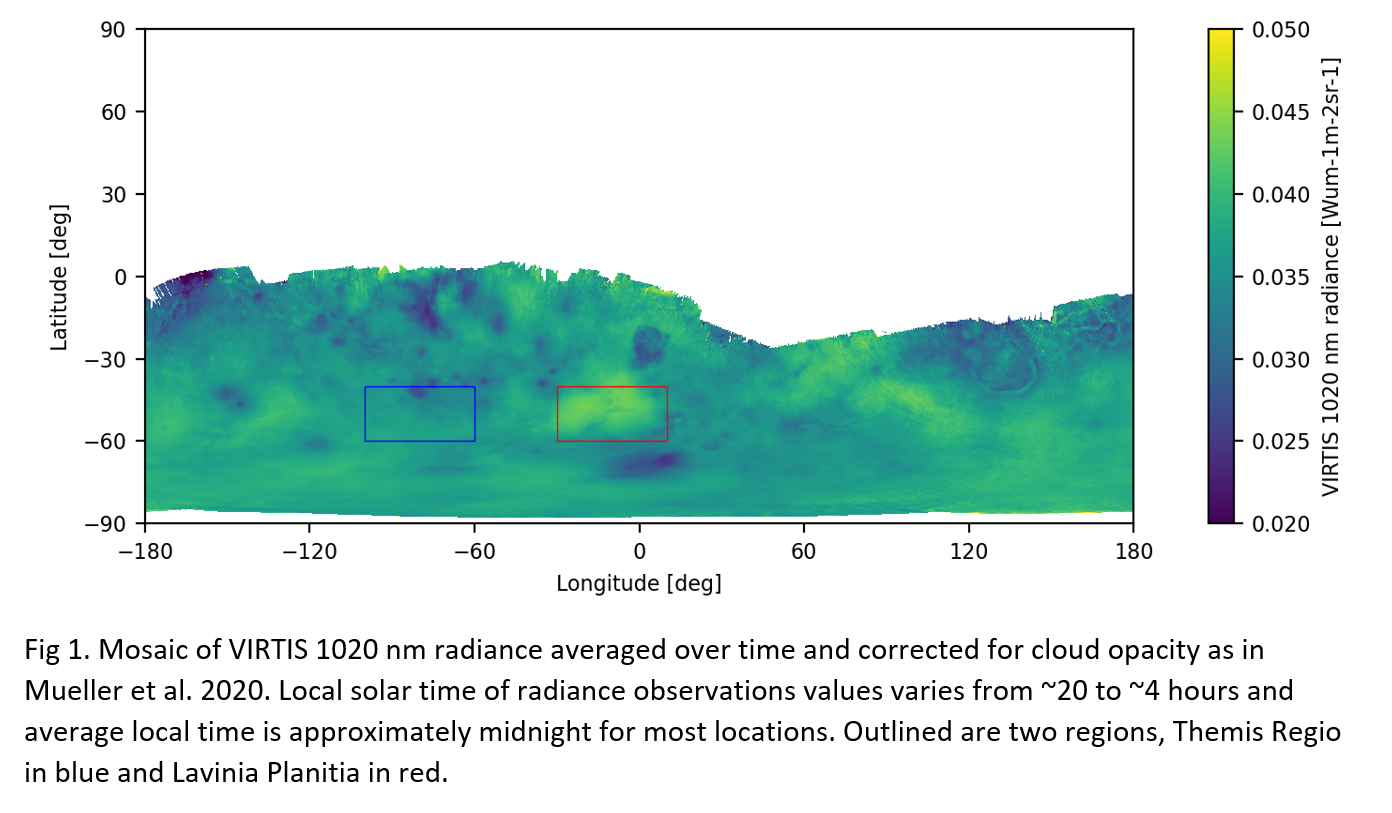
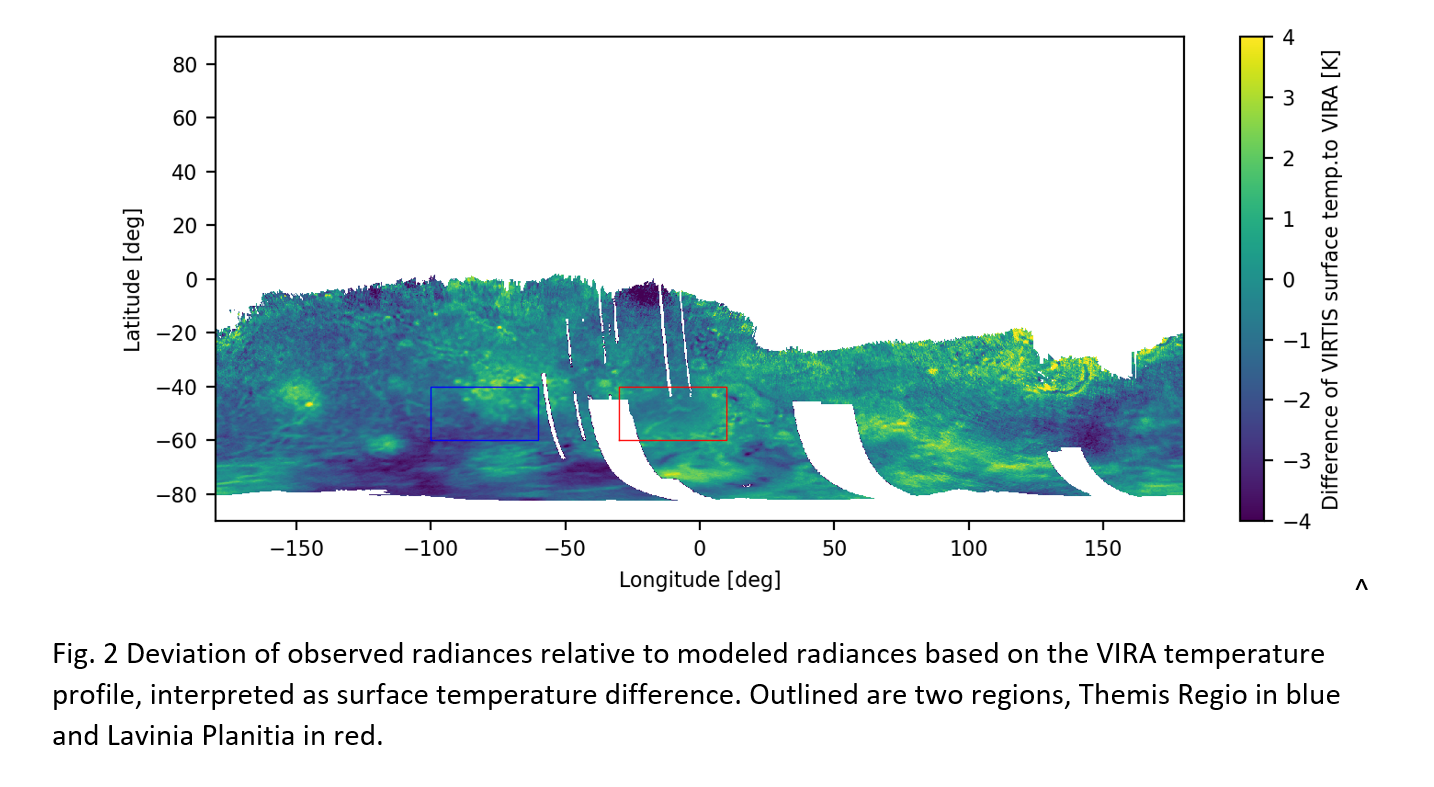
The PBL is not easily accessible to remotes sensing. There are however indirect constraints on the PBL temperature from observations of surface thermal emission through the spectral windows near 1 µm. The Venus Express mission provided with the VIRTIS instrument an extensive data set of thermal emission, that is however mostly limited to the southern hemisphere which does not have highlands reaching far into the layer where VeGa2 found an apparently superadiabatic lapse rate. Mueller et al. 2020 processed the data to a mosaic (Fig. 1) and derived emissivity, again assuming surface temperature corresponding to the VIRA profile. The resulting emissivity is very well correlated with topography in the range from -2 to +2 km relative to the mean planetary radius (MPR) of 6052 km, which is geologically not plausible. The alternative interpretation is again a deviation from the temperature profile assumed in the model instead of a variable emissivity. The model of Mueller et al. 2020 was not used to explore the effect of deviations from the temperature profile but it is possible to estimate the effect. In absence of atmospheric emission, which is approximately true for the 1020 nm window [Meadows and Crisp 1996], the top-of-atmosphere radiance is proportional to the blackbody function at surface temperature. The relative difference between the observed and model TOA radiance can therefore be expressed as the corresponding temperature difference to the model (Fig. 2).
Figure 3 shows the result as function of planetary radius for two regions, Lavinia Planitia and Themis Regio, that were often observed by VIRTIS and were selected because they show large temperature differences at the same elevation and lie on the same latitude band. The differences to the VIRA profile are up to -5K and increase to the lowlands, indicating a lower lapse rate than VIRA. At above 6053 km there is a hint that the lapse rate could reverse and follow the apparently super-adiabatic lapse rate observed by VeGa2, but this is ambiguous. This high location is a single corona and relatively low emissivity would be a geologically plausible alternative explanation [Stofan et al. 2016]. To study the VeGa2 profile, observations at higher elevations are necessary, e.g. those made by Akatsuki IR 1 [Kulkarni et al. 2021] or Parker Solar Probe WISPR [Lustig Yaeger et al. 2023].
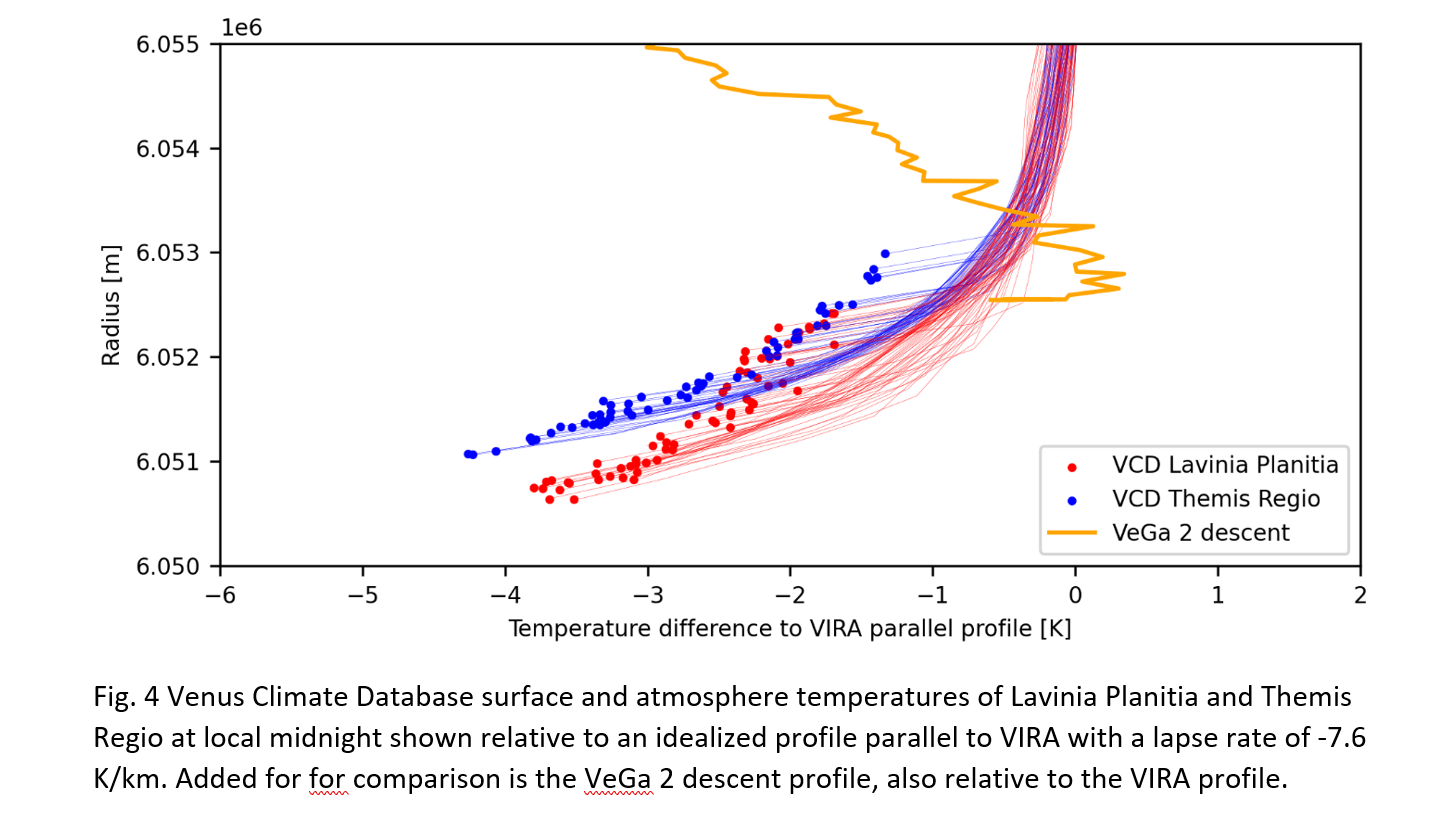
The difference in temperature between the two regions is surprising because studies to derive emissivity assumed that the surface temperature was only a function of elevation since heat redistribution by convection is very effective e.g. (Hashimoto et al. 2008). Comparison to the Venus Climate Database, which models the PBL and its interaction with topography (Lebonnois et al. 2018) shows clear similarities (Fig. 4). The midnight surface temperature below 1 km above MPR has a lower lapse rate than VIRA and the Lavinia Planitia basin is warmer than the flanks of the Themis Regio volcanic rise at the same surface elevation. This temperature difference persists over the Venus day in the model. Our working hypothesis is that the relatively constant slope winds of Venus in combination with the different cooling rates of atmosphere and surface at night redistribute heat and thus create these surface temperature differences.
Overall, the differences to VIRA observed by VIRTIS are about two times larger than those in the model. One possibility could be that the approximation for surface temperature exaggerates temperature contrast. This seems unlikely but we will check this using a radiative transfer model. Another possibility is that the difference can be explained by the low resolution of the GCM (~400 km) and the correspondingly more muted topography. In any case, near infrared imaging provides data that can be compared to modeled surface temperatures of GCMs and thus provide indirect evidence on the planetary boundary layer. Upcoming missions will image these wavelengths with a much-improved signal to noise ratio which may additionally provide surface temperature change rates at night.
Mueller,+(2012).doi:10.1016/j.icarus.2011.09.026; Navarro,+(2018).doi:10.1038/s41561-018-0157-x; Margot,+(2021).doi:10.1038/s41550-021-01339-7; Hashimoto,+(2005).doi:10.1016/j.pss.2005.01.005; Cascioli,+(2021)doi:10.3847/PSJ/ac26c0; Brossier,+(2021).doi:10.1029/2020JE006722; Kappel,+(2015).doi:10.1016/j.pss.2015.01.014; Seiff,+(1985).doi:10.1016/0273-1177(85)90197-8; Mueller,+(2020).doi:10.1016/j.icarus.2019.113400; Meadows,+(1996).doi:10.1029/95JE03567; Stofan,+(2016).doi:10.1016/j.icarus.2016.01.034; Kulkarni,+(2021).doi:10.5194/epsc2021-730; Lustig-Yaeger,+(2023).doi:10.3847/PSJ/ad0042; Hashimoto,+(2008).doi:10.1029/2008JE003134; Lebonnois,+(2018).doi:10.1016/j.icarus.2018.06.006

How to cite: Mueller, N., Kulkarni, S., Lebonnois, S., Das, A., and Rauer, H.: Venus surface temperature derived from VIRTIS on Venus Express in comparison to the Venus Climate Database, Europlanet Science Congress 2024, Berlin, Germany, 8–13 Sep 2024, EPSC2024-1062, https://doi.org/10.5194/epsc2024-1062, 2024.