Multiple terms: term1 term2
red apples
returns results with all terms like:
Fructose levels in red and green apples
Precise match in quotes: "term1 term2"
"red apples"
returns results matching exactly like:
Anthocyanin biosynthesis in red apples
Exclude a term with -: term1 -term2
apples -red
returns results containing apples but not red:
Malic acid in green apples
hits for "" in
Network problems
Server timeout
Invalid search term
Too many requests
TP11
The key role of Venus in the future of planetary exploration has been spotlighted in recent years, marked by the selection of several new missions, such as EnVision (ESA), VERITAS and DAVINCI (NASA). In addition, other missions are in preparation, such as Shukrayaan-1 (ISRO) and Venus Life Finder (Rocket Lab). This sets off a new era for Venus science and exploration, that will dramatically advance our understanding of the atmosphere, surface, and interior of our sister planet.
"Unveiling Venus from atmosphere to core" aims to holistically address the recent and upcoming advancements in Venus science and technology. We welcome a wide range of contributions from interior modeling, surface investigation, atmosphere research, laboratory experiments, and data analysis that can help us better understand the mysterious history of Venus and prepare us for space missions ahead.
Session assets
Understanding the interior processes shaping Venus surface is one of the fundamental tasks for the next decade of Venus science. Even in the absence of plate tectonics, Venus’ surface is covered with many tectonic and/or volcanic structures, including the so-called “coronae” (Latin for crown). Coronae range in diameter from 60 km to up to 2600 km and are defined by rings of closely spaced concentric fractures. These enigmatic structures are widely distributed across the surface and are considered crucial to understanding the planet's geodynamic regime and resurfacing history. Coronae showcase diverse topographic morphologies, volcanic features, and fracture patterns. Geodynamic modelling studies have provided various scenarios for corona formation, often involving some type of plume-lithosphere interaction.
In this work, four end-member geodynamic cases for large coronae formation from Gülcher et al. (2020) are used to compute the expected gravity signal for different scenarios through time. Results demonstrate that the addition of gravity field constraints helps to distinguish different formation scenarios that may lead to similar surface expressions. A detailed classification of coronae based on gravity requires a resolution that is greater than currently available. By carefully rescaling our models to Magellan resolution we assess a set of macro-characteristics allowing us to apply this methodology to current datasets, notably pertaining the end-member formation class and the evolution stage of the corona. By applying these concepts to the Magellan topography and gravity maps of Venus we classify several coronae as active/inactive and assess whether their formation could imply crustal recycling. Importantly, we find that 47 coronae bear signatures of present-day plume-induced activity with various styles of tectonic processes at play.
The next decade will be marked by multiple missions flying to Venus aiming to gather updated, and fundamentally more accurate gravity. Anticipating the future VERITAS mission’s gravity data, we provide an overview of the resolving power of the higher resolution dataset and what additional information on coronae formation may be forthcoming.
Gülcher, A. J. P., Gerya, T. V., Montési, L. G. J., and Munch, J. (2020). Corona structures driven by plume–lithosphere interactions and evidence for ongoing plume activity on Venus. Nature Geoscience, 13(8):547–554. https://doi.org/10.1038/s41561-020-0606-1
How to cite: Cascioli, G., Gülcher, A., Mazarico, E., and Smrekar, S.: Revealing tectonic processes at large coronae on Venus by joint analysis of modelled topography and gravity, Europlanet Science Congress 2024, Berlin, Germany, 8–13 Sep 2024, EPSC2024-223, https://doi.org/10.5194/epsc2024-223, 2024.
ABSTRACT
Recent analysis of NASA’s Magellan radar data revealed that magmatic activity is ongoing on Venus. The geodynamic regime is, however, poorly constrained. Many scenarios have been proposed to explain Venus’ evolution being one of them the “plutonic-squishy” lid regime, which involves the presence of magmatic intrusions. We investigate the effects of magmatic intrusions on mantle’s thermal evolution and the present-day thermal state of the interior. We vary the percentage of extrusive magmatism and compare our results to available geophysical constraints to select successful models. Our findings support recent observations of a magmatically active planet, with Venus being primarily governed by highly intrusive magmatic processes.
INTRODUCTION
A recent study examined synthetic aperture radar data from NASA’s Magellan mission and identified a volcanic vent that changed shape in the 8-month interval between two radar images, which was interpreted as a sign of ongoing volcanic activity on Venus [1]. Moreover, the large number of volcanoes recently compiled in a global catalog [2] indicate that the planet’s evolution and present-day state has been dominated by volcanic processes.
Venus’s geodynamic regime and surface tectonics are, however, poorly constrained and several scenarios including catastrophic resurfacing, episodic plate tectonics, and the “plutonic-squishy lid” regime were proposed [3]. This last one, which has been suggested to be representative for the tectonic regime on early Earth [4], considers that part of the melt that formed in the interior rises to the surface but a significant part remains trapped in the crust and lithosphere as magmatic intrusions.
Here, we investigate effects of intrusive magmatism on the evolution and present-day state of Venus. We evaluate our models by comparing our present-day constraints based on studies of the elastic lithosphere thickness [5,6,7] and interior viscosity of Venus [8].
METHODS
We use the geodynamic code GAIA in a 2D spherical annulus geometry [9,10]. The viscosity is temperature- and depth-dependent, following an Arrhenius law [11]. The thermal conductivity and thermal expansivity in our models are also pressure- and temperature-dependent [12]. We assume a homogeneous distribution of the heat sources and account for the decay in time of radioactive elements (i.e. 238U, 235U, 232Th, and 40K) and for core cooling.
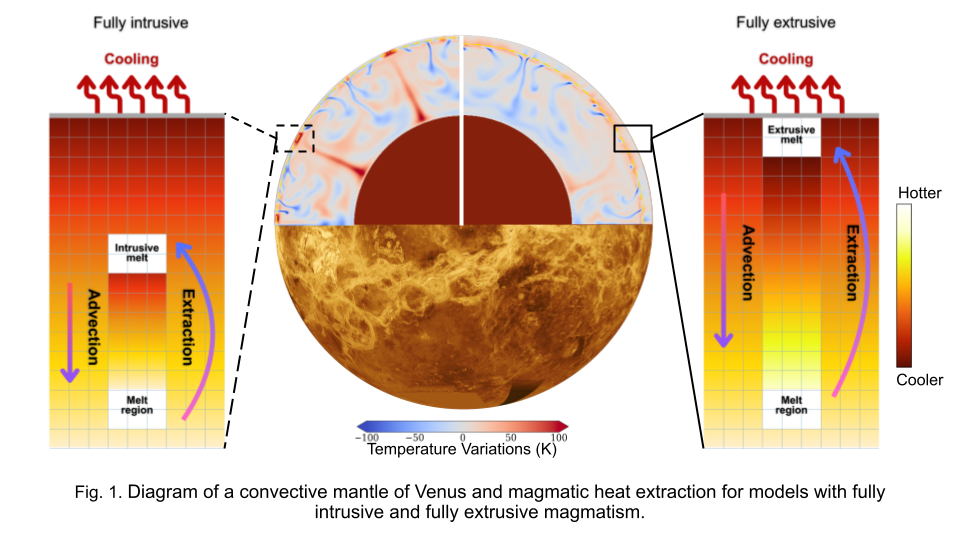
Melting occurs when the temperature of the mantle rocks is higher than the solidus, for which we assume similar values as proposed for the Earth’s interior [13]. We model that the melt can reach the surface (extrusive magmatism), but also that part of this melt can remain trapped in the crust and lithosphere (intrusive magmatism). Fig.1 shows the melt treatment in our models for fully extrusive and fully intrusive cases. We vary the extrusive melt between 0% (fully intrusive) and 100% (fully extrusive) in steps of 20%, and we vary it between 10km and 90km in steps of 20km.
RESULTS
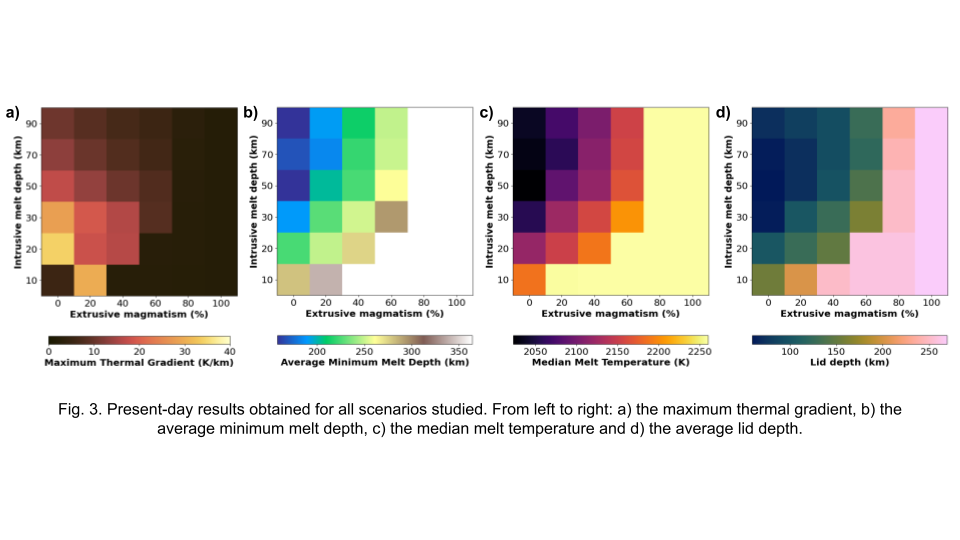
Our results show that magmatic intrusions affect the temperature, viscosity, and velocity across the mantle. The intrusive cases have more vigorous convection than the fully extrusive one and larger temperature variations in the convecting mantle with clearly distinguishable mantle plumes (Fig.1). Moreover, the intrusive melt depth seems to control the growth of the stagnant lid: the more intrusive magmatism, the thinner the lid is (Fig.3d).
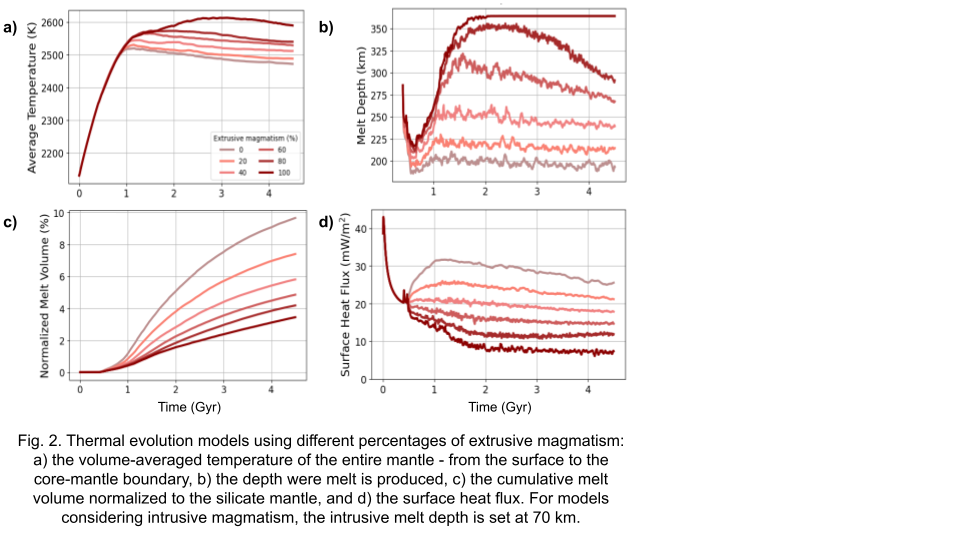
On average, Venus models with highly intrusive magmatism are characterized by a cooler interior, produce more melt at shallower depths and colder temperatures, and have higher thermal gradients, and consequently higher surface heat fluxes during their entire evolution (Fig.2).
At present day, our models show that depending on the percentage of extrusive melt and the depth of magmatic intrusions, the maximum thermal gradient varies from a few K/km up to almost 40K/km, with higher values obtained for higher percentages of intrusive melt and shallower magmatic intrusions (Fig.3a). Models in which the extrusive magmatism is higher than 60% and the depth of magmatic intrusions lies deeper than 50km cannot explain high local thermal gradients as suggested by studies of elastic lithosphere thickness [5,6,7].
In a recent study [8], the presence of a low viscosity layer (LVL) in the shallow Venusian mantle has been suggested to be related to the presence of partial melt. The LVL starts beneath the lithosphere at depths shallower than 200km. This places constraints on the depth of melting that we can use to select successful models. Models that are compatible with partial melting starting at a depth of 200km or less beneath the surface require <40% extrusive magmatism and magmatic intrusions located strictly deeper than 10km (Fig.3b).
Regarding the melt properties, the distinction between intrusive and extrusive cases starts very early in the evolution. Cases that have fully extrusive magmatism present hotter melt and melt deeper than the cases with some percentage of intrusions (Fig.3c). The fully extrusive cases produce partial melt as deep as ~11GPa, the pressure at which melt is more compressible than the solid silicate matrix, and becomes denser which prevents it from rising to the surface [14]. We do not consider this deep melt in our simulation since do not contribute to the magmatic processes investigated here.
SUMMARY
Our analyses indicate that magmatic processes play a major role in the interior evolution of Venus. Our models that are compatible with available geophysical constraints support the scenario of a magmatically active Venus, primarily governed by highly intrusive magmatism and is compatible with the plutonic-squishy lid regime.
The melt depth and melt temperature estimations will be used to inform high-pressure-high-temperature laboratory experiments that will be carried out at the University of Münster to investigate the mantle compositions of Venus that explain the Venera and Vega data (Jennings et al., this meeting).
REFERENCES
[1] Herrick & Hensley, Science, 2023; [2] Rolf et al., SSR, 2023; [3] Hahn & Byrne, JGR, 2023; [4] Lourenco et al., G3, 2020; [5] Borelli et al., JGR, 2021; [6] Maia et al., JGR, 2022; [7] Smrekar et al., Nat.Geoscience, 2023; [8] Maia et al., GRL, 2023; [9] Hüttig et al., PEPI, 2013; [10] Fleury et al., G3 2024.; [11] Karato et al., Philosophical Magazine, 2003; [12] Tosi et al., PEPI, 2013.; [13] Stixrude et al., EPSL, 2009; [14] Ohtani et al., Chem.Geol., 1995.
How to cite: Herrera, C., Plesa, A.-C., Maia, J., Jennings, L., and Klemme, S.: Effects of intrusive magmatism on the thermal evolution and present-day state of Venus, Europlanet Science Congress 2024, Berlin, Germany, 8–13 Sep 2024, EPSC2024-666, https://doi.org/10.5194/epsc2024-666, 2024.
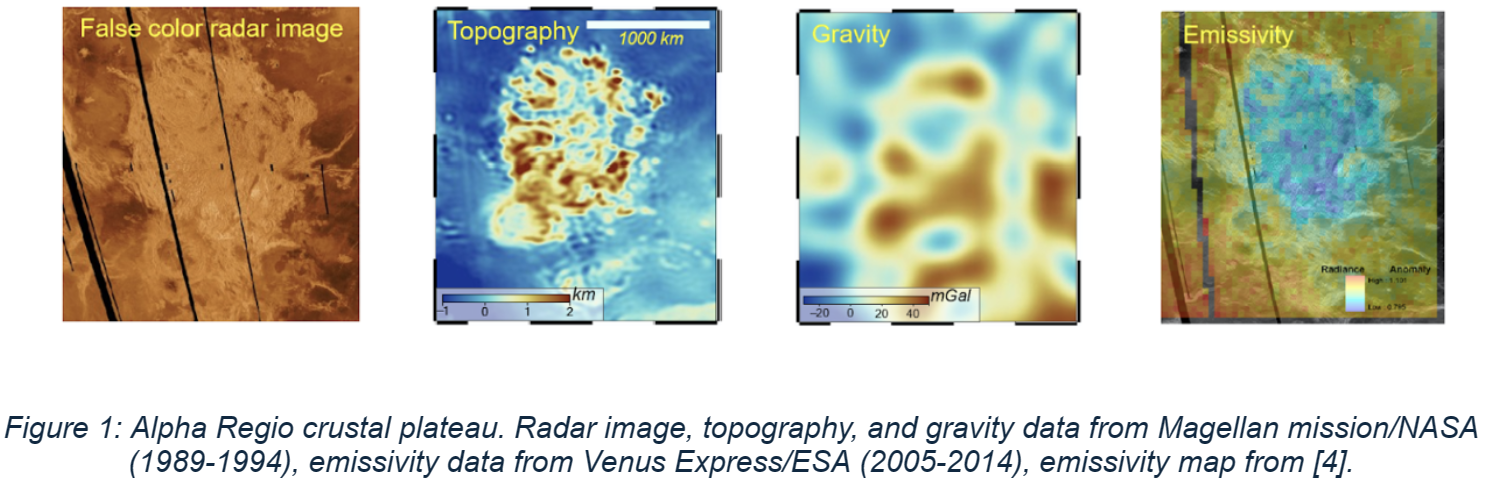
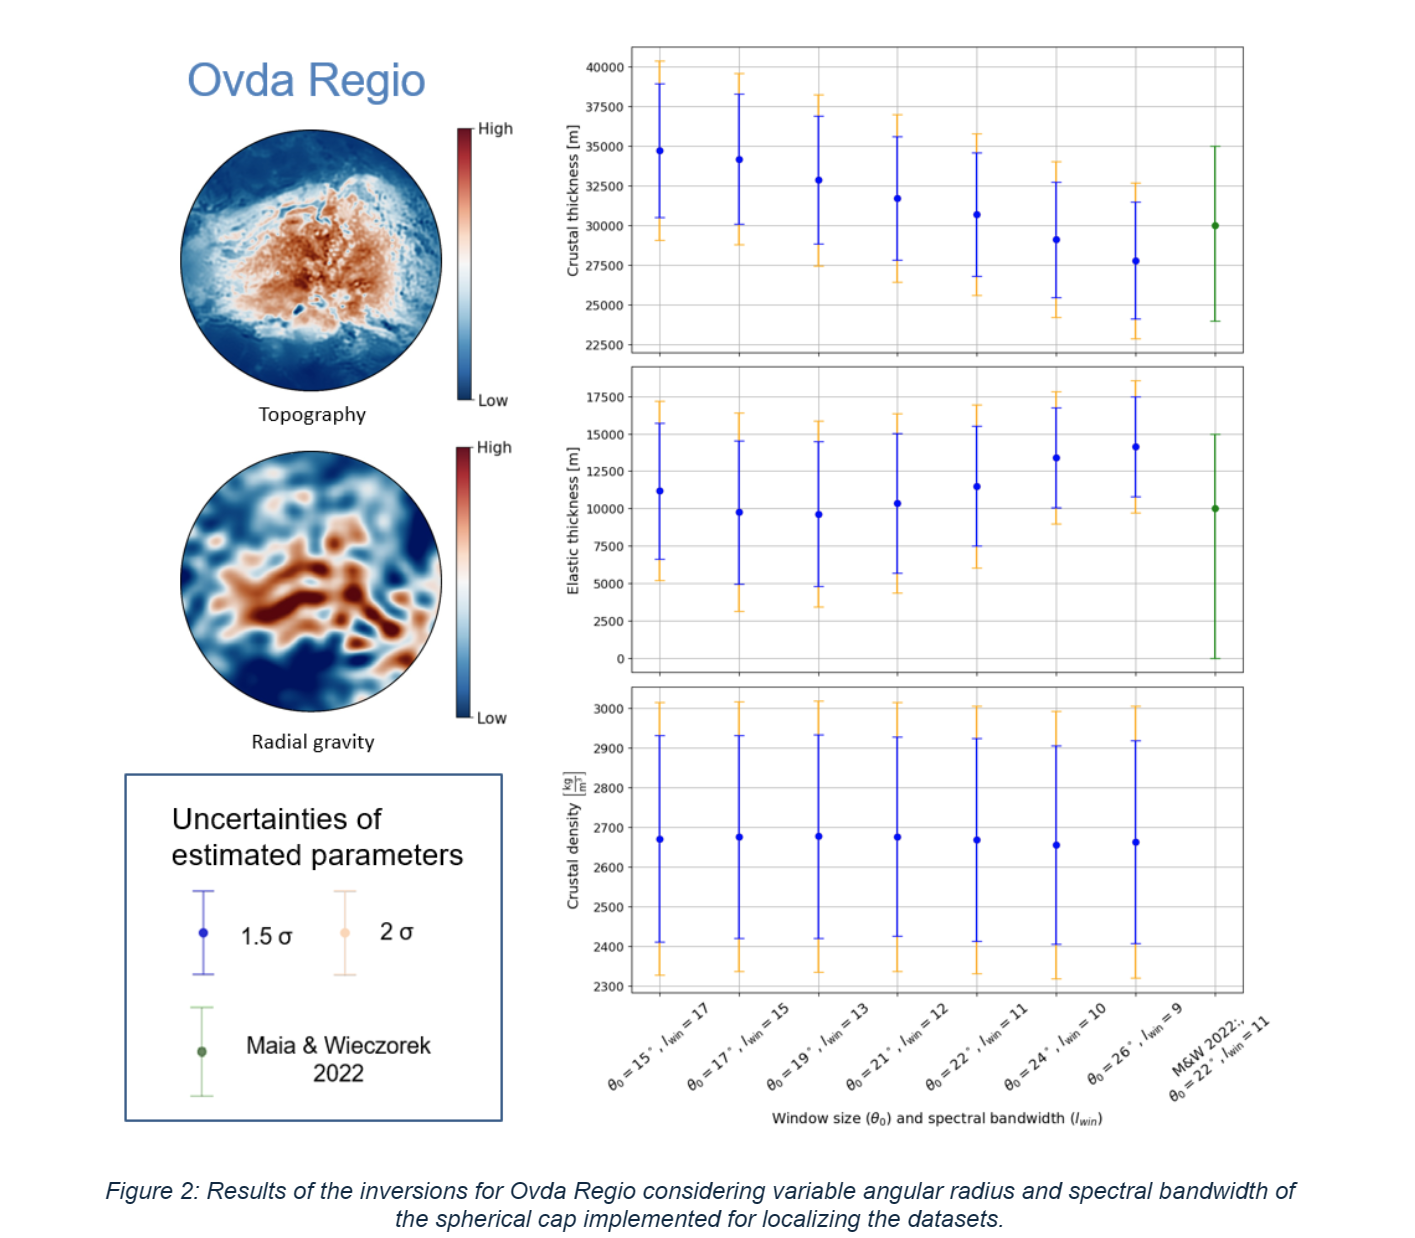
Crustal plateaus are large, high elevation physiographic features on Venus associated with the strongly deformed tessera terrains. They present positive, low magnitude gravity anomalies, and they are stratigraphically the oldest surfaces on the planet [1]. Previous investigations of the gravity and topography signatures of the plateaus have shown that these regions are consistent with shallow support via crustal thickening [2, 3]. In addition, surface emissivity data obtained by Venus Express have shown that the plateaus are associated with low emissivity anomalies, which could be indicative of a felsic composition [4]. Given these observational data sets that are summarized in Figure 1 for Alpha Regio, crustal plateaus could be analogues to the continents on Earth, which would have major implications for our understanding of the tectonic and geodynamic processes that operated throughout Venus’ evolution. Therefore, a careful investigation of the origin and evolution of these features is one of the main objectives of the future missions to Venus.
The goal of this study is to quantify how much the future gravity datasets, in particular obtained by the VERITAS mission, will help us constrain the interior structure of plateaus. We focus on crustal density estimations, since the density would give essential information about the potential felsic composition of the crustal plateaus.
Here, we build on the research and methods of Maia & Wieczorek [3], but we adopt a different inversion approach and focus only on surface loads. To this end, we use a two-layer (mantle, crust+load) lithospheric flexural model. In our inversion, the admittance, a measure of the response of the gravity field to variations in topography, is the physical quantity that is compared between model and observations. The admittance is then spatially and spectrally localized using the windowing functions developed by Wieczorek & Simons [5], to focus the analysis on the plateau regions of interest (here, Alpha Regio and Ovda Regio). A Bayesian inversion to retrieve the parameters of crustal plateaus (i.e., crustal thickness Tc, elastic thickness Te, crustal density ρc) is carried out using the Dynesty package [6] that implements a Nested Sampling algorithm.
Results using current low resolution gravity data show some improvements on the uncertainties of crustal and elastic thickness in comparison to [3] (Figure 2). In particular, our inversions were able to retrieve a lower bound of about 5 km for the elastic thickness of Ovda Regio. However, as expected, the plateau’s crustal density remains unconstrained within the explored range (2400-3000 kg/m3). The slight variability of the results for different window sizes is caused by uncorrelated gravity anomalies not related to the crustal plateau.
These resolution limitations will be soon overcome, thanks to the improvements expected with the VERITAS and EnVision missions, to be launched in the early 2030s to study Venus. In particular, thanks to its quasi-circular orbit, VERITAS will obtain a gravity model with degree strength globally larger than degree 160 and over degree 200 in some regions [7]. Thus, the second focus of this study is to provide a first impression of the extent to which this new dataset will improve our knowledge about the interior structure of the crustal plateaus.
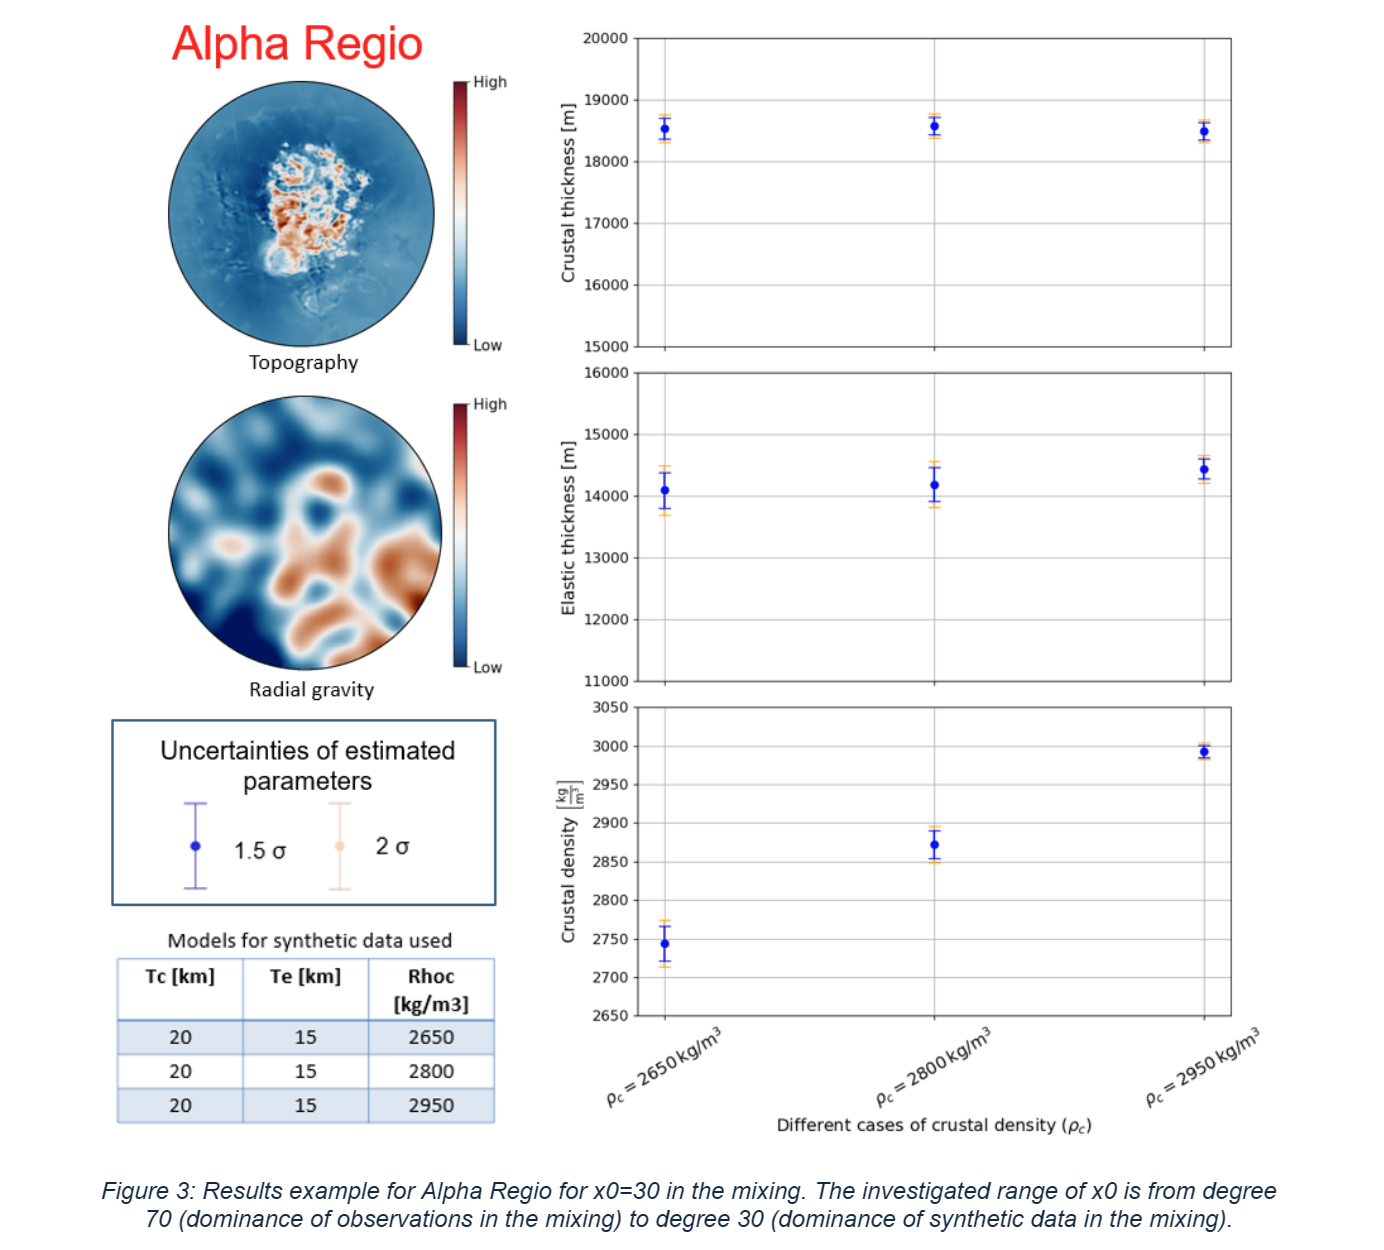
For the simulated gravity dataset, we use flexural models up to spherical harmonic degree 180, for which we consider 6 different variations of the parameters of interest (Tc=20 km, Te=15/30 km, ρc=2650/2800/2950 kg/m3). In a second step, simulated noise is added, and the synthetic data is then mixed with the currently measured gravity field with a sigmoid (logistic function). By changing parameters of this function, such as the steepness of the curve (k) and the degree at which the growth occurs (x0), the mixing can be controlled. This new simulated gravity dataset is used together with our inversion process to study the impact of the higher degree gravity field on our results and test our ability to retrieve the parameters of the crustal plateaus (Tc, Te, ρc).
We observe that, by including more synthetic data compared to the measured gravity field, our inversion is able to retrieve the parameters of the crustal plateaus within 10% of the true value known from the synthetic models (see results in Figure 3 for Alpha Regio). We show that the uncertainties of the crustal plateau parameters substantially decrease when the maximum degree of the gravity field that is used in our inversions increases. Our results demonstrate that such an approach would be able to distinguish between a high density, basaltic crust and a low density more felsic crust.
Future developments will investigate different sources of noise that can be added to the admittance, such as geologic signals not related to flexural support. A natural next step is to apply this analysis to different crustal plateaus to determine the potential of retrieving crustal density estimates at various locations on Venus. Finally, we will perform additional sensitivity tests for our inversion approach to assess its robustness to various additional input parameters.
References:
[1] Ivanov M.A. & Head J.W. (2011) Planet. Space Sci., 59; [2] Grimm R.E. (1994) Icarus, 112 ; [3] Maia J.S. & Wieczorek M.A. (2022) JGR Planets, 127; [4] Gilmore M.S. et al. (2015) Icarus, 254; [5] Wieczorek M.A. & Simons F.J. (2007) JFAA, 13; [6] Speagle J.S. (2020) MNRAS, 493; [7] Cascioli G. et al. (2024) 55th LPSC.
How to cite: Baccarin, J., Maia, J., Cascioli, G., Plesa, A.-C., Mueller, N., Mazarico, E., Breuer, D., and Smrekar, S.: Constraining the interior structure of crustal plateaus on Venus in the context of future space missions., Europlanet Science Congress 2024, Berlin, Germany, 8–13 Sep 2024, EPSC2024-817, https://doi.org/10.5194/epsc2024-817, 2024.
Often termed the twin sister of the Earth, Venus represents an alternative outcome of the evolutionary path taken by large terrestrial planets. Given its extreme surface conditions, lack of surface water, and the absence of plate tectonics, the present-day thermal state of its mantle is likely very different from the Earth. Venus also remains the most enigmatic of terrestrial worlds in terms of interior structure. Both its tidal Love number k2 and moment of inertia factor, the main sources of information on the core size and interior structure, are known with a large uncertainty of about 10% [1, 2], and the magnitude of tidal dissipation, sensitive to the planet’s thermal state, has only been determined indirectly [e.g., 3]. Yet, the set of observables acquired by the Magellan and Pioneer missions can still be used to put constraints on the interior structure.
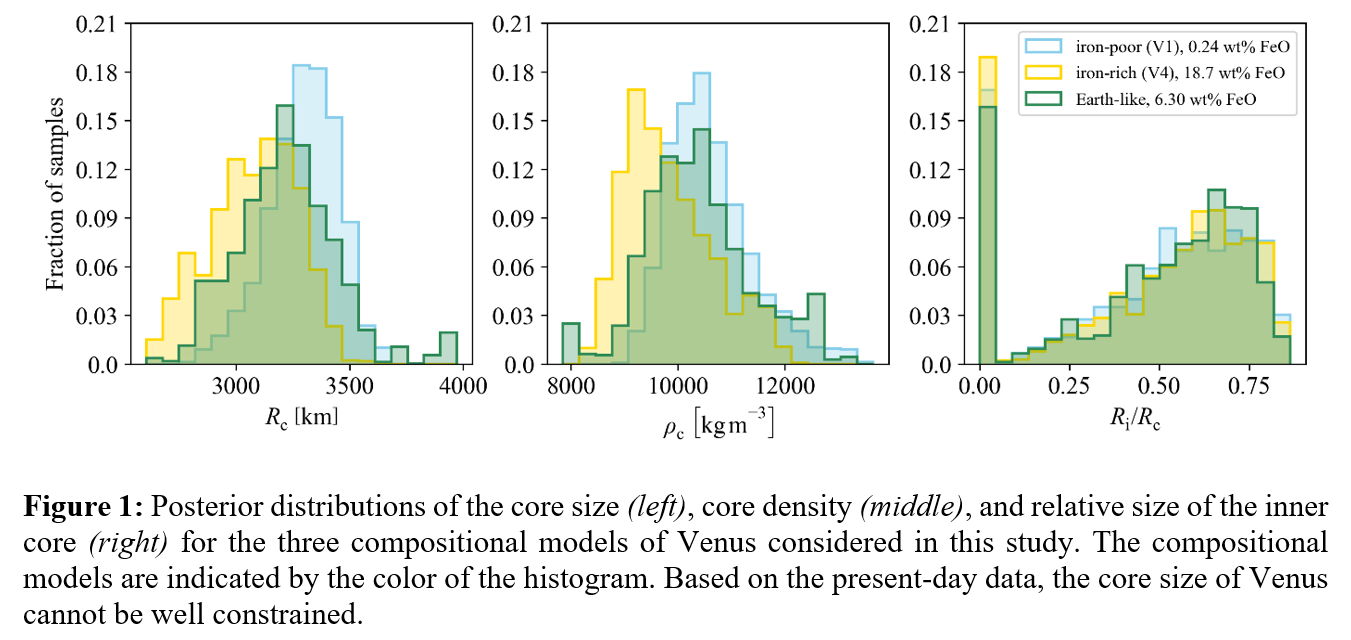
In this study, we combine the calculation of global tidal deformation with a 1-d parameterised model of mantle convection in the stagnant-lid regime [4,5] and we perform a Bayesian inversion of several observational and theoretical constraints (such as the tidal Love number, maximum elastic thickness, or absence of intrinsic magnetic field) to gain insight into the present-day interior structure and thermal state of Venus. The convection model is based on the thermal boundary layer theory and incorporates partial melting, crustal growth, and inner core crystallization. The elastic structure of the mantle for three selected mineralogical models is obtained from the software Perple_X, based on the minimisation of Gibbs free energy [6]. Lastly, to find the tidal parameters, we calculate the tidal deformation of a layered compressible viscoelastic sphere, using the formalism of the normal mode theory [7]. The mantle is described as governed by the Andrade rheological model, which has proven essential for distinguishing between a fully solid and a fully or partially liquid Venusian core [8].
We vary a large set of rheological, structural, and thermodynamic parameters and predict a range of mantle temperatures consistent with previous stagnant-lid models, average mantle viscosities between 1020-1022 Pa.s, and tidal quality factor Q=48+84-22. Specifically, the mean value of the tidal quality factor, a parameter inversely proportional to the rate of tidal dissipation, is close to the values derived from studies of equilibrium between solid-body and atmospheric tides [3]. We also investigate the effect of assumed mantle composition on the predicted core size and density and address the question of how likely is the existence of a fully solid or fully liquid core (Figure 1). Finally, we discuss the improvements in data expected from future missions VERITAS and EnVision.
References
[1] Konopliv & Yoder (1995), GRL, 23(14):1857-1860, doi:10.1029/96GL01589.
[2] Margot et al. (2021), Nat. Astron., 5:676-683, doi:10.1038/s41550-021-01339-7.
[3] Correia & Laskar (2003), Icarus, 163(1):24—45, doi:10.1016/S0019-1035(03)00043-5.
[4] Morschhauser, Grott, & Breuer (2011), Icarus, 212(2):541-558, doi:10.1016/j.icarus.2010.12.028.
[5] Baumeister et al. (2023), Astron. Astrophys., 675(A122):23, doi:10.1051/0004-6361/202245791.
[6] Connolly (2009), G3, 10:Q10014, doi:10.1029/2009GC002540.
[7] Takeuchi & Saito (1972), Methods in Computational Physics, 11:217-295, doi:10.1016/B978-0-12-460811-5.50010-6.
[8] Dumoulin et al. (2017), JGR: Planets, 112(6): 1338-1352, doi:10.1002/2016JE005249.
How to cite: Walterova, M., Plesa, A.-C., Baumeister, P., Rückriemen-Bez, T., Wagner, F. W., and Breuer, D.: Constraining the interior structure and thermal state of Venus, Europlanet Science Congress 2024, Berlin, Germany, 8–13 Sep 2024, EPSC2024-214, https://doi.org/10.5194/epsc2024-214, 2024.
Abstract
Venus remains a relatively unknown planet. The aim of this study is to determine the Venus' rotational state using the Precise Orbit Determination (POD) method with radio tracking data from Venus Express (VEX) spacecraft. We found a spin period of 243.0206 +/- 1.0028 x 10⁻⁴ days. This value is consistent with those found in the literature using different methods.
Introduction
Although Venus is often considered as the Earth's twin sister, our knowledge of its internal structure, including the size and state of its core are limited [1]. Its rotational state, although measured by several techniques (from the orbit or from ground-based radar), is not very well constrained and shows temporal variations that remain unexplained [2]. The Venus Express (VEX) spacecraft was launched by the European Space Agency (ESA) in November 2005 and orbited the planet for nearly 8 years, from mid-2006 to 2014. This mission was dedicated to the study of the atmosphere of the planet, however, the radio-tracking data performed for navigation purposes can also be used to determine the rotational state of the planet.
Method
This study investigates the Doppler tracking data acquired by ESTRACK Network and collected by VEX Radio Science Experiment (VeRa). The data were analyzed by using the Precise Orbit Determination (POD) method. It consists of performing an iterative least-squares adjustment between Doppler data generated form a numerical integration of a force model driving spacecraft's motion and observed tracking data on successive data arcs of 7 days. For this purpose, we use the GINS (Géodésie par Intégrations Numériques Simultanées) software, developed by French space agency (CNES).
As outputs, two kinds of parameters are fitted: the local and global parameters. Local ones correspond to parameters calculated for each arc whereas the global parameters are derived from all data-arcs. The rotational state of the planet is part of global parameters such as coefficients of its gravity field and the Love number k2.
Results
We found a spin period of 243.0206 +/- 1.0028 x 10⁻⁴ days. This result is consistent with previous solutions obtained using different tracking data (PVO, Magellan) or methods, such as radar or thermal images form the ground or spacecraft. Figure 1. represents some estimates of Venus' rotation period with respect to their measurement time baseline since 1980. References and methods used for these studies are listed in Table 1.
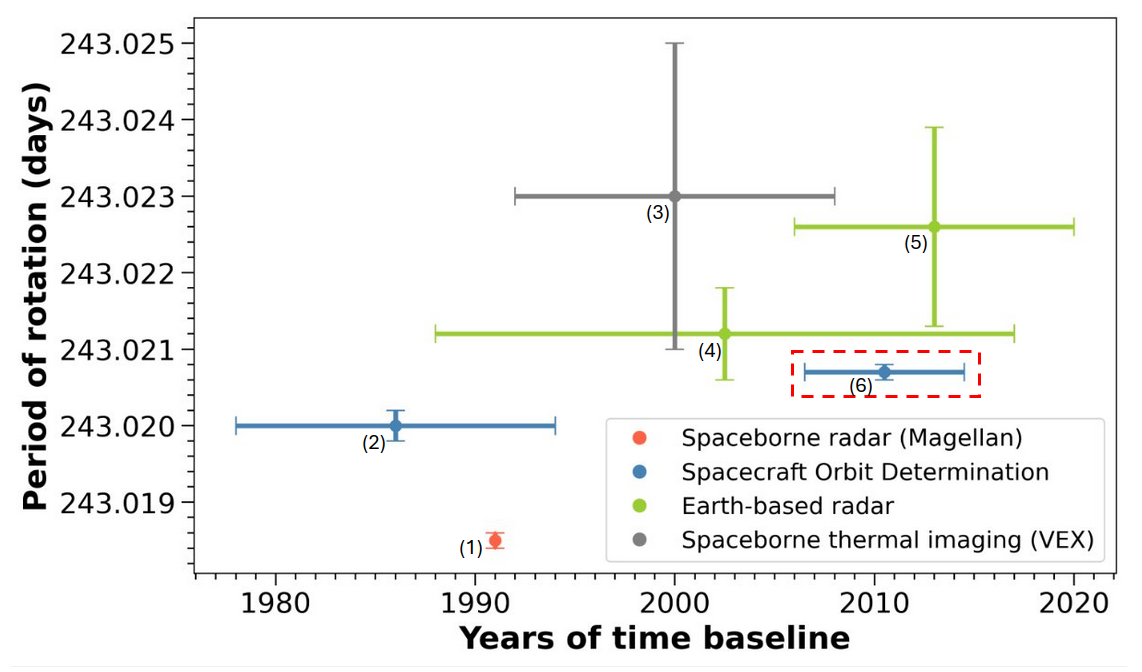
Figure 1 . Estimates of Venus' rotation period, along with their measurement time baseline and corresponding error bars (1 sigma). The outcome of our study is highlighted in red.
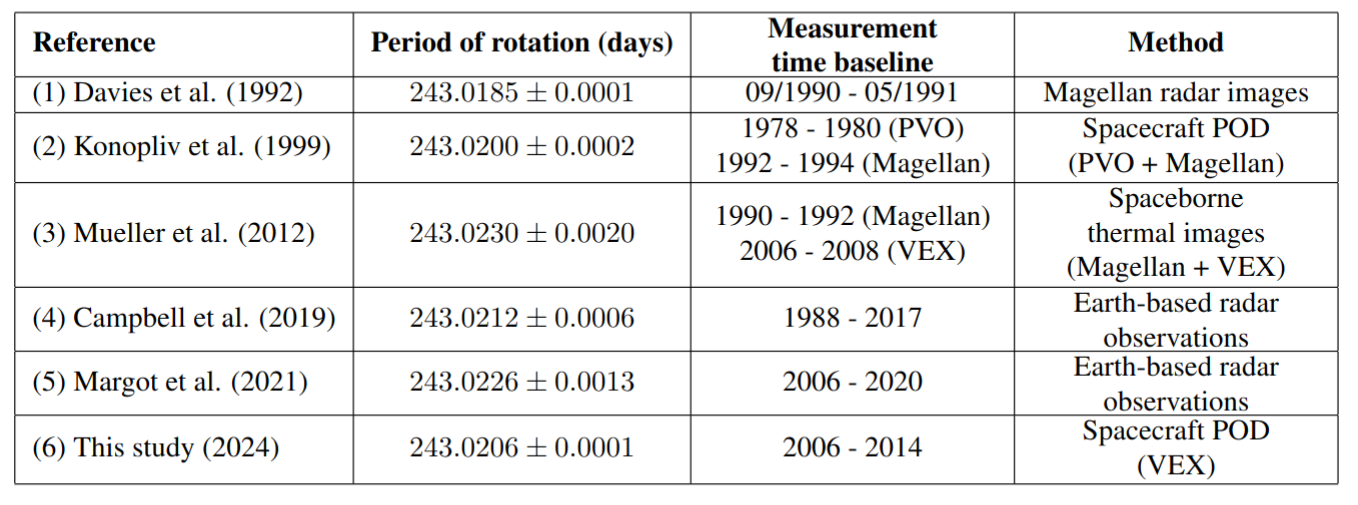
Table 1. References for estimates of Venus' rotation period rotation presented in Figure 1.
Spin period varies- from 243.018 days to 243.023 days, corresponding to a difference of approximately 7 minutes. Furthermore, we observe that the determined values differ depending on the method employed. Our study is in good agreement with the value from Konopliv et al. (1999), who employed the same method as us, as well as the result reported by Campbell et al. (2019) which used Earth-Based radar images. However, our spin period differ from that reported by Margot et al. (2021) end those using other methods such as spaceborne radar [5] or thermal imaging [6].
Conclusion
In this study, an estimate of Venus' rotation period is provided. This result is consistent with the values published in the literature. It shows that navigation tracking data of planetary orbiters, such as VEX, can also be used for science investigation. Further work is ongoing to constrain other geophysical parameters that may help us to better understand Venus.
Acknowledgements
The authors want to thank Bernd Häusler and the VEX Radio Science Experiment (VeRa) team, the Centre de Calcul Intensif des Pays de la Loire (CCIPL) and the ESOC Flight Dynamics.
References
[1] Dumoulin, C. et al.: Tidal constraints on the interior of Venus, J. Geophys. Res. Planets 122, 1338–1352, 2017
[2] Cottereau, L. et al.: The various contributions in Venus rotation rate and LOD, Astron. Astrophys. 531, A45, 2011.
[3] Konopliv A. S. et al.: Venus Gravity: 180th Degree and Order Model. Icarus 139, 3–18, 1999
[4] Margot, J. L. et al.: Spin state and moment of inertia of Venus, Nat Astron 5:676–683, 2021
[6] Mueller, N. T. et al.:Rotation period of Venus estimated from Venus Express VIRTIS images and Magellan altimetry, Icarus 217, 474-483, 2012.
[7] Campbell, B. A. et al.: The mean rotation rate of Venus from 29 years of Earth-based radar observations, Icarus 332, 19-23, 2019.
How to cite: Lévesque, M., Rosenblatt, P., Dumoulin, C., Marty, J.-C., and Pätzold, M.: Determination of Venus’ rotation state using radio-tracking data from the Venus Express spacecraft, Europlanet Science Congress 2024, Berlin, Germany, 8–13 Sep 2024, EPSC2024-489, https://doi.org/10.5194/epsc2024-489, 2024.
With one Venusian day being 243 Earth days, the rotational bulge of Venus has the thickness of a few tens of centimetres only, making the Earth’s hotter twin the least rotationally stable planet in the Solar System. There could be a unique link between internal and rotational dynamics on such slowly rotating bodies. This is because the redistribution of mass driven by mantle convection produces perturbations of the body’s inertia tensor that are comparable in amplitude with those associated with the rotational flattening. In effect, Venus may respond to mantle convection by large-amplitude wobbling (Spada et al., 1996), that is, the orientation of Venus with respect to its rotation axis may cyclically change. Wobbling is detectable when both the rotational and the figure axes are measured accurately. The present-day estimate for the angle between the two axes, i.e. the wobble amplitude, is 0.5°, but it is based on gravity models with a limited resolution (Konopliv et al., 1999). Future missions to Venus, namely VERITAS and EnVision, are likely provide a more robust measurement.
The geodynamic regime of Venus’ mantle remains enigmatic. Observational data does not support the existence of continuous plate tectonics on its surface, but some recent evidence of ongoing tectonic and volcanic activity (e.g. Herrick and Hensley, 2023) and crater statistics analyses (e.g. O'Rourke et al., 2014) indicate that the planet is unlikely to be in a stagnant lid regime (see also Rolf et al., 2022).
Here we perform 3D spherical mantle convection simulations of the different possible tectonic scenarios and compute the resulting reorientation (or true polar wander, TPW) of Venus. The TPW path is accompanied with a wobble whose average amplitude we evaluate and compare to the present day estimate of 0.5° (Konopliv et al., 1999). We show that it is unlikely that the present-day wobble of Venus is triggered by mantle convection. For most simulated scenarios, the convection-induced wobble has at least one order of magnitude smaller amplitude when compared to the observed value.
The wobble amplitude is proportional to the rate at which the main inertia direction of mantle convection (MID-MC) changes – the largest wobble is thus obtained in cases with rapid surface mobilization. In simulations with a catastrophic resurfacing, the MID-MC rate reaches its maximum during the lithospheric overturn, and the convection-induced wobble gets closer to the observed value. In a few millions of years after the resurfacing event, however, the wobble amplitude drops again.
References
Herrick, R., Hensley, S., 2023. Surface changes observed on a venusian volcano during the magellan mission. Science
doi:10.1126/science.abm7735.
Konopliv, A., Banerdt, W., Sjogren, W., 1999. Venus gravity: 180th degree and order model. Icarus 139, 3–18. doi:10.1006/icar.1999.6086.
O'Rourke, J.G., Wolf, A.S., Ehlmann, B.L., 2014. Venus: Interpreting the spatial distribution of volcanically modified craters. Geophys. Res. Lett. 41, 8252–8260. doi:10.1002/2014gl062121.
Rolf, T., Weller, M., G ̈ulcher, A., Byrne, P., O’Rourke, J.G., Herrick, R., Bjonnes, E., Davaille, A., Ghail, R., Gillmann, C., Plesa, A.C., Smrekar, S., 2022. Dynamics and evolution of venus’ mantle through time. Space Science Reviews 218, 70. doi:10.1007/s11214-022-00937-9.
Spada, G., Sabadini, R., Boschi, E., 1996. Long-term rotation and mantle dynamics of the Earth, Mars, and Venus. J. Geophys. Res. Planets 101, 2253–2266. doi:10.1029/95JE03222.
How to cite: Patočka, V., Maia, J., and Plesa, A.-C.: Linking internal and rotational dynamics: the amplitude of mantle convection driven wobble of Venus, Europlanet Science Congress 2024, Berlin, Germany, 8–13 Sep 2024, EPSC2024-768, https://doi.org/10.5194/epsc2024-768, 2024.
Last year, the first active lava flow on Venus was discovered by Herrick & Hensley (2023), adding to the growing body of evidence that Venus is currently volcanically active with frequently erupting volcanoes (Byrne & Krishnamoorthy, 2022; Van Zelst, 2022). This discovery immediately begged the question as to whether Venus is seismically active at present as well. Indeed, more and more theoretical studies show that Venus could be seismically active today (Van Zelst et al., 2024). In the next decade, we will unravel some of Venus' secrets through a multitude of Venus-bound missions, but determining the seismic activity of the planet is not one of their main goals. Missions to Mars and the Moon have shown the wealth of information that can be gleaned from seismic studies of a planet. We argue here that the seismological exploration of Venus — ‘the quest for quakes on Venus' — should be the next priority of space agencies.
We first estimate upper and lower bounds on the expected annual seismicity of Venus by scaling the seismicity of the Earth. We consider different scaling factors for different tectonic settings and account for the lower seismogenic zone thickness of Venus. We find that 95 — 296 venusquakes equal to or larger than moment magnitude (Mw) 4 per year are expected for an inactive Venus, where the global seismicity rate is assumed to be similar to that of continental intraplate seismicity on Earth. For the active Venus scenarios, we assume that the coronae, fold belts, and rifts of Venus are currently seismically active. This results in 1,161 — 3,609 venusquakes equal to or larger than Mw 4 annually as a realistic lower bound and 5,715 — 17,773 venusquakes equal to or larger than Mw 4 per year as a maximum upper bound for an active Venus.
To assess whether any quakes could occur at all at Venus’ high temperatures, we estimate the seismogenic thickness of the planet in three independent ways: through estimates from flexure, through geodynamic models, and through estimates from mantle density anomalies. For all these estimates, we look at the depths of the 600°C and 800°C isotherms as the maximum limit of brittle failure and hence the maximum depth of the seismogenic zone. The seismogenic thickness estimates we find show a large range depending on the assumptions we make for each different method, but in general show that the seismogenic thickness on Venus is on average approximately 10 to 35 km globally.
To learn more about venusquakes and deduce the interior structure of Venus from them, the detection of seismic waves is crucial. Various concepts to measure seismic waves on Venus have already been explored in the past decades. These detection methods include typical geophysical ground sensors already deployed on Earth, the Moon, and Mars; pressure sensors on balloons; and airglow imagers on orbiters to detect ground motion, the infrasound signals generated by seismic waves, and the corresponding airglow variations in the upper atmosphere. Here, we provide a first comparison between the detection capabilities of these different measurement techniques and our estimates of Venus' seismic activity. In addition, we discuss the performance requirements and measurement durations required to detect seismic waves with the various detection methods.
We also briefly suggest target regions with a high likelihood of significant surface deformation and/or seismicity for current and future missions. These targets are particularly useful for the upcoming VERITAS (Venus Emissivity, Radio Science, InSAR, Topography and Spectroscopy) and EnVision missions. They would specifically benefit from the repeat pass interferometry of VERITAS, which detects surface deformation and can therefore in principle constrain the maximum displacement of surface faulting at locations that are visited twice during the mission.
Our extensive study into the potential seismicity of Venus could be used to drive the design of future mission concepts aiming to study the seismicity of Venus.
References
Byrne, P. K., & Krishnamoorthy, S. (2022). Estimates on the frequency of volcanic eruptions on Venus. Journal of Geophysical Research: Planets, 127(1), e2021JE007040.
Herrick, R. R., & Hensley, S. (2023). Surface changes observed on a Venusian volcano during the Magellan mission. Science, 379(6638), 1205-1208.
Van Zelst, I. (2022). Comment on “Estimates on the Frequency of Volcanic Eruptions on Venus” by Byrne and Krishnamoorthy (2022). Journal of Geophysical Research: Planets, 127(12), e2022JE007448.
Van Zelst, I., Maia, J., Plesa, A.-C., Ghail, R. C., Spühler, M. (2024). Estimates on the possible annual seismicity of Venus. EarthArxiv, 10.31223/X5DQ0C
How to cite: van Zelst, I., Crameri, F., De Toffoli, B., Garcia, R. F., Ghail, R., Gülcher, A. J. P., Horleston, A., Kawamura, T., Klaasen, S., Lefevre, M., Lognonné, P., Maia, J., Näsholm, S. P., Panning, M., Plesa, A.-C., Sabbeth, L., Smolinski, K., Solberg, C., and Stähler, S.: The quest for quakes on Venus , Europlanet Science Congress 2024, Berlin, Germany, 8–13 Sep 2024, EPSC2024-1010, https://doi.org/10.5194/epsc2024-1010, 2024.
Detecting ongoing volcanic activity on Venus presents significant challenges due to the planet's dense atmosphere, which hinders direct observation of the surface via satellite optical imagery. The most comprehensive data on Venus’s surface morphology to date have been provided by radar images acquired by the Magellan spacecraft, which orbited the planet from 1990 to 1994 (Ford, 1993).
Evidence of geologically recent volcanic activity, on the scale of millions of years, has been supported by indirect markers such as variations in atmospheric SO2 levels (Esposito, 1984), changes in surface thermal emissivity (Smrekar et al., 2010), and detailed morphological analyses of volcanic-related features (Gülcher et al., 2020). Furthermore, the direct observation of a volcanic vent deforming between successive Magellan observations has been interpreted as indicative of active volcanic processes (Herrick & Hensley, 2023). However, until now, clear evidence of active lava flows on the Venusian surface has not yet been found.
To address this, we processed and coregistered Magellan images and applied a change detection technique similar to those used for radar data acquired on Earth (Lee et al., 2023). Specifically, we utilized mosaics generated from Full-Resolution Basic Image Data Records (F-BIDRs), having a spatial resolution of 75 m/px (Saunders et al., 1992). The regions of Venus observed by Magellan were specifically chosen where images from at least during Cycle 1 (mid-September 1990 to mid-May 1991) and Cycle 3 (mid-January to mid-September 1992) were available. This ensured consistent comparisons as both cycles employed a leftward-looking radar-viewing geometry, minimizing discrepancies caused by different viewing direction. Our processing involved more precise image realignment using tie points identified with ArcGIS pro georeferencing tools, speckle noise removal using dedicated despeckling techniques, and change detection algorithms based on the threshold evaluation method described by Kittler & Illingworth (1986).
The analysis revealed evident changes in radar backscatter in two specific regions: the western flank of Sif Mons and the western part of Niobe Planitia. The western flank of Sif Mons, a broad shield volcano located in Eistla Regio, showed a notable increase in radar backscattering in correspondence of lava flows, covering approximately 30 km². This intensification in Cycle 3 images, superimposed on the darker flows from Cycle 1, strongly indicates ongoing volcanic activity. Similarly, in the western Niobe Planitia, a volcanic plain characterized by the presence of numerous small shield volcanoes, new, bright, sinuous lineations were observed extending northeastward, covering about 45 km². These features, visible only in Cycle 3 data, also suggest the deposition of new lava during the Magellan mission.
With the upcoming VERITAS and EnVision missions from NASA and ESA respectively, which will acquire new radar images of Venus’s surface with significantly improved spatial resolutions compared to the Magellan probe (Ghail et al., 2018; Smrekar et al., 2022), further change detection analyses will become feasible. These advancements will not only enhance image quality but also enable comparisons between historical Magellan data and new mission images, providing a more comprehensive understanding of the planet's geological changes over time (Whitten et al., 2021).
Acknowledgements
G.M., D.S. and M.M. acknowledge support from the Italian Space Agency (Grant No. 2022-15-HH.0).
References
Ford, J. P. Guide to Magellan Image Interpretation. National Aeronautics and Space Administration, Jet Propulsion Laboratory, California Institute of Technology (1993).
Esposito, L. W. Sulfur dioxide: episodic injection shows evidence for active Venus volcanism. Science 223, 1072–1074 (1984).
Smrekar, S. E. et al. Recent hotspot volcanism on Venus from VIRTIS emissivity data. Science 328, 605–608 (2010).
Gülcher, A. J. et al. Corona structures driven by plume–lithosphere interactions and evidence for ongoing plume activity on Venus. Nat. Geosci. 13, 547–554 (2020).
Herrick, R. R. & Hensley, S. Surface changes observed on a Venusian volcano during the Magellan mission. Science 379, 1205–1208 (2023).
Lee, J. Y., Jung, S. W., & Hong, S. H. Mapping lava flow from the Kilauea eruption of 2018 in the east rift zone using space-based synthetic aperture radar. GISci. Remote Sens. 60(1), 2176275 (2023).
Saunders, R. et al. Magellan mission summary. J. Geophys. Res.: Planets 97, 13067–13090 (1992).
Kittler, J. & Illingworth, J. Minimum error thresholding. Pattern Recognit. 19, 41–47 (1986).
Ghail, R. C. et al. VenSAR on EnVision: taking Earth observation radar to Venus. Int. J. Appl. Earth Obs. Geoinf. 64, 365–376 (2018).
Smrekar, S. et al. VERITAS (Venus Emissivity, Radio Science, InSAR, Topography, and Spectroscopy): a discovery mission. In 2022 IEEE Aerospace Conference (AERO) 1–20 (IEEE, 2022).
Whitten, J., Smrekar, S., Hensley, S., Dyar, M., & Nunes, D. (2021, December). VERITAS: Change Detection and Community Involvement in Target Selection. In AGU Fall Meeting Abstracts (Vol. 2021, pp. P34B-05).
How to cite: Sulcanese, D., Mitri, G., and Mastrogiuseppe , M.: Ongoing Volcanic Activity on Venus: Insights from Magellan Radar Data, Europlanet Science Congress 2024, Berlin, Germany, 8–13 Sep 2024, EPSC2024-891, https://doi.org/10.5194/epsc2024-891, 2024.
The observation of low viscosity lava flows and shield volcanoes on radar maps, combined with in-situ X-ray fluorescence analyses performed by three Soviet landers, strongly suggests that Venus' crust is primarily basaltic. Still, some of the most intriguing features of Venus are its crustal plateaus, characterized by heavily deformed terrains, which have long been suggested to bear a superficial resemblance to Earth’s continental crust and mountain ranges. Infra-red emissivity spectra from the Galileo and Venus Express missions tend to support the presence of a larger fraction of felsic minerals in the plateaus compared to the surrounding basaltic plains [1-2].
On Earth, flux melting of the mantle wedge at subduction zones, followed by fractional crystallization or partial melting of hydrous basalts, are believed to be the two primary mechanisms generating the large volumes of intermediate to felsic rocks that make up the continental crust. By contrast, igneous differentiation of water-poor basaltic melts typically yields negligible amounts of felsic melts. The possibility that highland plateaus are dominated by intermediate to felsic rocks will be evaluated by the EnVision and Veritas missions, in the hope of providing evidence for the presence of water oceans and, therefore, habitable conditions in Venus' distant past.
In this work, we show, using thermodynamic calculations (Perple_X), that the melting of dry eclogite is another viable mechanism that can produce large volume of intermediate to felsic melts, in the absence of water. An average basaltic crust, of composition identical to the ones analyzed at the Venera 14 and Vega 2 landing sites, would transform into a quartz eclogite at a depth of 50 to 60 km. Partial melting of this material can produce 15-25 % of dacitic melts. The crust of Venus could have reached this depth under crustal plateaus, according to gravity and topography investigations [3]. It has also been suggested that the current young surface of Venus could indicate that abundant basaltic material was recycled to the mantle [4]. Remelting of this material could fuel occasional but large-scale magmatic events and account for the formation of felsic crustal plateaus in the absence of water. Confirmation that crustal plateaus are dominantly felsic by future missions might therefore not necessarily indicate that wetter and more hospitable conditions prevailed on early Venus.
[1] G. L. Hashimoto et al. (2008) Felsic highland crust on Venus suggested by galileo near-infrared mapping spectrometer data. J. Geophys. Res.: Planet 113, E00B24.
[2] M. S. Gilmore, N. Mueller, J. Helbert (2015) VIRTIS emissivity of Alpha Regio, Venus, with implications for tessera composition. Icarus 254, 350–361.
[3] J. S. Maia, M. A. Wieczorek (2022) Lithospheric structure of Venusian crustal plateaus. J. Geophys. Res.: Planet. 127, e07004.
[4] S. E. Smrekar, A. Davaille, C. Sotin (2018) Venus Interior Structure and Dynamics. Space Science Reviews 214(5), 88.
How to cite: Collinet, M., Maia, J., Plesa, A.-C., Klemme, S., and Wieczorek, M.: Formation of intermediate to felsic crustal plateaus on Venus: Is water required?, Europlanet Science Congress 2024, Berlin, Germany, 8–13 Sep 2024, EPSC2024-1110, https://doi.org/10.5194/epsc2024-1110, 2024.
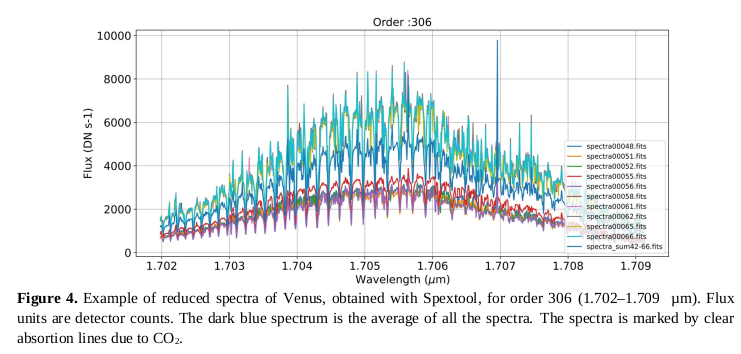
Simulations of spectra during a volcanic event
The composition and the variability of the lower atmosphere of Venus are critical to understanding the surface-atmosphere interactions, the atmospheric evolution and the volatile exchanges between the interior and the atmosphere [1, 2, 3]. The lower atmosphere can be investigated on the near-infrared spectral windows on the nightside, centered at 1.18 µm (0-15 km), 1.74 µm (20-30 km) and 2.3 µm (30-45 km) [4, 5], which provides a chance to detect volcanic species such as H2O, SO2. CO, HCl and HF, which are common species on Earth volcanoes [3].
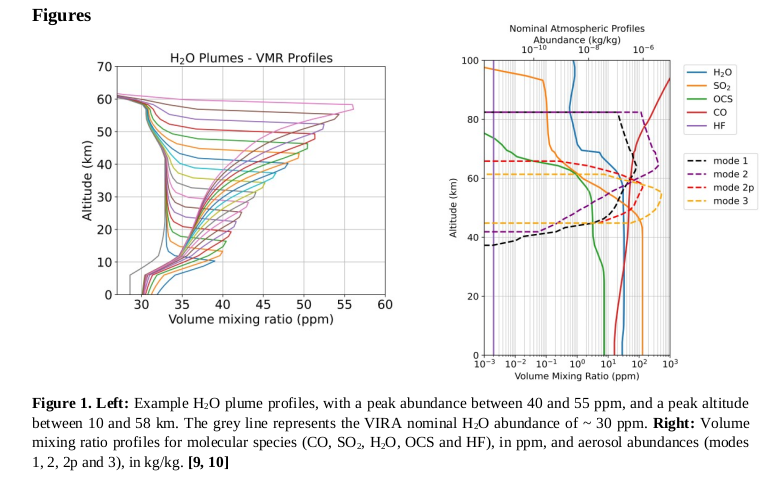
The Planetary Spectrum Generator (PSG) [6, 7, 8] was used to simulate the nightside 2.3 µm spectrum of Venus, in nadir-geometry, using a VIRA atmospheric template for temperature and molecular vertical abundance profiles and four aerosol modes, of effective radii of 0.49 µm, 1.18 µm, 1.56 µm and 4.25 µm [9, 10]. The spectral resolution was defined as R = 7500.
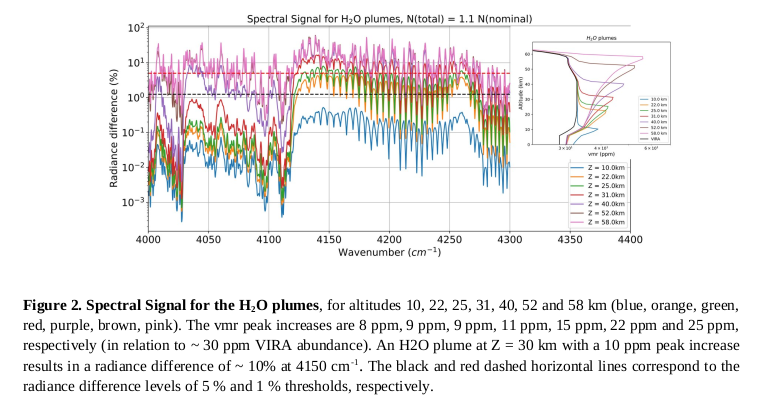
An H2O volcanic gas plume was modeled using a Johnson unbounded distribution, with a maximum value of volume mixing ratio (vmr) at a chosen altitude and a slow decrease towards lower altitudes. The profile was defined as a perturbation of the VIRA nominal H2O profile (~ 30 ppm). with a peak vmr in the range 10-70 ppm and a peak altitude in the range 10-58 km. For each plume, the total integrated column density was conserved, defined as a scaler of the VIRA value, N(total)(H2O) ~ 13.23 kg m-2.
An H2O plume at Z = 30 km with a 10 ppm peak increase results in a radiance difference of ~ 10% at 4150 cm-1. Ground-based observations and future space missions, such as iSHELL/IRTF and EnVision’s VenSpec-H spectrograph [11], respectively, should have the high-spectral resolution and sensitivity required to detect such H2O variations due to a possible volcanic eruption event.
Spectral Retrievals of iSHELL/IRTF spectra
On this framework, we are currently investigating the sensitivity of iSHELL/IRTF to retrieve the abundance of H2O and its temporal and latitudinal variability using the near-infrared spectral window at 1.74 µm (20-30 km) and 2.3 µm (30-45 km) [4]. The retrieval is ongoing with the ASIMUT tool (Vandaele+2006) [12].
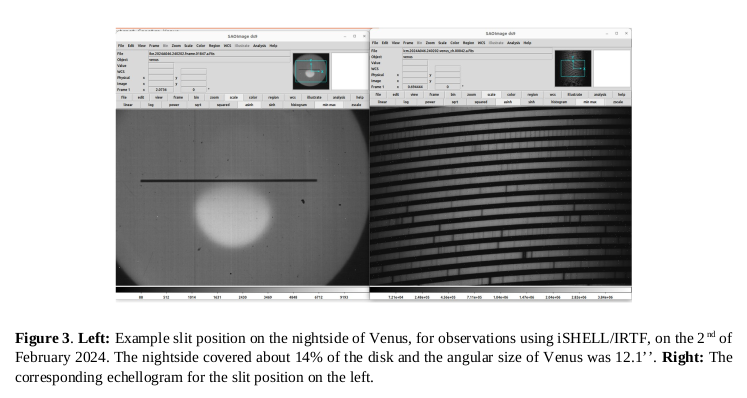
We performed 6 hours of observations, in February 2nd-3rd 2024, of Venus dayside and nightside using the K3 (2.26-2.55 µm) and H3 filters (1.64-1.82 µm) on the iSHELL/IRTF instrument. The slit width used was 0.375’’ x 5’’ (R ~ 75 000) and it was positioned parallel to the axis of rotation. iSHELL is a cross-dispersed high-spectral resolution 1.1-5.3 µm echelle spectrograph (R ~ 80 000), located in Maunakea, Hawaii [13]. Wavelength calibration, flat fielding, dark correction and sky subtraction were performed using the Spextool data reduction software [14, 15].
The dayside straylight contribution on the nightside, in order 306, was removed by scaling of the dayside spectra with a scaler computed as the nightside/dayside ratio, in order 295 (1.764-1.771 µm), where we modeled expected counts ~ 0.
We identified several CO2 absorption lines in order 306 (1.702–1.709 µm) and 305 (1.708-1.714 µm) and some hints of H2O and HCl absorption lines in order 300 (1.735-1.742 µm). The absolute flux calibration and retrieval of the H2O and HCl column densities are currently ongoing, using ASIMUT [12].
References. (1) Gilmore et al. 2023, Space Sci Rev. (2) Gillmann et al. 2022, Space Sci Rev (3) Wilson et al. 2024, Space Sci Rev (4) Bézard et al. 2009, JGR Planets (5) Tsang et al. 2009, Journal of Quantitative Spectroscopy and Radiative Transfer (6) Villanueva et al. 2018, Journal of Quantitative Spectroscopy and Radiative Transfer; (7) Smith et al. 2013, JGR Planets (8) Dias et al. 2022, Atmosphere (9) Zasova et al. 2006, Cosmic Research; (10) Haus et al. 2010, Icarus (11) Robert et al. 2021, EPSC. (12) Vandaele et al. 2006, Proc of the First 'Atmospheric Science Conference' (13) Rayner et al. 2022, PASP 134 (14) Cushing et al. 2004, PASP 116 (15) Vacca et al. 2003, PASP 115.
Funding. This work was supported by FCT through the research grants UIDB/04434/2020 and UIDP/04434/2020 and a fellowship grant 2022.09859.BD. Funded by ESA in the framework of MWWM - Mars Wind and Wave Mapping project. SR acknowledges funding by BELSPO with financial and contractual support coordinated by the ESA Prodex Office (PEA 4000137943, 4000128137).
Acknowledgements. We kindly thank Maxence Lefévre, from the University of Oxford, for the discussions on volcanic gas plumes, and Shohei Aoki, from the University of Tokyo, for the collaboration concerning the data reduction.
How to cite: Dias, J., Machado, P., Robert, S., Erwin, J., C. Duarte, J., and Quirino, D.: Volcanic gas plumes’ effects on the spectrum of Venus, Europlanet Science Congress 2024, Berlin, Germany, 8–13 Sep 2024, EPSC2024-519, https://doi.org/10.5194/epsc2024-519, 2024.
The temperature and dynamics of the planetary boundary layer (PBL), i.e. the atmosphere closest to the surface, are important to many aspects of Venus science. The characteristics of the PBL are critical for the exchange of angular momentum between atmosphere and solid planet possibly affecting the planets spin rate (Mueller et al. 2012, Navarro et al. 2018, Margot et al. 2020). Stability of surface minerals is temperature dependent and a related temperature albedo feedback has been proposed to stabilize the Venus climate (Hashimoto and Abe 2005). Some gravity science investigations are enabled by thermal tides, which include the PBL (Cascioli et al. 2021). The dielectric behavior of minerals is temperature dependent and apparent changes of radar emissivity with surface elevation have been interpreted in terms of mineralogy (Brossier et al. 2021). Even more relevant for the remote sensing of surface mineralogy is that for determination of surface emissivity in the near infrared the surface temperature has to be known very well (Kappel et al. 2015).
The PBL is not well resolved by in-situ data. The temperature gathered during the descent of the many Venera missions does not have a very high sampling frequency and has high uncertainty so that the PBL is not discernable (Seiff et al. 1985). The temperature sensors of the four Pioneer Venus descent probes all failed above the PBL at about 12 km about mean planetary radius, so that no details of the PBL are included in the Venus International Reference Atmosphere (Seiff et al. 1985). The last descent probe VeGa 2 observed at a higher frequency and better uncertainty but the results between 1 and 6 km were considered implausible, because the observed temperature lapse rate exceeded the calculated adiabatic lapse, i.e. the stratification should have been unstable.
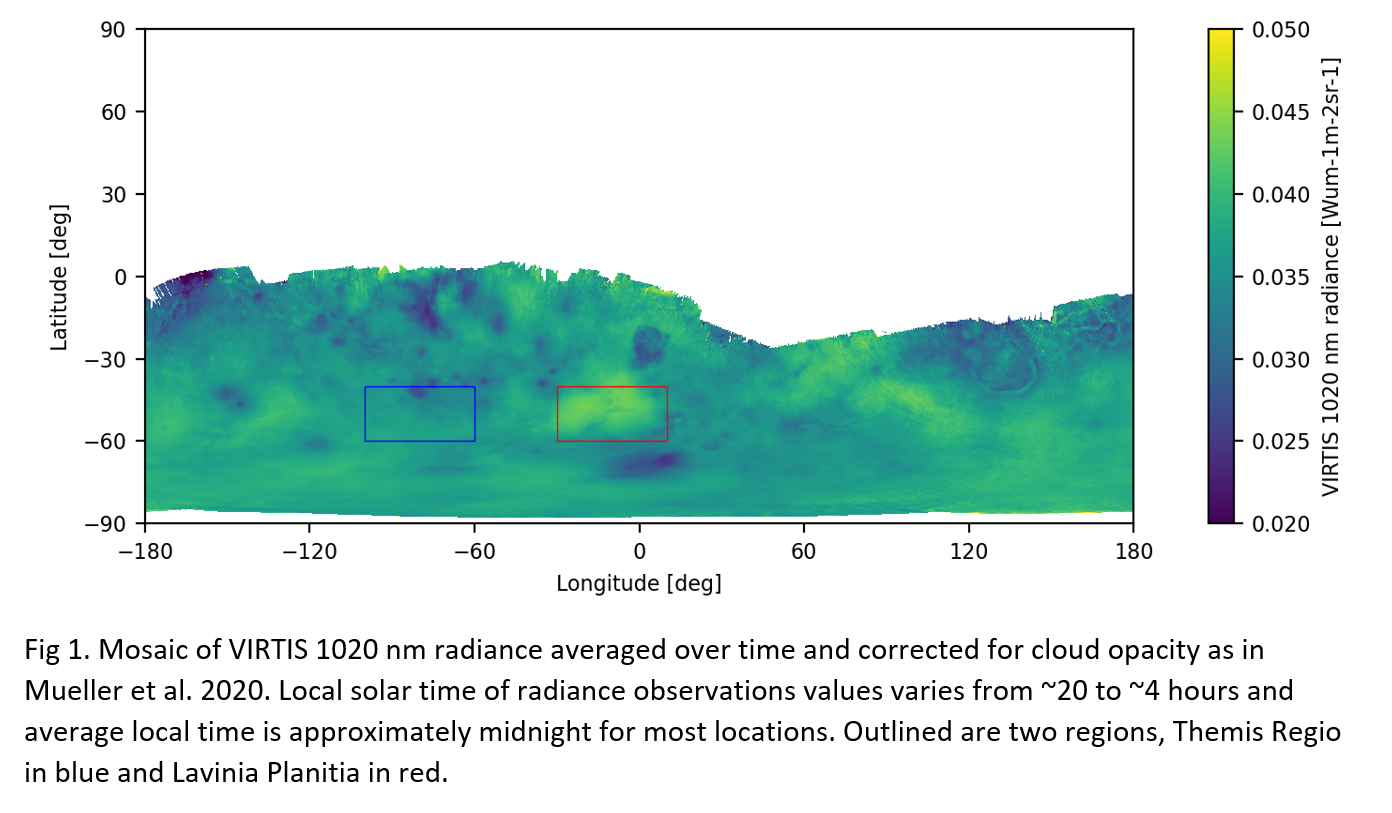
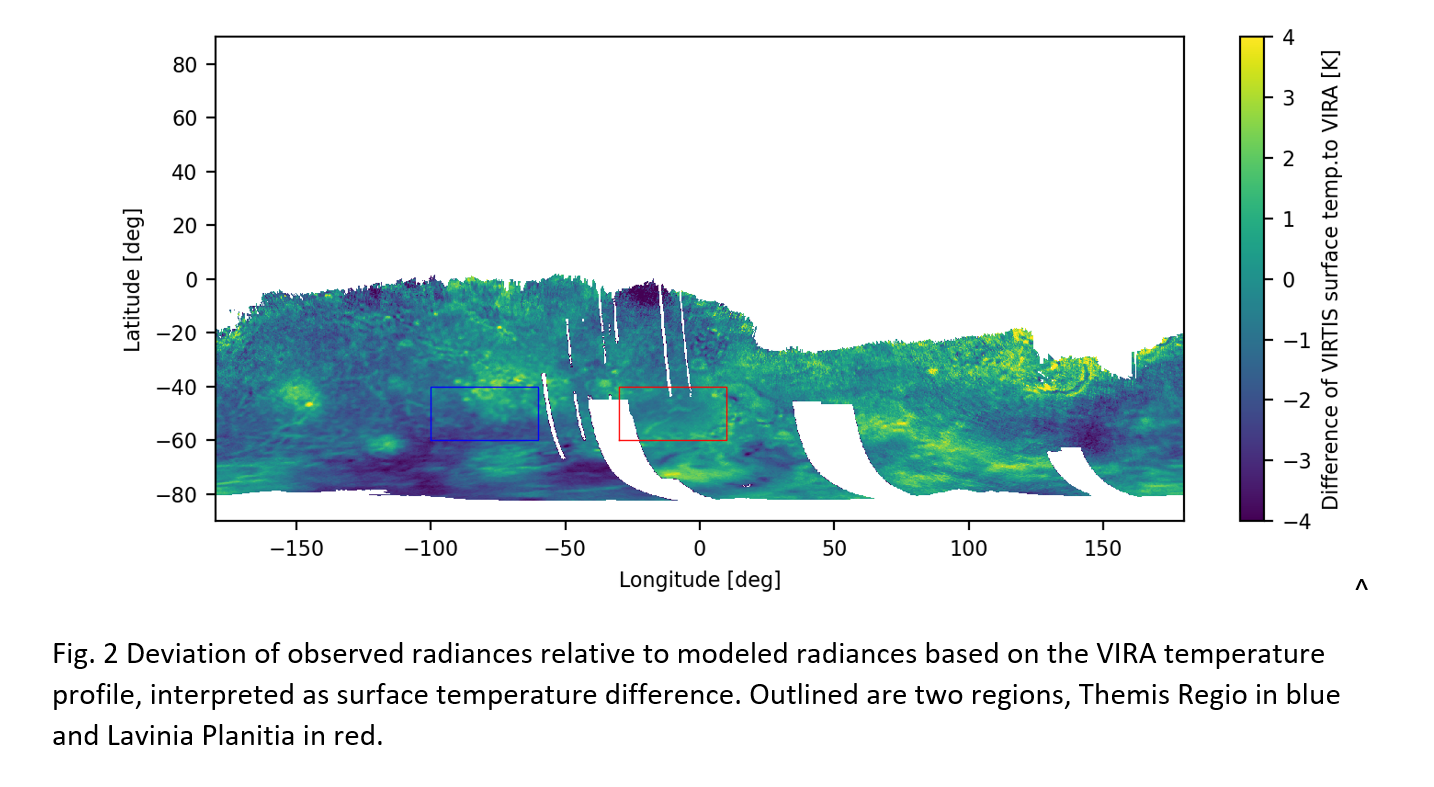
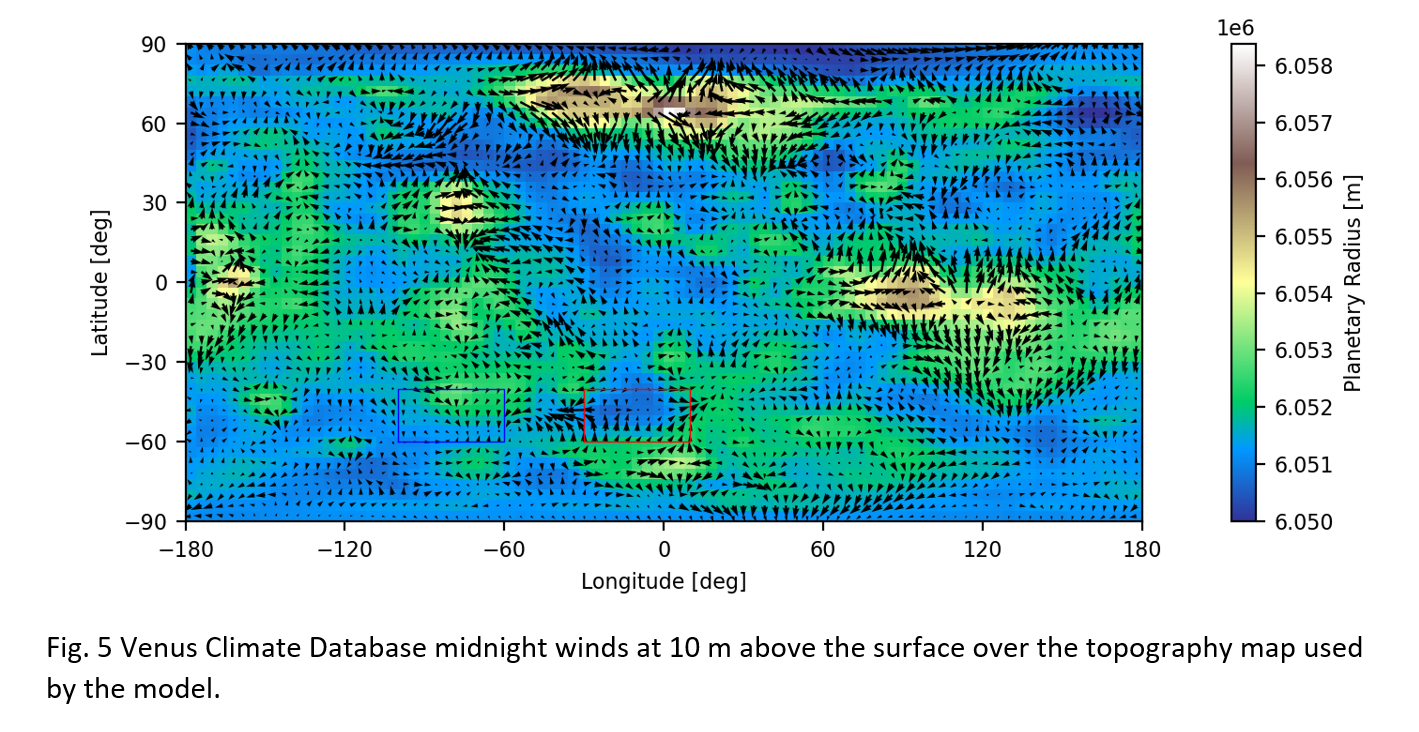
The PBL is not easily accessible to remotes sensing. There are however indirect constraints on the PBL temperature from observations of surface thermal emission through the spectral windows near 1 µm. The Venus Express mission provided with the VIRTIS instrument an extensive data set of thermal emission, that is however mostly limited to the southern hemisphere which does not have highlands reaching far into the layer where VeGa2 found an apparently superadiabatic lapse rate. Mueller et al. 2020 processed the data to a mosaic (Fig. 1) and derived emissivity, again assuming surface temperature corresponding to the VIRA profile. The resulting emissivity is very well correlated with topography in the range from -2 to +2 km relative to the mean planetary radius (MPR) of 6052 km, which is geologically not plausible. The alternative interpretation is again a deviation from the temperature profile assumed in the model instead of a variable emissivity. The model of Mueller et al. 2020 was not used to explore the effect of deviations from the temperature profile but it is possible to estimate the effect. In absence of atmospheric emission, which is approximately true for the 1020 nm window [Meadows and Crisp 1996], the top-of-atmosphere radiance is proportional to the blackbody function at surface temperature. The relative difference between the observed and model TOA radiance can therefore be expressed as the corresponding temperature difference to the model (Fig. 2).
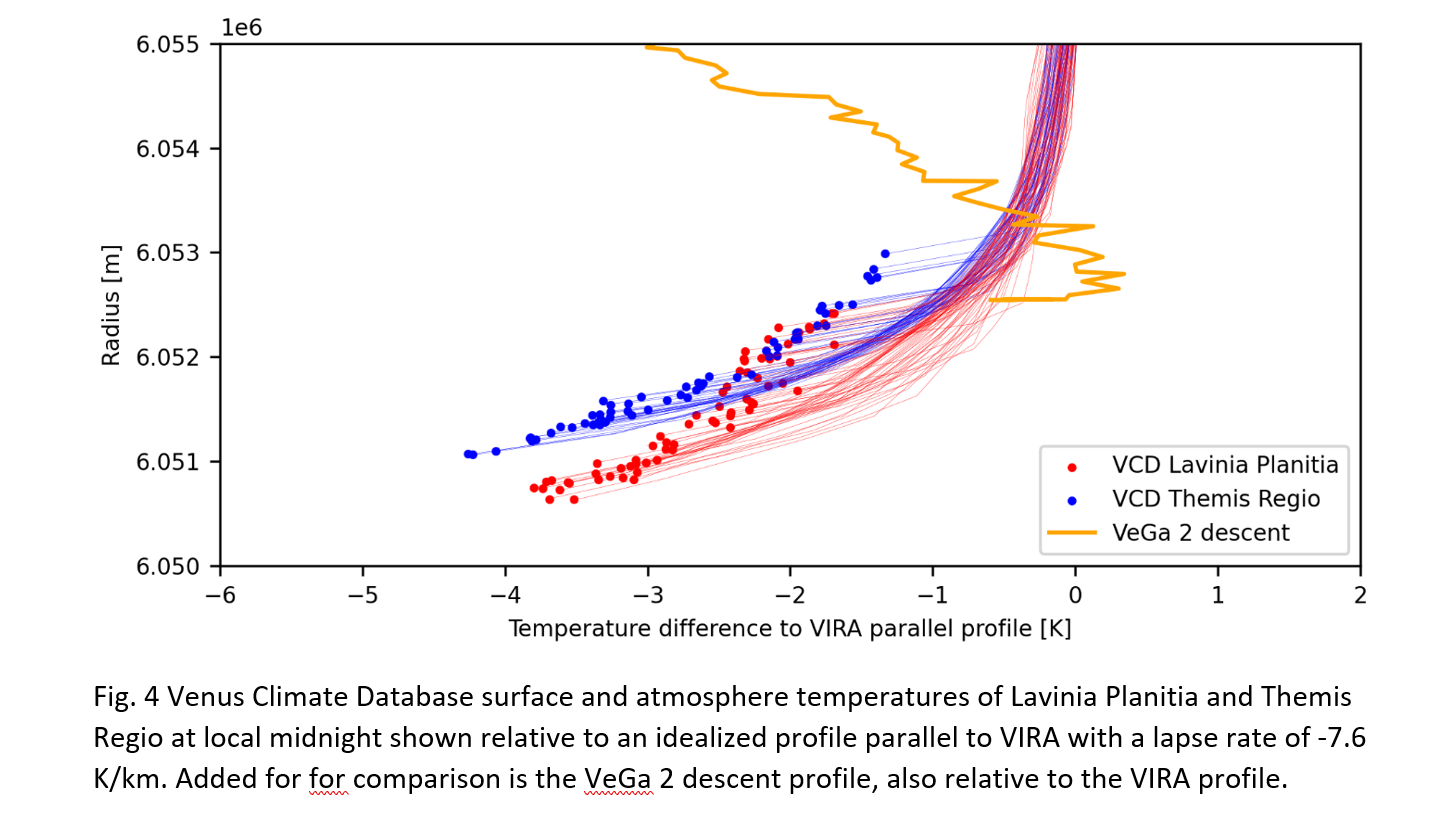
Figure 3 shows the result as function of planetary radius for two regions, Lavinia Planitia and Themis Regio, that were often observed by VIRTIS and were selected because they show large temperature differences at the same elevation and lie on the same latitude band. The differences to the VIRA profile are up to -5K and increase to the lowlands, indicating a lower lapse rate than VIRA. At above 6053 km there is a hint that the lapse rate could reverse and follow the apparently super-adiabatic lapse rate observed by VeGa2, but this is ambiguous. This high location is a single corona and relatively low emissivity would be a geologically plausible alternative explanation [Stofan et al. 2016]. To study the VeGa2 profile, observations at higher elevations are necessary, e.g. those made by Akatsuki IR 1 [Kulkarni et al. 2021] or Parker Solar Probe WISPR [Lustig Yaeger et al. 2023].
The difference in temperature between the two regions is surprising because studies to derive emissivity assumed that the surface temperature was only a function of elevation since heat redistribution by convection is very effective e.g. (Hashimoto et al. 2008). Comparison to the Venus Climate Database, which models the PBL and its interaction with topography (Lebonnois et al. 2018) shows clear similarities (Fig. 4). The midnight surface temperature below 1 km above MPR has a lower lapse rate than VIRA and the Lavinia Planitia basin is warmer than the flanks of the Themis Regio volcanic rise at the same surface elevation. This temperature difference persists over the Venus day in the model. Our working hypothesis is that the relatively constant slope winds of Venus in combination with the different cooling rates of atmosphere and surface at night redistribute heat and thus create these surface temperature differences.
Overall, the differences to VIRA observed by VIRTIS are about two times larger than those in the model. One possibility could be that the approximation for surface temperature exaggerates temperature contrast. This seems unlikely but we will check this using a radiative transfer model. Another possibility is that the difference can be explained by the low resolution of the GCM (~400 km) and the correspondingly more muted topography. In any case, near infrared imaging provides data that can be compared to modeled surface temperatures of GCMs and thus provide indirect evidence on the planetary boundary layer. Upcoming missions will image these wavelengths with a much-improved signal to noise ratio which may additionally provide surface temperature change rates at night.
Mueller,+(2012).doi:10.1016/j.icarus.2011.09.026; Navarro,+(2018).doi:10.1038/s41561-018-0157-x; Margot,+(2021).doi:10.1038/s41550-021-01339-7; Hashimoto,+(2005).doi:10.1016/j.pss.2005.01.005; Cascioli,+(2021)doi:10.3847/PSJ/ac26c0; Brossier,+(2021).doi:10.1029/2020JE006722; Kappel,+(2015).doi:10.1016/j.pss.2015.01.014; Seiff,+(1985).doi:10.1016/0273-1177(85)90197-8; Mueller,+(2020).doi:10.1016/j.icarus.2019.113400; Meadows,+(1996).doi:10.1029/95JE03567; Stofan,+(2016).doi:10.1016/j.icarus.2016.01.034; Kulkarni,+(2021).doi:10.5194/epsc2021-730; Lustig-Yaeger,+(2023).doi:10.3847/PSJ/ad0042; Hashimoto,+(2008).doi:10.1029/2008JE003134; Lebonnois,+(2018).doi:10.1016/j.icarus.2018.06.006

How to cite: Mueller, N., Kulkarni, S., Lebonnois, S., Das, A., and Rauer, H.: Venus surface temperature derived from VIRTIS on Venus Express in comparison to the Venus Climate Database, Europlanet Science Congress 2024, Berlin, Germany, 8–13 Sep 2024, EPSC2024-1062, https://doi.org/10.5194/epsc2024-1062, 2024.
1. Introduction
Below 10 km the dynamics of the Venus atmosphere is virtually unknown, only the VeGa-2 has successfully measured the temperature in that region. At the surface, only Venera-9 and 10 directly measured the wind for respectively 49 min and 90 s, and several other probes like Venera-13 and 14 measured indirectly the wind speed. The amplitude of the measured wind speed is inferior to 1 m/s [1] for the first 100 m.
The planetary boundary layer has been studied with a global circulation model (GCM) [2], exhibiting a strong effect of the solar heating on the amplitude of the slope wind in the tropics.
Two dune fields have been observed in radar measurements with Magellan [3], although the lack of knowledge about the spatial and temporal distribution of winds complicates the interpretation of sediment transport. The knowledge of the near-surface dynamics, winds and temperature cycles, is essential as the interaction between the surface and atmosphere is one of the objectives, with DAVINCI measuring temperature and winds at the surface [4], VERITAS and EnVision observing aeolian features [5]. In addition, several projects of long-duration lander at the surface of Venus, like the Seismic and Atmospheric Exploration of Venus (SAEVe) concept [6]. Characterization of the near-surface winds is also crucial to constrain lander trajectories/landing [7].
2. Model
To study the near-surface dynamics, the LMD Venus mesoscale model [8] is used, composed of the Weather-Research Forecast (WRF) non-hydrostatic dynamical core [9] coupled with the IPSL Venus GCM physics package [10]. Two domains were considered for this study, one centered on seven locations of VENERA landing sites, where winds were measured, and one centered on the North Pole where the largest mountain is located. The horizontal resolution is respectively 20 and 15 km. The mesoscale boundary conditions are forced with the IPSL Venus PCM.
3. Results
Fig 1 shows Snapshots map of horizontal winds 10m m above local surface (m/s) at noon (left) and midnight (right), exhibiting the diurnal cycle of surface wind. At night, there is the presence of katabatic winds, going down the slope, whereas at noon the winds are anabatic, going up the slope. This difference
cycle is due to the insolation of the surface. During the night, the potential temperature is significantly colder at the surface on the mountain slopes than at the same pressure level in the atmosphere away from the surface. This slope-induced baroclinicity drives the nighttime katabatic winds. During daytime, the reverse is true: the surface on the slopes is slightly warmer than the atmosphere at the same pressure level, inducing anabatic winds. There is also a strong variability of the amplitude of the wind. At noon, the wind over the first 100 m is below 1 m/s, consistent with the observations. At night however, the amplitude of the wind is larger. The amplitude of the wind is sufficient to engender saltation, especially at night. This diurnal cycle of the winds will have an impact on the surface temperature. In the flat low lands, the variation of the temperature will be around 4 K, whereas in the slope the temperature will vary only by less than 1 K. At high latitudes, the solar flux is much lower, and there is no diurnal cycle of the slope winds.
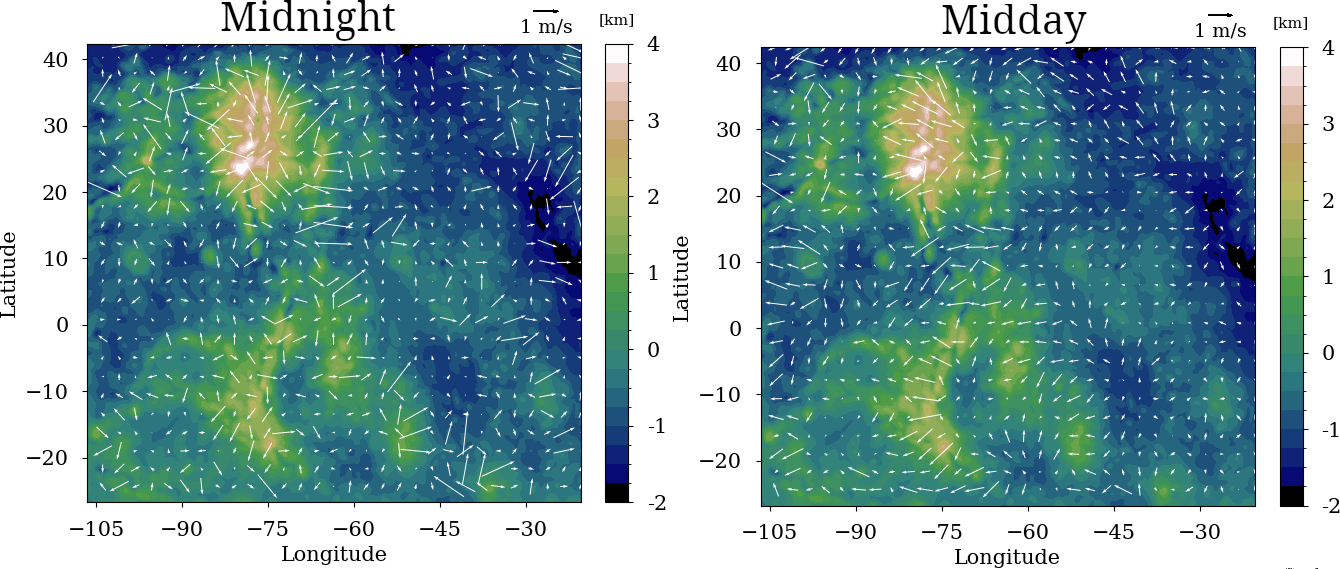
Figure 1: Snapshots map of horizontal winds 10 m above local surface (m/s) at noon (left) and midnight (right) in the center of the domain.
References
[1] Lorenz, R. D. Surface winds on Venus: Probability distribution from in-situ measurements. Icarus 264, 311–315 (2016).
[2] Lebonnois, S., Schubert, G., Forget, F. & Spiga, A. Planetary boundary layer and slope winds on Venus. Icarus 314, 149–158 (2018).
[3] Greeley, R. et al. Aeolian features on Venus - Preliminary Magellan results. Journal of Geophysical Research 97, 13 (1992).
[4] Garvin, J. B. et al. Revealing the Mysteries of Venus: The DAVINCI Mission. The Planetary Science Journal 3, 117 (2022).
[5] Ghail, R. C. et al. VenSAR on EnVision: Taking earth observation radar to Venus. International Journal of Applied Earth Observation and Geoinformation 64, 365–376 (2018).
[6] Kremic, T. et al. Long-duration Venus lander for seismic and atmospheric science. Planetary and Space Science 190, 104961 (2020).
[7] Knicely, J. J. C., Gilmore, M. S., Lynch, R. J. & Herrick, R. R. Strategies for safely landing on Venusian tesserae. Planetary and Space Science 228, 105652 (2023).
[8] Lefèvre, M., Spiga, A. & Lebonnois, S. Mesoscale modeling of Venus’ bow-shape waves. Icarus 335, 113376 (2020).
[9] Skamarock, W. C. & Klemp, J. B. A time-split nonhydrostatic atmospheric model for weather research and forecasting applications. Journal of Computational Physics 227, 3465–3485 (2008).
[10] Garate-Lopez, I. & Lebonnois, S. Latitudinal variation of clouds’ structure responsible for Venus’ cold collar. Icarus 314, 1–11 (2018).
How to cite: Lefevre, M., Lebonnois, S., spiga, A., and Forget, F.: Venus near-surface dynamics: slope winds and dust transport, Europlanet Science Congress 2024, Berlin, Germany, 8–13 Sep 2024, EPSC2024-384, https://doi.org/10.5194/epsc2024-384, 2024.
Venus and Earth share similar mass and radii and likely have a similar bulk composition. The present-day Venus atmosphere composition, surface pressure and temperature point to a distinct climate evolution from Earth's, which occurred at some point in the planet's climate history. The point of climate divergence with Earth and the leading mechanism(s) behind it have been pivotal topics for the climate modelling community. Some studies suggest that Venus was never habitable [e.g., 1]. For instance, warming from nightside stratospheric clouds has been proposed as a crucial climate process, preventing water condensation from the steam atmosphere in the first place [1]. Nonetheless, other studies suggest that different processes might support the Habitability of the paleo-Venus [2, 3, 4]. For instance, dayside cloud-albedo feedback might have supported early and prolonged surface Habitability in a slow-rotator world like Venus [4]. In fact, the high atmospheric D/H ratio in Venus (see 5 for a review) might suggest a large initial water reservoir. In this work, we assume that water condensation occurred and initial conditions in the paleo-Venus were favourable to the existence of a global ocean. The main objective is to study the ocean circulation and main properties of this Ocean (temperature, salinity, mixed layer depth) and how they respond to forcing parameters like insolation, rotation rate and the type of atmosphere (CO2 rich versus N2 rich).
We present simulations of a possible ocean on the paleo-Venus using the 3D GCM ROCKE-3D (Resolving Orbital and Climate Keys of Earth and Extraterrestrial Environments with Dynamics), developed at NASA Goddard Institute for Space Studies [6]. The model derives from the Earth GCM ModelE2-R [7]. The atmosphere is represented by 20 layers, with the uppermost layer at 0.1 hPa. The model uses a 13-layer, fully dynamic Ocean coupled to the atmosphere [8]. The simulations use a spatial resolution of 4º x 5º (latitude x longitude), and a modern Venus topography was selected, following the NASA/Magellan archive. We use a 310-m deep ocean, corresponding to an ocean volume of 1.4 x 10¹⁷ m3- one order of magnitude smaller than Earth's modern Ocean. This 310-m liquid water equivalent layer occupies the lowest topographic regions, corresponding to a ~ 60% global surface cover of the paleo-Venus. The land and ocean fraction latitudinal distribution can be seen in Figure 1. The simulations use the modern planetary parameters of surface gravity, radius, obliquity and eccentricity. Our baseline simulation simulates the paleo-Venus as a retrograde slow-rotator, with a rotation period of -243 sidereal Earth days. The insolation is 1.396 times the solar constant (1913.6 Wm-2), corresponding to 4.2 Gyr. The simulation uses a 1 bar CO2 -dominated atmosphere (97% CO2 and 3% N2). The first results show a pattern of sea surface temperature marked by the subsolar point's location and the land's latitudinal distribution.
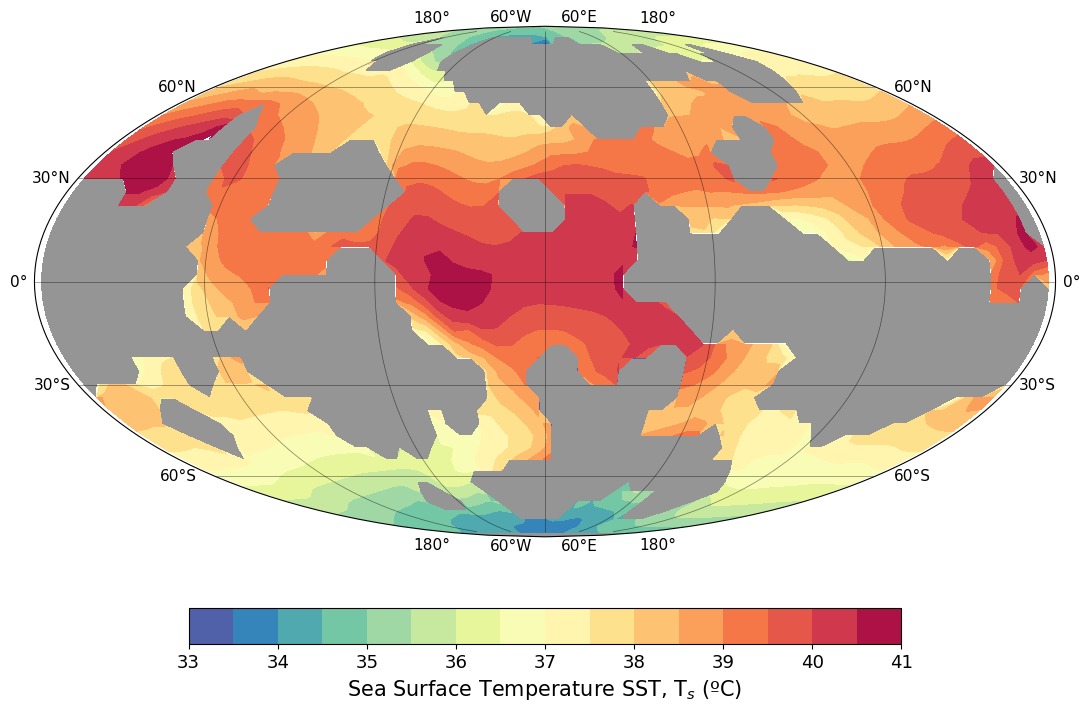
Figure 1. Sea surface temperature (SST) in ºC for the 310-m deep ocean on the paleo Venus at 4.2 Gyr with 1 bar CO2 – rich atmosphere. The subsolar point is located at latitude 0ºN and longitude 0ºW. The land area is identified in grey.
References
[1] Turbet M., et al., 2021. Nature. 276.
[2] Grinspoon D.H. & Bullock M.A., 2007. In Exploring Venus as a terrestrial planet. AGU.
[3] Way M.J., et al., 2016. GRL. 43.
[4] Way M.J. & Del Genio A.D. (2020). JGR:Planets. 125.
[5] Marcq E., et al., 2018. Space Sci Rev. 214:10.
[6] Way M.J., et al., 2017. ApJS. 213:12.
[7] Schmidt G.A., et al., 2014. J Adv Model Earth Syst. 6.
[8] Russell G.L., et al., 1995. Atmos-Ocean. 33:683.
Acknowledgements: Diogo Quirino acknowledges support from the Fundação para a Ciência e a Tecnologia (FCT) through the PhD Fellowship 2023.05220.BD.
How to cite: Quirino, D., Way, M., Green, M., Duarte, J., and Machado, P.: Ocean circulation on the paleo Venus with ROCKE-3D, Europlanet Science Congress 2024, Berlin, Germany, 8–13 Sep 2024, EPSC2024-1149, https://doi.org/10.5194/epsc2024-1149, 2024.
The ESA EnVision mission will determine the nature and current state of Venus' geological evolution and its relationship with the atmosphere, to understand how and why Venus and Earth evolved so differently. Perched at the inner edge of the Sun habitable zone, Venus may once have been habitable, with liquid water oceans, before developing the enormous greenhouse warming which renders it uninhabitable today, thus providing a natural laboratory for studying the evolution of habitability. Venus is Earth’s closest sibling geologically: similar in size to the Earth, it has remained active into the present era, unlike the much smaller Mars and Mercury. Venus is essential for understanding the links between planetary geophysical evolution and habitability of terrestrial planets from our own Earth to terrestrial planets and exoplanets everywhere, including those which will be the subject of study by PLATO and ARIEL missions in ESA’s Space Science program.
The VenSpec instrument suite is following the holistic approach of the EnVision mission by studying the coupled system of surface and atmosphere on Venus with three complementary instruments. In combination, VenSpec will provide unprecedented insights into the current state of Venus and its past evolution. VenSpec will perform a comprehensive search for volcanic activity by targeting atmospheric signatures, thermal signatures and compositional signatures, as well as a global map of surface composition. A joined VenSpec science team across the whole suite ensures that the synergies between the instruments are fully used.
A good example for the holistic investigation nature of the VenSpec suite is the characterization of volcanic plumes. VenSpec will follow them from close to the surface by the water vapor measurements of VenSpec-M and VenSpec-H, tracing them through the middle atmosphere with VenSpec-H and finally through the clouds to the upper atmosphere with VenSpec-U and VenSpec-H. This will be complementary with the direct detection of the thermal signature of lava flows on the surface by VenSpec-M as well as change detection by the VenSAR synthetic radar and the sub-surface radar (SRS) on EnVision.
The region above the clouds (65-75 km) will be primarily studied by VenSpec-U monitoring sulphured minor species (mainly SO and SO2) and the as yet unknown UV absorber in Venusian upper clouds, as well as the day-side observations of VenSpec-H monitoring the SO2 abundance. The region below the clouds (30-40 km) will be targeted by VenSpec-H with high resolution atmospheric measurements on the night side. The main objective is to detect and quantify variations in SO2, H2O and HDO abundances. The lower atmosphere (0-15km) will be target by combined nightside observation by VenSpec-H and VenSpec-M.
The overlapping altitude coverage of the VenSpec-H and -U channels allows to investigate how the upper atmosphere interacts with the lower atmosphere. Combined with the VenSpec-M information on the surface and in the lower atmosphere (0-15km) measurements of VenSpec-H and VenSpec-M this allows also to study the interaction between the surface and the atmosphere.
The surface will primarily be target by VenSpec-M which will provide near-global compositional data on rock types, weathering, and crustal evolution by mapping the Venus surface in five atmospheric windows. VenSpec-M take advantage of the improved altimetry provided by the NASA VERITAS VISAR and Envision VenSAR-derived DEMs.
| VenSpec Channel | Altitude Range | Day/Night | Expected measurements |
| U | above the clouds (65-75 km) | Day | SO and SO2 and the unknown UV absorber |
| H | above the clouds (65-75 km) | Day | SO2 |
| H | below the clouds (30-40 km) | Night | SO2, H2O and HDO |
| H | near-surface (0-15 km) | Night | H2O and HDO |
| M | near-surface (0-15 km) | Night | H2O |
| M | Surface | Night | Rock type, temperature |
How to cite: Helbert, J., Vandaele, A.-C., Marcq, E., Tackley, P., Machado, P., Min, M., Ferus, M., Vinatier, S., Lasue, J., Lara, L. M., Widemann, T., Robert, S., Alemanno, G., Erwin, J., Neefs, E., Bertran, S., Lustrement, B., Hagelschuer, T., Peter, G., and Wolff, F. and the VenSpec Team: The VenSpec suite on the ESA Envision mission – a holistic investigation of the coupled surface atmosphere system of Venus, Europlanet Science Congress 2024, Berlin, Germany, 8–13 Sep 2024, EPSC2024-423, https://doi.org/10.5194/epsc2024-423, 2024.
Understanding the composition and distribution of the unknown UV absorber (Figure 1) in the Venusian atmosphere has been an open question in planetary science for close to 100 years. Many candidates for the absorber have been proposed over the years. We focus on two possibilities: ferric chloride (FeCl3)[1] and the cis- and trans- forms of the SO dimer (OSSO)[2].
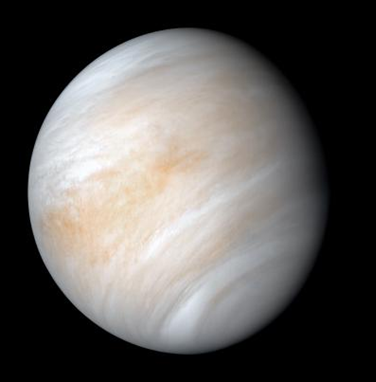
Figure 1: A false colour image of Venus. Regions of UV absorption appear orange. The cause of this absorption is unknown. Image credit: NASA/JPL-Caltech.
FeCl3 has been proposed to exist within the sulphuric acid cloud droplets, but the absorption spectrum of FeCl3 generally used in the literature was measured in ethyl acetate, which is not present on Venus and produces an absorption spectrum with little similarity to the Venusian absorber[3]. We have measured the absorption spectrum of FeCl3 in sulphuric acid with small quantities of HCl added, and we found that it is much more similar in shape to the observed spectrum of the unknown absorber than prior FeCl3 spectra available in the literature.
The spectra measured in sulphuric acid contain contributions from both ferric chloride and ferric sulphate ions. We estimated the molar partitioning of the species in the mixtures by performing least squared fitting to reproduce each measured spectrum from spectra of pure ferric sulphate (measured for Fe2(SO4)3 in 75-87 wt% aqueous H2SO4) and pure ferric chloride (measured for FeCl3 in 5-37 wt% aqueous HCl). We estimated the rate of the reaction converting FeCl3 toward Fe2(SO4)3 using this method at several temperatures and extrapolate to Venusian temperatures to predict the lifetime of FeCl3 within the sulphuric acid cloud droplets.
To test if either FeCl3 or OSSO are viable candidates we employ three models: the global Planetary Climate Model for Venus (PCM-Venus) to model the photochemistry and 3D transport of the candidates in the atmosphere[4], a 1D sectional aerosol model to predict agglomeration and sedimentation as a transport mechanism of FeCl3 particles[5], and the 1D multiple scattering radiative transfer model SOCRATES[6].
We have added iron chemistry and updated sulphur chemistry into PCM-Venus in order to predict the abundance of gas-phase FeCl3 produced by the reaction of gas-phase HCl with iron produced by the ablation of cosmic dust particles around 115 km, and of OSSO produced from the recombination of two SO molecules. Mean gas and dynamical profiles from the PCM are used to initialise the agglomeration and sedimentation model, which is then run for many Venus years to reach steady state.
The potential contributions of each species to the observed absorption were assessed using SOCRATES to predict the observed absorption from instantaneous dayside PCM-modelled concentrations of OSSO, and to estimate the required concentrations of FeCl3 in the different cloud modes and the required increase of OSSO from the PCM results to fully explain the absorption measured by MESSENGER/MASCS during its June 2007 Venus flyby (Pérez-Hoyos et al., 2018).
Agglomeration and sedimentation modelling of FeCl3 suggests that the PCM-modelled FeCl3 column abundance above 60 km can account for more than 40% of the observed absorption. The full absorption can be explained by approximately 1 wt% FeCl3 in the mode 1 cloud droplets (Figure 2). Large ferric sulphate ion concentrations in the laboratory spectra used to model the absorption lead to higher than observed absorption near 300 nm. Work is ongoing to correct the iron partitioning between chloride and sulphate to expected Venusian ratios.
Results of SOCRATES modelling suggest that an OSSO concentration profile 103 x larger than the PCM-modelled profile would be required to reproduce the depth of the observed absorption (Figure 2). The SO2 and SO profiles at 60 - 80km in the PCM are currently ~100 x smaller than observed concentrations, and so increase of 103 from current concentrations is not unreasonable (as OSSO rate of formation will increase with the square of SO concentration). However, the agreement of the spectral shape with the observations is significantly worse than has been previously reported by Frandsen et al. (2016)[2]. The spectral shape is better approximated when the concentration of trans-OSSO is increased relative to the cis-OSSO, though we have found no chemical justification to make this adjustment.
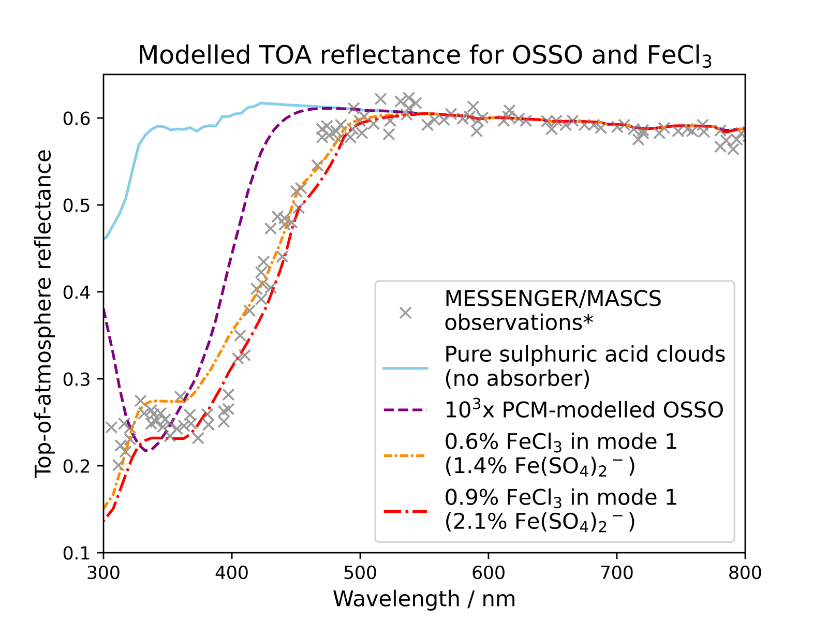
Figure 2: Preliminary data comparing the MESSENGER/MASCS spectrum of the unknown absorber (*[3], grey crosses) to SOCRATES-modelled concentrations that best reproduce the depth of the absorption for cis- and trans-OSSO (purple dashed line) and FeCl3 in mode 1 (modal radius = 0.2 µm) sulphuric acid cloud droplets (orange and red dash-dotted lines). The modelled spectrum with neither OSSO or FeCl3 included (blue solid line) is included for reference.
We conclude that both candidates show some merit as the unknown absorber and a mixture of both species is likely present on Venus and contributing to the absorption. Work is ongoing to decrease the ferric sulphate contribution in the laboratory-measured FeCl3 spectrum in line with expected Venusian concentrations (and thereby decrease the high absorption near 300 nm seen in current FeCl3 spectra shown in Figure 2), and to reproduce observed SO2 and SO concentrations with PCM-Venus, thereby likely increasing OSSO modelled concentrations.
References
[1] Zasova et al., 1981, https://doi.org/10.1016/0273-1177(81)90213-1
[2] Frandsen et al. 2016, https://doi.org/10.1002/2016GL070916
[3] Pérez-Hoyos et al. 2018, https://doi.org/10.1002/2017JE005406
[4] Martinez et al. (2024), doi.org/10.1016/j.icarus.2024.116035
[5] Frankland et al., 2017, https://doi.org/10.1016/j.icarus.2017.06.005
[6] Manners et al. (2022), SOCRATES Technical Guide, available at: https://code.metoffice.gov.uk/trac/socrates
How to cite: Egan, J., Feng, W., James, A., Manners, J., Marsh, D., and Plane, J.: Investigation of potential candidates for the Venusian unknown UV absorber: FeCl3 and OSSO , Europlanet Science Congress 2024, Berlin, Germany, 8–13 Sep 2024, EPSC2024-971, https://doi.org/10.5194/epsc2024-971, 2024.
It is well known that planetary atmospheres have a wide range of time-scale variations that have a significant impact on the surface environment of the planet. Taking the Earth as an example, long-term scale atmospheric variations such as ENSO and QBO are affecting the Earth's weather and climate. On the other hand, whether such long-term scale atmospheric variations exist in planetary atmospheres other than Earth has not been much studied in the past. A change in this situation has been brought by the recent realization of long-term observations of the Venusian atmosphere by Venus Express and Akatsuki: the presence of significant long-term variations in UV albedo and the zonal mean wind speed at cloud levels have been reported (Peralta et al., 2018; Lee et al., 2019; Khatuntsev et al., 2023; Horinouchi et al., 2024). In addition, the measurements using ground-based telescopes also have indicated the long-term variations in the mixing ratios of H2O and SO2 gases at the cloud top level (Encrenaz et al., 2023). In this study, we used the vertical profiles of temperature and H2SO4 gas mixing ratio obtained by the Venus Express and Akatsuki radio occultation measurements (e.g., Häusler et al., 2006; Imamura et al., 2017; Ando et al., 2020) and investigated their long-term variations in the low latitude region. As a preliminary result, we found that both temperature and H2SO4 gas mixing ratio around the cloud bottom level (46–50 km altitudes) in 2006–2014 obtained from the radio occultation measurements by Venus Express are generally higher than those in 2016–2022 from the Akatsuki data. In addition, the trend of the annual variation of H2SO4 gas mixing ratio almost follows that of its saturated mixing ratio which is mainly determined by the temperature. In the presentation, we will also discuss the long-term variations of temperature in a wider vertical range from the mesosphere down to the sub-cloud region (~40–85 km altitudes).
How to cite: Ando, H., Noguchi, K., Imamura, T., Sagawa, H., Oschlisniok, J., Tellmann, S., and Pätzold, M.: Long-term variations of temperature and H2SO4 gas mixing ratio in the Venusian atmosphere studied with Venus Express and Akatsuki radio occultation measurements, Europlanet Science Congress 2024, Berlin, Germany, 8–13 Sep 2024, EPSC2024-5, https://doi.org/10.5194/epsc2024-5, 2024.
Introduction
The horizontal distribution of sulfuric acid clouds in the Venusian atmosphere is an essential factor that influences the solar energy absorbed by the planet. The cloud layer reflects about 75% of the solar energy [1] and controls the amount of energy input to the planet. Understanding how sulfur dioxide, SO2, the precursor of sulfuric acid, is transported from the lower atmosphere to the cloud top, where the cloud particles are formed from SO2 photochemically, is one of the essential subjects for understanding the Venusian climate system. Japanese Venus orbiter Akatsuki [2] has been conducting new observations to understand the supply and consumption process of SO2. The ultraviolet imager onboard Akatsuki is equipped with two bandpass filters centered at 283 nm for observation of SO2 and 365 nm for the unidentified UV absorber, taking disk images every two hours at two wavelengths [3]. In recent analysises, the local time mean field of the temperature field obtained by mid-infrared observations of Akatsuki has confirmed that the wavenumber 2 component of thermal tides has a large amplitude at low latitudes, which can be one of the processes that explains the variation of SO2 at the cloud top altitude [4, 5]. In this study, we have developed a method to retrieve only the effect of absorption by SO2 from the 283 nm images by using additional images simultaneously taken through a 365 nm filter. We obtained the local time and latitudinal mean distribution of SO2 to analyze on the transport by thermal tides with large amplitude in the mean field.
Dataset
In this study, we used over 15,000 pairs of 283 and 365 nm UV images taken by the Japanese Venus orbiter Akatsuki. The main absorbers around 283 nm are both SO2 and the unidentified UV absorber, while the absorption of SO2 is negligible and that of the unidentified UV absorber is dominant at 365 nm. The UV images are Level 3b data, which are 2880 by 1440 maps of calibrated radiance in the longitude-latitude coordinates expanded from 1024 by 1024 Venus disk images taken by the Akatsuki UV imager. We binned down to 120 by 60 to reduce computational cost.
Retrieval of Sulfur Dioxide
We used radiative transfer calculations to calculate reflectance under various amounts of SO2 and the unidentified UV absorber to create a look-up table. The calculations were performed under the same geometrical conditions as those of the observation of each pixel on the UV images by using our originally developed calculation code based on the adding-doubling method suitable for the calculation of multiple scattering under a divided icosahedral grid for spherical numerical integration to increase suitability for comparison with observations from orbital positions. The effect of the unidentified UV absorber was considered as the imaginary part, ni, of the complex refractive index of the sulfuric acid solution cloud droplets. First, ni is obtained from the 365 nm image under certain initial conditions. The ni has wavelength dependence, so it is converted to a value at 283 nm using the function of wavelength of ni estimated from the Venus Express UV spectroscopy observations. Next, the 283 nm image and the ni value are used to determine the amount of SO2. The obtained amount of SO2 is used again to obtain the value of ni from the 365 nm image. By performing this loop calculation until convergence, the SO2 and ni values were simultaneously retrieved. We performed a sensitivity analysis to cloud altitude.
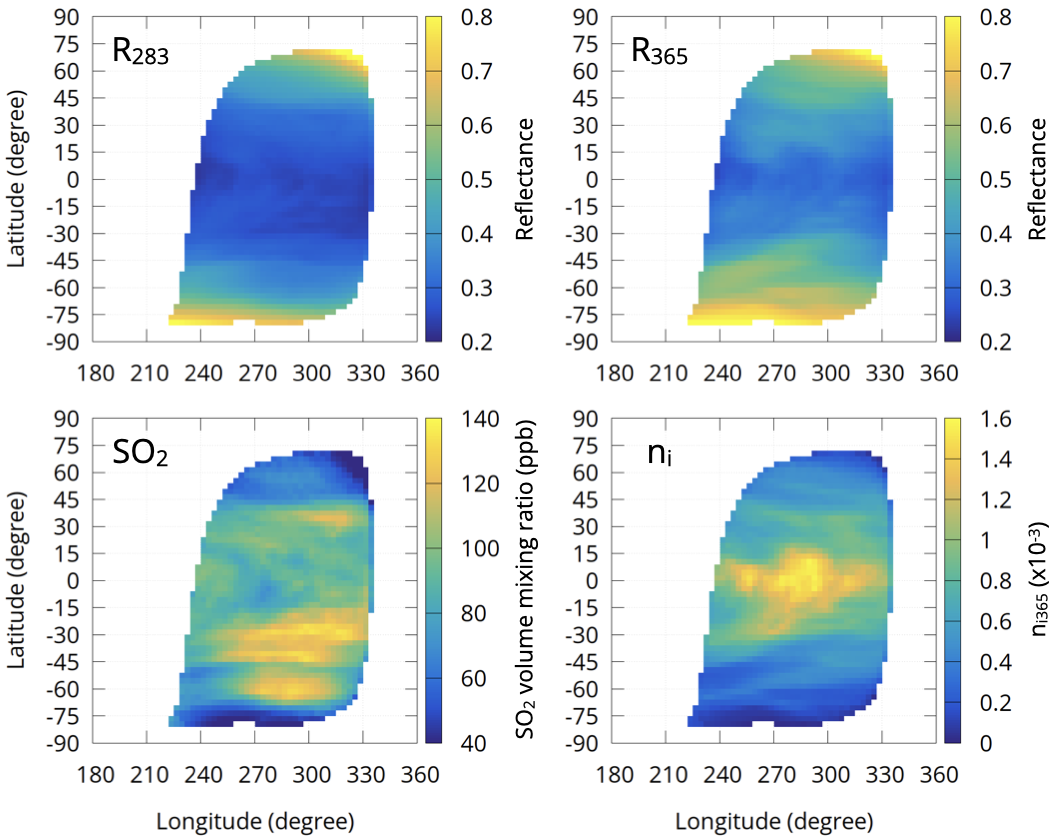
Figure 1: An Example of retrieval from two UV images. Top two figures are observed reflectance at 283 and 365 nm. Left bottom is retrived amount of SO2 and right bottom is ni.
Local Time Distribution of Sulfur Dioxide
Using all of the horizontal distributions of SO2 retrieved from 15,000 pairs of UV images, we obtained the mean distribution of SO2 in local time-latitude coordinates shown in Fig. 2.
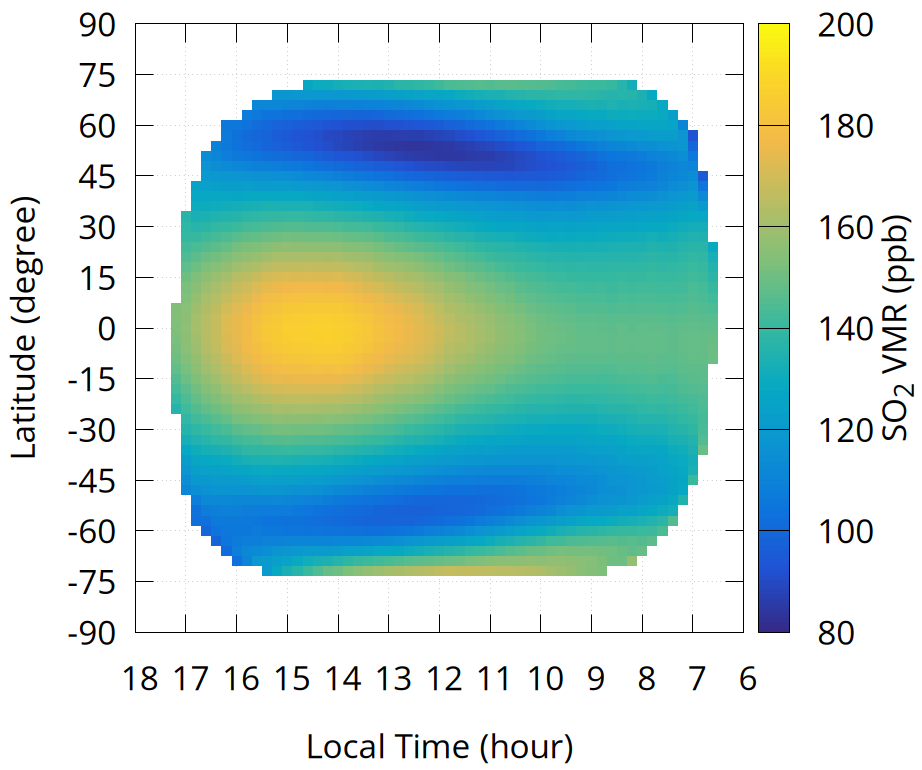
Figure 2: Mean distribution of SO2 on local time and latitude coordinates. The left side of the figure is the afternoon side, and the right is the morning. There is an single maximum around 14-15 in the afternoon.
The mean value of SO2 is 80 to 200 ppb, which is consistent with the previous study [6]. The distribution has a clear single peak, and the mixing ratio of SO2 monotonically increases from the morning to around 14:30 and decreases toward the terminator of the evening. In the latitudinal direction, it decreased from low to middle latitudes. The distributions can be explained by the vertical movement of air excited by thermal tides of wavenumber 2. Thermal tides have a structure that is warmer in the afternoon and cooler in the morning. When the background wind passes through this structure, the air is lifted most on the afternoon side. This causes SO2, which is abundant in the lower layers, to be lifted to the cloud-top region, resulting in a single maximum on the afternoon side. The distribution obtained by this study is qualitatively consistent with the result of a Venus GCM with photochemistry [7] and the wave structures reproduced by the Venus GCM by [8].
References
[1] Taylor, F., and D. Grinspoon (2009), Climate evolution of Venus, J. Geophys. Res., 114, E00B40, doi:10.1029/2008JE003316.
[2] Nakamura, M. et al. (2016), AKATSUKI returns to Venus, Earth Planets Space, 68, 75, doi:10.1186/s40623-016-0457-6.
[3] Yamazaki, A., et al. (2018), Ultraviolet imager on Venus orbiter Akatsuki and its initial results, Earth Planets Space, 70, 23, doi:10.1186/s40623-017-0772-6.
[4] Kouyama, T. et al. (2019), Global structure of thermal tides in the upper cloud layer of Venus revealed by LIR on board Akatsuki, Geophysical Research Letters, 46, 9457–9465, doi:10.1029/2019GL083820.
[5] Fukuya, K. et al. (2021), The nightside cloud-top circulation of the atmosphere of Venus, Nature, 595, 511–515, doi:10.1038/s41586-021-03636-7.
[6] Belyaev, D. et al. (2012), Vertical profiling of SO2 and SO above Venus’ clouds by SPICAV/SOIR solar occultations, Icarus, 217, 2, doi: 10.1016/j.icarus.2011.09.025.
[7] Stolzenbach, A. et al. (2023), Three-dimensional modeling of Venus photochemistry and clouds, Icarus, 395, 115447, doi:10.1016/j.icarus.2023.115447.
[8] Takagi, M. et al. (2018), Three-dimensional structures of thermal tides simulated by a Venus GCM, Journal of Geophysical Research: Planets, 123, 335–352, doi:10.1002/2017JE005449.
How to cite: Iwanaka, T., Imamura, T., Aoki, S., Marcq, E., and Sagawa, H.: Distribution and Variation of the Venusian Cloud-top Sulfur Dioxide Derived from Akatsuki UV Images, Europlanet Science Congress 2024, Berlin, Germany, 8–13 Sep 2024, EPSC2024-680, https://doi.org/10.5194/epsc2024-680, 2024.
EnVision has been selected in the M5 call of ESA’s Cosmic Vision program as the next European led mission to Venus. It is dedicated to unravel some of the numerous open questions about Venus' past, current state and future and will help to understand why Venus and Earth evolved so differently.
The Radio Science Experiment (RSE) consists of two different experiments: it will perform extensive studies of the gravitational field but also Radio Occultations to sense the Venus atmosphere and ionosphere at a high vertical resolution of only a few hundred metres. These radio occultations provide electron density profiles in the ionosphere and atmospheric density, temperature and pressure profiles in the upper troposphere and mesosphere (~40 – 90 km). Additionally, they allow to study the H2SO4 absorption in the Venus cloud layer.
The first radio occultation experiment at Venus was conducted during the Mariner 5 flyby in 1967, followed by Mariner 10, several Venera missions, Magellan, and the Pioneer Venus Orbiter, and Akatsuki. The most extensive radio occultation study of the Venus atmosphere so far was carried out by the VeRa experiment on Venus Express.
EnVision will use two coherent frequencies (X- and Ka-band) to separate dispersive and nondispersive effects. This allows to distinguish between ionospheric wave structures and other noise induced effects in the ionosphere.
The use of Ka-band, which has never been used to sense the Venus atmosphere before, allows to study the H2SO4 absorption in the Venus cloud layer due to its high sensitivity to sulfuric acid absorption. Ka-band is also sensitive to liquid H2SO4 which provides the opportunity (in combination with X-band) to distinguish between gaseous and liquid H2SO4 absorption features on Venus for the very first time.
The short orbital period of EnVision in combination with its very small orbital inclination allows to cover all latitudes, longitudes, local times and solar zenith angles on Venus. Especially short-term variations caused by atmospheric waves can be identified to study traveling or stationary small scale atmospheric structures.
How to cite: Tellmann, S., Oschlisniok, J., Pätzold, M., Dumoulin, C., and Rosenblatt, P.: Radio Sounding of the Venusian Atmosphere with the RSE Experiment on EnVision, Europlanet Science Congress 2024, Berlin, Germany, 8–13 Sep 2024, EPSC2024-796, https://doi.org/10.5194/epsc2024-796, 2024.
Context
UV investigations of Venus have revealed interesting features regarding the chemical composition and the complex dynamical processes taking place in the atmosphere. The abundance and variability of sulphured gases like SO2 and SO, as well as the unidentified “UV absorber” have been monitored, and patterns linked to the dynamical activity such as convection cells and atmospheric waves have been observed at both planetary and smaller spatial scales.
These topics are the main science interests of the UV spectrometer VenSpec-U [1], onboard the future ESA mission EnVision. This instrument will focus especially on the upper atmosphere and will perform measurements of the backscattered sunlight on the dayside of Venus, and provide radiance factor spectra derived from the measured radiance of Venus and the knowledge of the solar spectral irradiance. Each of the two channel composing the instrument will be dedicated to particular science goals: the “Low Resolution” (LR) channel will operate in the 190-380 nm range to monitor the abundances and variability of SO2, UV absorber and dynamical processes at small spatial scale ; while the “High Resolution” (HR) channel will be dedicated to the separate identification of SO and SO2, by observing in the 205-235 nm range with a 0.3 spectral resolution around the common absorption band of these two species. Observations will be performed with a pushboom strategy, and spatial samplings ranging from 3 to 24 km.
Objective and method
The imaging capabilities of the instrument at small spatial scale are then evaluated in order to estimate the observability of the spatial variability of the key parameters aiming to be measured: the SO2 mixing ratio at 70 km of altitude, the imaginary part of the refractive index used to consider the UV absorber’s influence, and the cloud-top altitude. To do so, the following steps are implemented:
The first step consists in producing maps of parameters to simulate scenes that could be observed by the instrument. These maps are derived from a mesoscale model of Venus’ atmosphere [2], allowing to compute abundance’s vertical profile and spatial variability for the main atmospheric chemical compounds and different latitudes and local times. An observation at the Equator and 12h local time is here considered. For each point of the maps, a radiance factor spectrum is generated with a radiative transfer model [3], with consideration of the observation geometry. The second step simulates the instrumental effects and the induced degradations of maps and spectra, including optical processes as well as other perturbations occurring at the detector level and during on-board data treatment. The maps are also spatially binned to match the smallest targeted spatial sampling for VenSpec-U. Finally, the degraded synthetic radiance factor spectra are processed with the inverse RTM to retrieve the associated atmospheric parameters, from which the maps can be recomposed and compared to the unperturbed simulations (Figure 1).
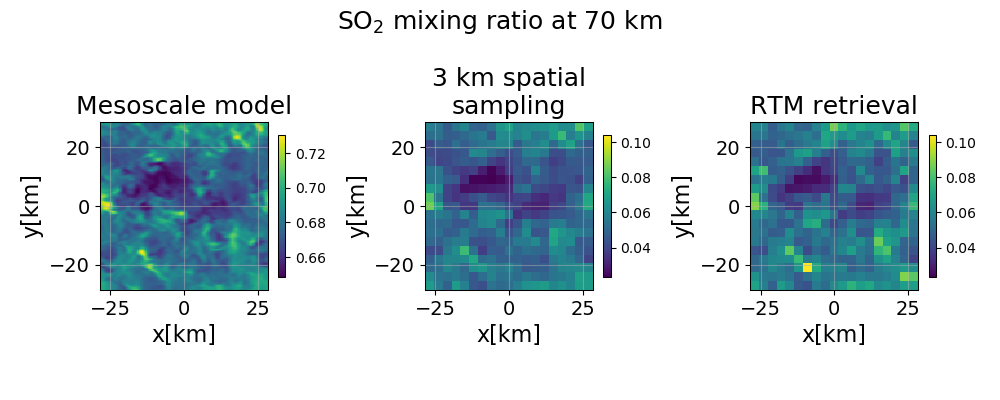
Figure 1: maps of the SO2 mixing ratio (RTM parameter): - simulated with the mesoscale model (left) - original map averaged to reach a 3 km spatial sampling, with rescaled values to be consistent with observed ranges (centre) - retrieved by the inverse RTM (right)
Further developments
This study is coupled to the development of an instrumental model intending to simulate the various processes involved in the production of the images provided by VenSpec-U. This model aims to be implemented and adjusted over time in order to be representative of the instrument, so that it can be used to perform or refine performance assessments.
References
[1] Emmanuel Marcq, Franck Montmessin, Jérémie Lasue, Bruno Bézard, Kandis L. Jessup, et al. Instrumental requirements for the study of Venus’ cloud top using the UV imaging spectrometer VeSUV. Advances in Space Research, 2021, 68 (1), pp.275-291. 10.1016/j.asr.2021.03.012. insu-03179739
[2] Maxence Lefèvre, Aymeric Spiga, Sébastien Lebonnois. Mesoscale modeling of Venus’ bow-shape waves. Icarus, 2020, 335, pp.113376. 10.1016/j.icarus.2019.07.010. hal-02323587
[3] Emmanuel Marcq, Kandis Lea Jessup, Lucio Baggio, Therese Encrenaz, Yeon Joo Lee, et al. Climatology of SO2 and UV absorber at Venus’ cloud top from SPICAV-UV nadir dataset. Icarus, 2020, 335, pp.113368. 10.1016/j.icarus.2019.07.002. insu-02196097
How to cite: Conan, L., Marcq, E., Lustrement, B., Lefèvre, M., Rouanet, N., Bertran, S., Vandaele, A. C., Helbert, J., and Alemanno, G.: Observability of atmospheric spatial variability by the VeSUV/VenSpec-U instrument onboard ESA’s EnVision mission, Europlanet Science Congress 2024, Berlin, Germany, 8–13 Sep 2024, EPSC2024-465, https://doi.org/10.5194/epsc2024-465, 2024.
Venus has long been considered the twin sister of Earth due to their physical similarities, such as mass, radius, and distance from the Sun [1]. This resemblance makes the comparative study between Venus and Earth important to understand an evolution turning point that caused these twin planets to be very different at present [2]. Interestingly, not only Earth experiencing global warming, but also Venus is experiencing ongoing temporal changes. Long-term remote sensing observations of Venus show considerable temporal variations of Venus. Such observations were conducted using spectral intensity, polarization, and imaging measurements. They revealed variations of the SO2 gas abundance, zonal wind speeds, ultraviolet (UV) brightness, cloud top altitude, and the upper haze vertical structures above the cloud top level (~70 km altitude) [3,4,5,6,7]. The main drivers of the reported variations are unclear but may be associated with surface volcanic activities, the solar cycle, or large-scale oscillations in atmospheric dynamics. To understand possible mechanisms, a long monitoring period is necessary, and reliable data calibration is mandatory. We propose a continuous monitoring project, CLOVE (Chasing the Long-term Variability of Our Nearest Neighbor Planet Venus), utilizing a combination of ground- and space-based facilities to overcome the limitations of using a single dataset. In this project, firstly, we plan a low-Earth orbit CubeSat that will monitor Venus to investigate the cloud top vertical structure, the unknown absorber(s), and the SO2 gaseous abundance, using bandpass and polarization filters at four selected wavelengths and a total 8 channels including polarization filters. We aim for our first CLOVE CubeSat to be launched in 2026. With its successful operation, we aim to proceed with the subsequent CubeSats that will continue Venus monitoring, replacing the old Sat with a new one to cover at least 15 years of time to complete one Solar Cycle. Secondly, we plan to collaborate with ground-based observation teams to perform coordinated Venus dayside observations with space-based CLOVE observations. The data will be used for cross-check validation and supplementary data to interpret our analysis. In this talk, I will explain what we have seen in the past and current data sets of Venus and the future plan with the CLOVE mission with an emphasis on polarization measurements.
References
[1] Svedhem. H, et al., 2007: Venus as a more Earth-like planet. Nature 450, 7170, 629-632
[2] O’Rourke, J.G., Wilson, C.F., Borrelli, M.E. et al., 2023: Venus, the Planet: Introduction to the Evolution of Earth’s Sister Planet. Space Sci Rev 219, 10
[3] Marcq, E. et al., 2020: Climatology of SO2 and UV absorber at Venus' cloud top from SPICAV-UV nadir dataset. Icarus 335, 113368
[4] Khatuntsev, I.V. et al., 2022: Twelve-Year Cycle in the Cloud Top Winds Derived from VMC/Venus Express and UVI/Akatsuki Imaging. Atmosphere 2022, 13
[5] Lee, Y. J. et al., 2019: Long-term Variations of Venus’s 365nm Albedo Observed by Venus Express, Akatsuki, MESSENGER, and the Hubble Space Telescope. Astronomical Journal 158:126
[6] Coffeen, D. L. and Hansen, J. E. 1974: Polarization Studies of Planetary Atmospheres, in Planets, Stars, and Nebulae: Studied with Photopolarimetry (Edited by T. Gehrels). University of Arizona Press, p.518
[7] Kawabata, K., et al., 1980: Cloud and Haze Properties from Pioneer Venus Polarimetry. Journal of Geophysical Research 85, 8129
How to cite: Lee, Y. J. and the CLOVE team: Long-term Monitoring Plan of Venus using Earth-orbiting CubeSats, Europlanet Science Congress 2024, Berlin, Germany, 8–13 Sep 2024, EPSC2024-158, https://doi.org/10.5194/epsc2024-158, 2024.
Recently, the Japanese meteorological satellites Himawari-8 and -9 began to be utilized as a space telescope for planetary science and astronomy. Since its operation started in 2015, Himawari-8 has been taking full-disk images of the Earth at the geostationary orbit every 10 minutes [e.g., 1]. Although Himawari-8 aims to observe the weather in the Asia-Pacific region frequently, its scanning pattern extends to space adjacent to the Earth, where solar-system bodies and stars are captured occasionally. For example, stars at absolute declination below 8.8 degrees can be captured, enabling an observation of the great dimming of the red supergiant star Betelgeuse [2]. In addition, Himawari-8 has taken the Moon more than a thousand times. Because the Himawari-8 can spatially resolve the lunar surface and has 9 bands at the infrared wavelengths, lunar surface geology such as roughness and rock abundance can be inferred from the Himawari-8 infrared images [3]. In principle, these spaceborne observations can extend to other solar system bodies, namely Mercury, Venus, Mars, and Jupiter. In particular, the Venus observation with the Himawari-8/9 infrared cameras could provide valuable data to trace the temporal variation of the cloud-top temperature. At the infrared wavelengths covered by the Himawari-8 and -9, the spaceborne observation of Venus is limited only to the Venera-15 and BepiColombo missions [e.g., 4, 5]. Nevertheless, the Himawari-8 and -9 data have not been utilized to observe these solar-system bodies until the present.
In this study, we archived all the Venus images captured by Himawari-8 and -9. To extract all the Venus images, we used the Himawari Standard Data (HSD) published by the Japanese Meteorological Agency from July 2015 until April 2024. Because pixels near the Earth’s rim are affected by the terrestrial atmosphere, the Venus images that are at least 8.85 degrees away from the Earth’s center are analyzed. We employed the aperture photometry technique to calculate the disk-normalized radiance after subtracting the background radiance. The analysis methods are described in detail by [2, 3].
Figure 1 displays an example of the Venus data obtained from HSD. Depending on the distance to the Earth, Venus has been captured with an apparent radius ranging from 5” to 33’’. As previously observed by the Venera-15 and BepiColombo missions, spectral depressions at 8 and 13 microns exist possibly due to the absorption of CO2. In total, 155 spectra have been obtained with similar spectral shapes. The observation can be conducted whenever the Earth hides the Sun, covering a phase angle from 5 to 168 degrees. In Figure 2, the obtained brightness temperatures are shown as a function of time. The brightness temperature at band 12 decreases over time until 2019 and then remains at a similar level. The temporal variation of brightness temperature shows a similar trend among different bands. The correlation coefficients between different bands are always larger than 0.5. Because the imagers onboard Himawari-8 and -9 are calibrated every 10 minutes, this trend cannot be attributed to the instrument degradation but is potentially affected by atmospheric dynamics such as thermal tides. In this presentation, we will discuss the components of the temporal variation in comparison with other Venus datasets.
[1] Okuyama, A. et al., 2018, Validation of himawari-8/ahi radiometric calibration based on two years of in-orbit data. Journal of the Meteorological Society of Japan 96B, 91.
[2] Taniguchi, D. et al., 2022, The Great Dimming of Betelgeuse seen by the Himawari-8 meteorological satellite. Nat Astron 6, 930–935.
[3] Nishiyama, G. et al., 2022, Utilization of a meteorological satellite as a space telescope: the lunar mid-infrared spectrum as seen by Himawari-8. Earth Planets Space 74, 105.
[4] Oertel, D. et al., 1985, Infrared spectrometry of Venus from “Venera-15” and “Venera-16”. Adv. Space Res. 5, 25–36.
[5] Helbert, J. et al., 2023, The second Venus flyby of BepiColombo mission reveals stable atmosphere over decades. Nat Commun 14, 8225.
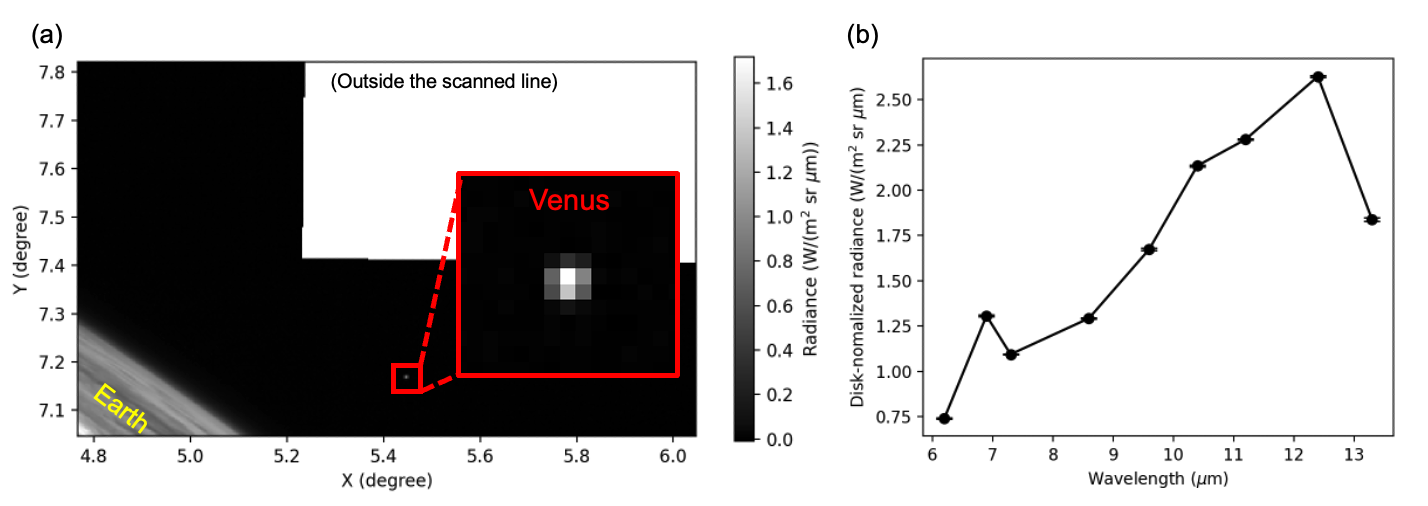
Figure 1. An example of the Venus data. (a) An image of Venus captured by Himawari-9 on 20 October 2023. The black and white area outside the Earth is space and the outer area of scanning lines. The x- and y-axes correspond to the angular distances from the Earth’s center along the east-west and north-south directions, respectively. (b) The mid-infrared spectrum of Venus obtained from Figure 1-(a). The spectral depression at 8 and 13 microns corresponds to the CO2 absorption.
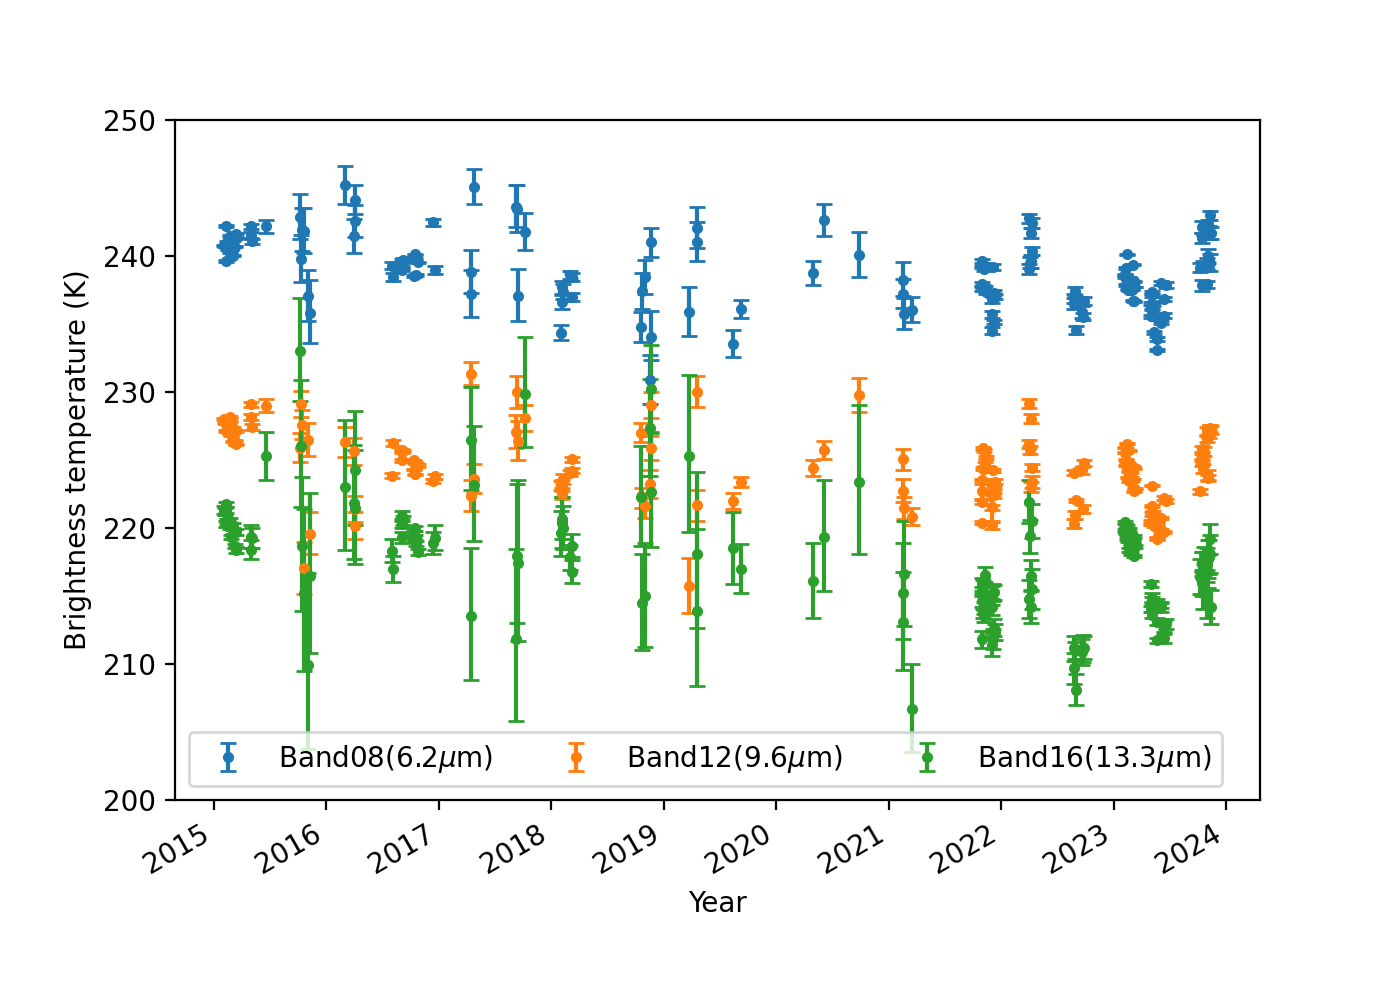
Figure 2. The temporal variation of the brightness temperatures of Venus at bands 8, 12, and 16.
How to cite: Nishiyama, G., Suzuki, Y., Uno, S., Aoki, S., Iwanaka, T., Imamura, T., Fujii, Y., and Müller, T.: Temporal variation of Venus brightness temperature seen by the Japanese meteorological satellite Himawari-8/9, Europlanet Science Congress 2024, Berlin, Germany, 8–13 Sep 2024, EPSC2024-585, https://doi.org/10.5194/epsc2024-585, 2024.
Optically thick cloud decks shroud the deep atmosphere of Venus from the view of most observing instruments. Limited nightside spectral windows, however, have allowed detection of trace gas species like carbon monoxide (CO) and sulphur dioxide (SO2). The distribution of these species offers clues to the general circulation below the clouds. CO is formed above the clouds by photolysis of CO2 and reaches the deep atmosphere through downwelling at high latitudes associated with a cloud deck Hadley-like cell. SO2, on the other hand, is believed to originate from the surface, potentially from volcanic processes, and varies in abundance above the cloud deck on both short-term and long-term timescales due to a combination of photochemical and dynamical processes.
Using the Venus Planetary Climate Model (VPCM), a 3-D global climate model of Venus, we performed two age of air simulations to study how the surface, deep atmosphere, cloud decks, and upper atmosphere are connected by dynamical transport processes. In the experiments, a source region was initialised with a passive tracer whose abundance increased linearly with simulation time. The VPCM’s tracer routines transported the tracer from the source region around the model atmosphere. We then used the tracer abundance in each model gridbox to calculate the time since the air in that gridbox was last in the source region, a quantity known as the “mean age of air.” In one experiment (Surface), the tracer source region was the planetary surface, and in the second (Cloud Deck), the source region was the model level just beneath the lowest cloud deck.
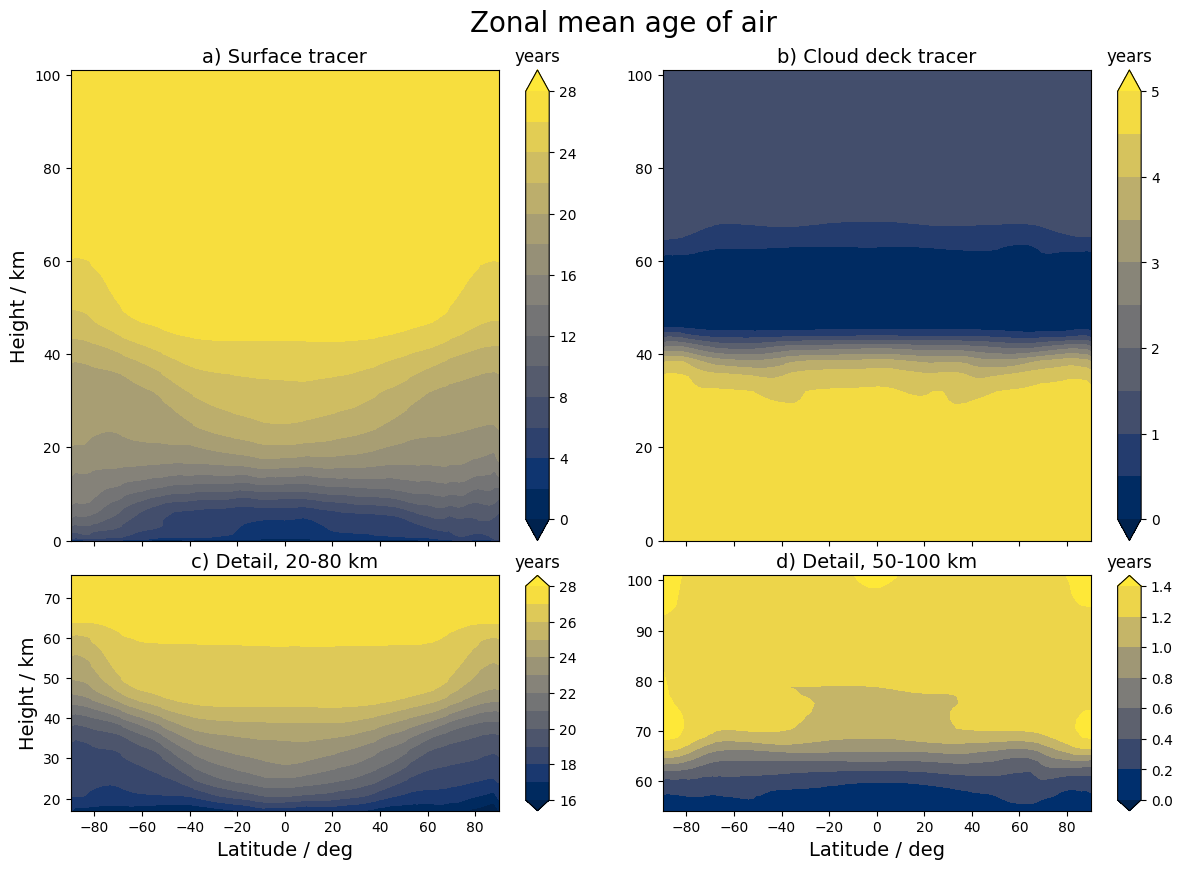
Figure 1: Zonal mean age of air for the Surface and Cloud Deck tracer experiments.
In the Surface experiment, air took around 25 Earth years to reach the region below the cloud decks, while in the Cloud Deck experiment, it took 1.5 Earth years to reach the upper atmosphere above the clouds. To put these timescales in context, we define the troposphere-to-stratosphere turnover ratio, a ratio of the transport time through the troposphere to the transport time through the stratosphere, for Venus in comparison to Earth and Mars:
|
Planet |
Venus |
Earth |
Mars |
|
Turnover ratio (equator) |
0.06 |
14.5 |
1 |
|
Turnover ratio (poles) |
0.075 |
21.9 |
0.5 (seasonal) |
|
Source |
Our work |
Krol et al. (2018) [1] |
Waugh et al. (2019) [2] |
While on Earth, air moves through the troposphere much more quickly than through the stratosphere, this is reversed for Venus, where the upper atmosphere sees much faster turnover. However, we also found a latitudinal gradient in the age of air which varies with altitude, with significantly younger air in polar regions at altitudes from 25-60 km, and older air at the poles both below and above this altitude range.
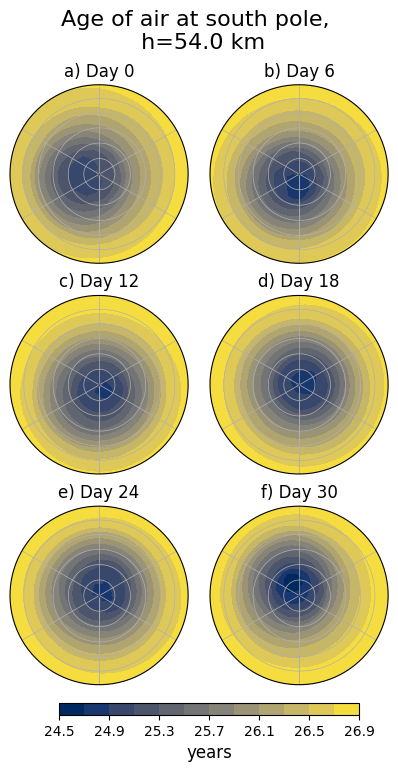
Figure 2: Six snapshots of the age of air in the Surface simulation at the south pole. The outermost circle is 60° and each radial gridline represents 5°.
To explain this latitudinal gradient, we investigated the circulation between 25-60 km and found that this region of the deep atmosphere generates planetary-scale Rossby waves with a zonal wave number of one. These waves are characterised by a pair of high-latitude cyclonic/anticyclonic structures or gyres in each hemisphere which collect the age of air tracers, leading to a younger age of air near the poles. The waves propagate around the planet with a period of 36 Earth days, as can be seen from the change in longitudinal location of the age of air minimum in Figure 2.
Figure 3 shows the general circulation at two altitudes within the wave region. Fig. 3a) contains large gyres in the top and bottom left of the panel with an area of upwelling at their western edges. The gyres are less evident in Fig. 3c) because they have become confined to very high latitudes as the superrotating equatorial jet comes to dominate most of the planet. However, time series analysis of the vertical wind at the gyre latitudes found that the waves continue to exist at these altitudes and remain in phase throughout the 25-60 km altitude range.
Traveling high-latitude Rossby waves could be a source of the observed variability in the trace gas distributions below the cloud deck and contribute to the complex, as yet poorly understood dynamics of the Venusian polar regions. The predicted existence of these waves could be tested by long-term or appropriately timed observations of the trace gas species near one or both poles to determine if there is a regular periodic variation in abundance.
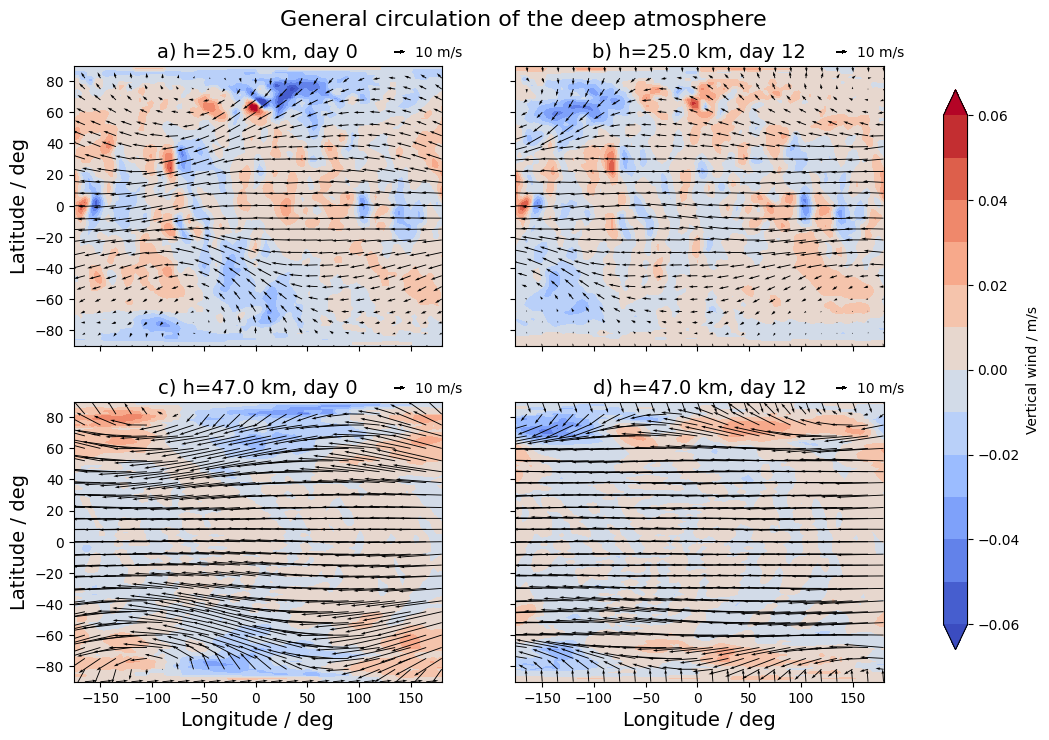
Figure 3: Horizonal and vertical wind in the deep atmosphere at 25 km and 47 km altitude, 12 days apart.
References:
[1] Krol, M., de Bruine, M., Killaars, L., Ouwersloot, H., Pozzer, A., Yin, Y., Chevallier, F., Bousquet, P., Patra, P., Belikov, D., Maksyutov, S., Dhomse, S., Feng, W., and Chipperfield, M. P.: Age of air as a diagnostic for transport timescales in global models, Geosci. Model Dev., 11, 3109–3130, https://doi.org/10.5194/gmd-11-3109-2018, 2018.
[2] Waugh, D.W., Toigi, A.D., Guzewich, S.D.: Age of martian air: timescales for martian atmospheric transport, Icarus, 317, 148-157, https://doi.org/10.1016/j.icarus.2018.08.002
How to cite: Cohen, M., Holmes, J., Patel, M., and Lewis, S.: Planetary-scale waves in the Venus deep atmosphere cause variability in tracer distribution, Europlanet Science Congress 2024, Berlin, Germany, 8–13 Sep 2024, EPSC2024-165, https://doi.org/10.5194/epsc2024-165, 2024.
Until the ESA Venus Express mission, the Venus mesosphere was a poorly understood region of the Venus’s atmosphere. This mission, which operated between 2006 and 2014, revealed the composition and thermal structure of the mesosphere and lower thermosphere (Titov et al., 2006, Vandaele et al., 2017, Limaye et al., 2018, Marcq et al., 2018) with the help of its suite of instruments: VIRTIS (Drossart et al., 2007), SPICAV-IR and SPICAV-UV (Bertaux et al., 2007), SOIR (Nevejans et al., 2006). The spacecraft counted a suite of eight instruments, amongst which the SOIR (Solar Occultation in the InfraRed) instrument, which was an echelle grating infrared spectrometer operating exclusively in Solar Occultation mode.
This study focuses on the H2O, HDO, and temperature vertical profiles. The HDO/H2O ratio in its bulk atmosphere is 120 times Earth’s (Donahue et al., 1982, de Bergh et al., 1991, Gurwell et al., 2007, Krasnopolsky et al., 2013, Encrenaz et al., 2015, Tsang et al., 2017). We report a significant increase in the H2O and HDO volume mixing ratios with altitude, with the D/H ratio rising significantly from 0.025 at ~70 km to 0.24 at ~108 km. This indicates an increase from 162 to 1519 the Earth’s ratio within 40 km.
Our work explores two hypotheses to explain these observations: isotopic fractionation from photolysis of H2O over HDO (Liang et al., 2009) or from phase change processes. We show that the first one cannot explain the observations. The latter, involving condensation and evaporation of sulfuric acid aerosols, as suggested by previous authors (Zhang et al., 2010, Karyu et al., 2024), aligns more closely with the rapid changes observed. Vertical transport computations for H2O, HDO, and aerosols show water vapor downwelling and aerosols upwelling.
We propose a mechanism where aerosols form in the lower mesosphere due to temperatures below the water condensation threshold, leading to deuterium-enriched aerosols. These aerosols ascend, evaporate at higher temperatures, and release more HDO than H2O, which are then transported downwards. Moreover, this cycle would imply an SO2 increase in the upper mesosphere, previously observed above 80 km by several authors (Belyaev et al., 2012, Mahieux et al., 2015).
The study highlights two crucial implications. First, altitude variation is critical to determining the Venus deuterium and hydrogen reservoirs. Second, the altitude-dependent increase of the D/H ratio affects H and D escape rates. The photolysis of H2O and HDO at higher altitudes releases more D, influencing long-term D/H evolution.
These findings suggest that evolutionary models should incorporate altitude-dependent processes for accurate D/H fractionation predictions.
References:
Belyaev, D., et al. (2012), Icarus, 217.
Bertaux, J. L., et al. (2007), Planet. Space Sci., 55.
de Bergh, C., et al. (1991), Science, 251.
Donahue, T. M., et al. (1982), Science., 216.
Drossart, P., et al. (2007), Planet. Space Sci., 55.
Encrenaz, T., et al. (2015), Planet. Space Sci., 113-114.
Gurwell, M. A., et al. (2007), Icarus, 188.
Karyu, H., et al. (2024), The Planetary Science Journal, 5.
Krasnopolsky, V. A., et al. (2013), Icarus, 224.
Liang, M. C., et al. (2009), J. Geophys. Res., 114.
Limaye, S. S., et al. (2018), Space Science Reviews, 214.
Mahieux, A., et al. (2015), Planet. Space Sci., 113-114.
Marcq, E., et al. (2018), Space Science Reviews, 214.
Nevejans, D., et al. (2006), Applied Optics, 45.
Titov, D. V., et al. (2006), Planet. Space Sci., 54.
Tsang, C., et al., 2017, Vol. 49, pp. 502.04.
Vandaele, A. C., et al. (2017), Icarus, 295.
Zhang, X., et al. (2010), Nature Geoscience, 3.
How to cite: Mahieux, A., Viscardy, S., Yelle, R., Karyu, H., Chamberlain, S., Robert, S., Piccialli, A., Trompet, L., Ubukata, S., Nakagawa, H., Koyama, S., Cessateur, G., and Vandaele, A. C.: Unexpected increase in water abundance and the deuterium-to-hydrogen ratio observed in Venus’s mesosphere, Europlanet Science Congress 2024, Berlin, Germany, 8–13 Sep 2024, EPSC2024-182, https://doi.org/10.5194/epsc2024-182, 2024.
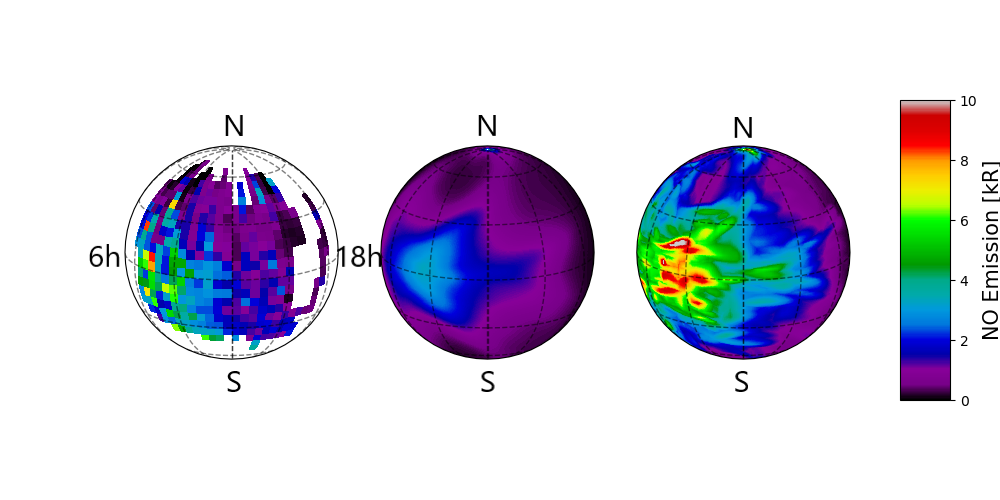
- P. D. Feldman, H. W. Moos, J. T. Clarke, A. L. Lane, Nature. 279, 221–222 (1979).
- A. I. F. Stewart, J.-C. Gérard, D. W. Rusch, S. W. Bougher, J. Geophys. Res. 85, 7861 (1980).
- J.-C. Gérard et al., J. Geophys. Res., in press, doi:10.1029/2008JE003078.
- A. Stiepen, L. Soret, J.-C. Gérard, C. Cox, J.-L. Bertaux, Icarus. 220, 981–989 (2012).
- D. Crisp et al., Journal of Geophysical Research: Planets. 101, 4577–4593 (1996).
- A. S. Brecht et al., J. Geophys. Res. 116, E08004 (2011).
- A. Stiepen, J.-C. Gérard, M. Dumont, C. Cox, J.-L. Bertaux, Icarus. 226, 428–436 (2013).
- E. Royer, F. Montmessin, J.-L. Bertaux, Planetary and Space Science. 58, 1314–1326 (2010).
- S. Lebonnois, N. Sugimoto, G. Gilli, Icarus. 278, 38–51 (2016).
- G. Gilli et al., Icarus. 281, 55–72 (2017).
- A. Stolzenbach, F. Lefèvre, S. Lebonnois, A. Määttänen, Icarus. 395, 115447 (2023).
- U. Von Zahn et al., J. Geophys. Res. 85, 7829–7840 (1980).
How to cite: Streel, N., Lefèvre, F., Martinez, A., Stolzenbach, A., and Määttänen, A.: Strong variability of the NO nightglow modelled on Venus, Europlanet Science Congress 2024, Berlin, Germany, 8–13 Sep 2024, EPSC2024-387, https://doi.org/10.5194/epsc2024-387, 2024.
Venus is surrounded by sulfuric acid clouds essential to the planet's climate system. The upper part of the cloud is thought to be of photochemical origin, while the lower part is highly variable and will be more affected by atmospheric dynamics causing condensation and evaporation of sulfuric acid. The specific dynamical processes responsible for the variability are poorly understood.
Observations at near-infrared window wavelengths have revealed large opacity variations, which mostly occur in the lower part of the cloud layer. A significant feature is the planetary-scale dark cloud propagating with a period of 4.9-5.5 days, discovered through ground-based observations (Crisp et al. 1991). The IR2 camera aboard the Venus orbiter Akatsuki observed this phenomenon in more detail and found that the planetary-scale cloud discontinuity (disruption) that spans in the north-south direction characterizes the propagating structure (Satoh et al. 2017; Peralta et al. 2020). The relatively large amplitude near the equator and the zonal propagation faster than the background atmosphere indicate that the cloud opacity variation is mainly induced by a Kelvin wave. McGouldrick et al. (2021) analyzed this feature using spectroscopic data taken by Venus Express VIRTIS. They suggested that the cloud particle microphysical properties and trace gas densities change across the discontinuity, and the changes occur in the lower cloud region. Peralta et al. (2020) and McGouldrick et al. (2021) argued that a front associated with a nonlinear Kelvin wave could be responsible for the discontinuity.
Some Venus GCMs reproduced 5-6 day periodicities in the vertical wind or the thickness of the lower cloud driven by Kelvin waves with a zonal wavenumber of unity (Peralta et al. 2020; Ando et al. 2021). However, the observed sharp discontinuity was not reproduced in the models. The present study proposes mechanisms for the cloud discontinuity from the viewpoint of front generation through hydraulic jump (bore) and associated cloud formation. A simplified dynamical model, in which a Kelvin wave is artificially forced, and a microphysical model are used to reproduce the phenomenon. This study aims to understand the role of the Kelvin wave in the formation of the lower cloud and the conditions necessary for the appearance of the observed sharp discontinuity.
How to cite: Imamura, T., Maejima, Y., Sugiyama, K., Peralta, J., McGouldrick, K., Horinouchi, T., and Satoh, T.: Wave-driven cloud formation on Venus, Europlanet Science Congress 2024, Berlin, Germany, 8–13 Sep 2024, EPSC2024-708, https://doi.org/10.5194/epsc2024-708, 2024.
Venus’ atmosphere remains a dynamic and enigmatic engine which not only completely covers the surface of the planet but is believed to have had a dramatic impact on how the planet evolved. The current mechanisms that drive its behaviour and its interactions with both external forces and the surface of the planet have continuously been pieced together for decades, from remote observations to climate modelling, in an attempt to coalesce into a uniform picture of atmospheric circulation.
Atmospheric gravity waves on Venus have garnered increasing attention in the past decade, sparked by the first observation of a planetary scale bow-shape by the Japanese space mission Akatsuki in December 2015. The still ongoing mission has thus far provided a continuous cover of the planet’s cloud layer, including further detection and characterization of stationary waves on the top of the clouds with the Ultraviolet Imager (UVI) which is sensitive to ultraviolet reflected solar radiation, and at slightly lower levels thanks to the capabilities of the Longwave Infrared Camera (LIR) which uses thermal imaging in the mid-infrared.
For the past decade, most efforts to study gravity waves on Venus have been directed towards understanding both their forcing mechanisms and their influence on atmospheric circulation. Because these waves are driven by such a fundamental force as gravity and also since they can transport energy and momentum across several atmospheric layers, finding these structures on the atmospheres of other planets becomes another tool in understanding their behaviour and contribution to their planets’ energy budget in the atmosphere. Gravity waves can be generated through multiple means, the most common being flow over mountains and convection, which can produce different characteristics on the generated waves. Gravity waves with orographic origins have been widely studied on Earth and a similar mechanism has been proposed for Venus, supported by the presence of the aforementioned stationary waves, which are fixed relative to topography and are commonly associated with prominent mountains on Venus. However, these waves are detected near 60-70 km above the surface and require a positive statically stable environment to be able to propagate, a condition which seems to not always be verified between the surface and the cloud layer. Modelling efforts have been able to reproduce the largest of these structures and how they may propagate from the surface to the top of the clouds where we observe them, but such efforts for smaller-scale features are still ongoing. Since gravity waves feature a wide range of scales and characteristics, other generating sources like convection or shear instability have been proposed. Knowledge of the origin of these waves would also aid in the understanding of their role in the larger picture of Venus’ atmosphere dynamics and quantify their influence at various scales.
Ongoing work for the detection of these waves has already provided some headway with a broadening coverage of past and emerging data sets at 0.283, 3.8, 5 and 10 μm wavelengths [Fukuhara et al. 2017; Fukuya et al. 2022; Kitahara et al. 2019; Kouyama et al. 2017; Peralta et al. 2017], focusing on waves propagating at seemingly different altitudes. The higher spatial resolution of images gathered from several spacecraft allows the identification and characterization of progressively smaller and more varied wave shapes. Such data sets include instruments from Venus Express, namely the Visible and Infrared Thermal Imaging Spectrometer (VIRTIS) and from Akatsuki including UVI and the 2 μm Camera (IR2), targeting the upper clouds on the dayside with ~ 20 km/pixel resolution, covering the low latitudes with Akatsuki and high southern latitudes with VEx.
By using these data sets, we hope to expand the current base sample of stationary features detected on Venus and also combine observations at several wavelengths to infer on possible three-dimensional properties of these features and their influence on the atmospheric flow. Additionally, with a larger coverage from several instruments, we will broaden the possible distribution of stationary features to a wider latitudinal coverage and time period, which enables a comparison of the behaviour of these mesoscale structures at different latitudes and possible influence of both the underlying topography and local wind flow regime on the morphology and dynamics of these waves.
References
Fukuhara et al. 2017, Nat. Geoscience; DOI: 10.1038/NGEO2873
Fukuya et al. 2022, Icarus; DOI: 10.1016/j.icarus.2022.114936
Kitahara et al. 2019, JGR Planets; DOI: 10.1029/2018JE005842
Kouyama et al. 2017, Geophys. Res. Lett.; DOI: 10.1002/2017GL075792
Peralta et al. 2019, Nat. Astronomy; DOI: 10.1038/s41550-017-0187
How to cite: Silva, J., Peralta, J., Imamura, T., Hueso, R., Cardesin-Moinelo, A., Lefevre, M., Lee, Y. J., and Espadinha, D.: Mesoscale stationary waves on Venus’ dayside clouds, Europlanet Science Congress 2024, Berlin, Germany, 8–13 Sep 2024, EPSC2024-306, https://doi.org/10.5194/epsc2024-306, 2024.
Introduction
We present zonal thermal winds derived by applying the cyclostrophic balance from the Visible and Infrared Thermal Imaging Spectrometer (VIRTIS) temperature retrievals. VIRTIS was one of the experiments on board the European mission Venus Express [1]. It consisted of two channels: VIRTIS-M and VIRTIS-H. For this study, we analyze the complete VIRTIS-M dataset acquired between December 2006 and January 2010 [2,3], which will allow us to investigate both the day-to-day and local time variability.
Mesosphere dynamics
Venus is a natural laboratory to study the atmospheric circulation on a slowly rotating planet. The dynamics of its upper atmosphere (60-120 km) is a combination of retrograde zonal wind found in the lower mesosphere and solar-to-antisolar winds that characterize the thermosphere, and it is subject to a strong turbulence and a dramatic variability both on day-to-day as well as longer timescales. Moreover, several wavelike motions with different length scales have been detected at these altitudes within and above the clouds and they are supposed to play an important role in the maintenance of the atmospheric circulation. The basic processes maintaining the super-rotation (an atmospheric circulation featuring zonal winds at the clouds level being 60 times faster than the rotation of the planet itself) and other dynamical features of Venus circulation are still poorly understood [4].
Temperature maps
We used temperature retrievals derived from the VIRTIS experiment on board the European mission Venus Express [1]. VIRTIS consisted of two channels: VIRTIS-M and VIRTIS-H. In this study, we analyzed the complete VIRTIS-M dataset acquired between December 2006 and January 2010, corresponding to orbits #23 to #843 [2,3]. Figure 1 shows the latitude-altitude temperature field averaging the whole VIRTIS-M dataset.
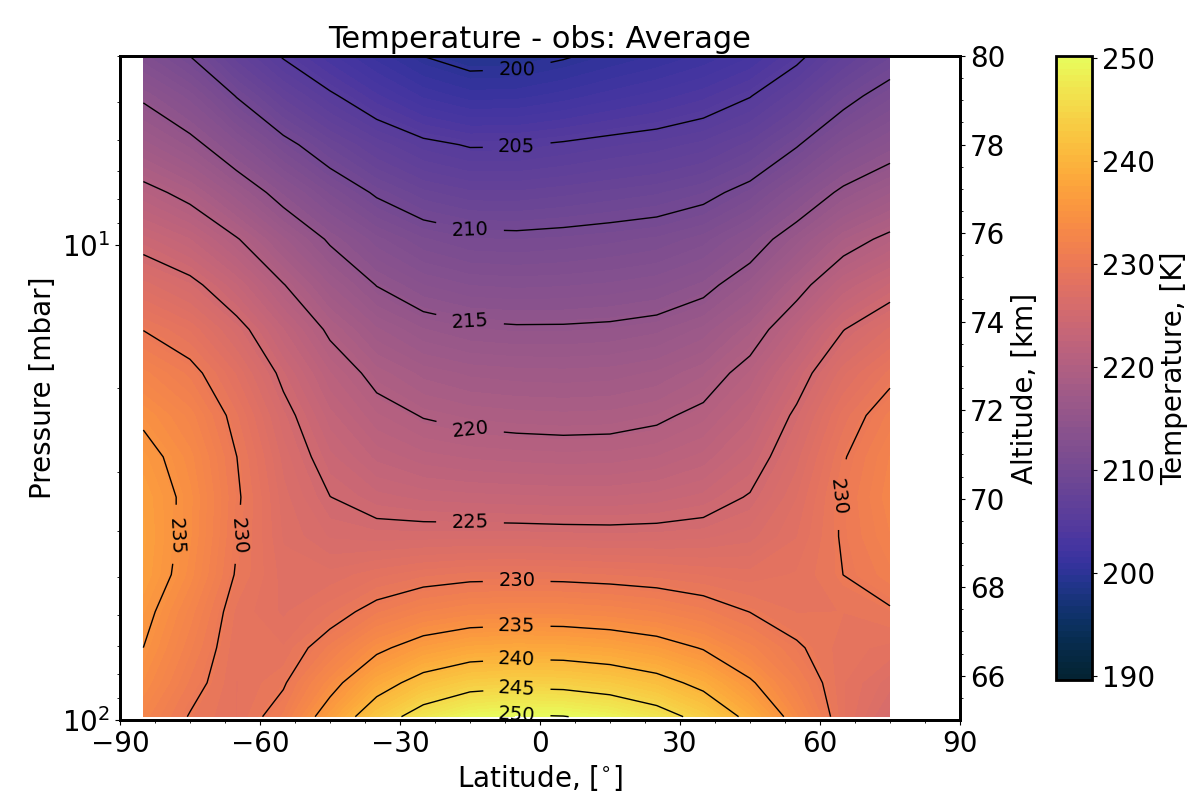
Figure 1: Temperature cross-section obtained averaging the whole VIRTIS-M dataset. The data was acquired between 14 May 2006 and 15 August 2008[1] (orbits 23-843)
Winds maps
Different techniques have been used to obtain direct observations of wind at various altitudes: tracking of clouds in ultraviolet (UV) and near infrared (NIR) images give information on wind speed at cloud top (~70 km altitude) [5] and within the clouds (~61 km, ~66 km) [6], while ground-based measurements of doppler-shift in CO2 band at 10 μm [4] and in several CO (sub-)millimeter lines [7,8] sound thermospheric and upper mesospheric winds, showing a strong variability.
In the mesosphere, at altitudes where direct observations of wind are not possible, zonal wind fields can be derived from the vertical temperature structure using the thermal wind equation. Previous studies [9,10,11,12] showed that on slowly rotating planets, like Venus and Titan, the strong zonal winds at cloud top can be successfully described by an approximation of the Navier–Stokes equation, the cyclostrophic balance in which equatorward component of centrifugal force is balanced by meridional pressure gradient. Figure 2 shows an example of zonal wind derived from VIRTIS temperature retrievals combining all cubes in orbit #151.
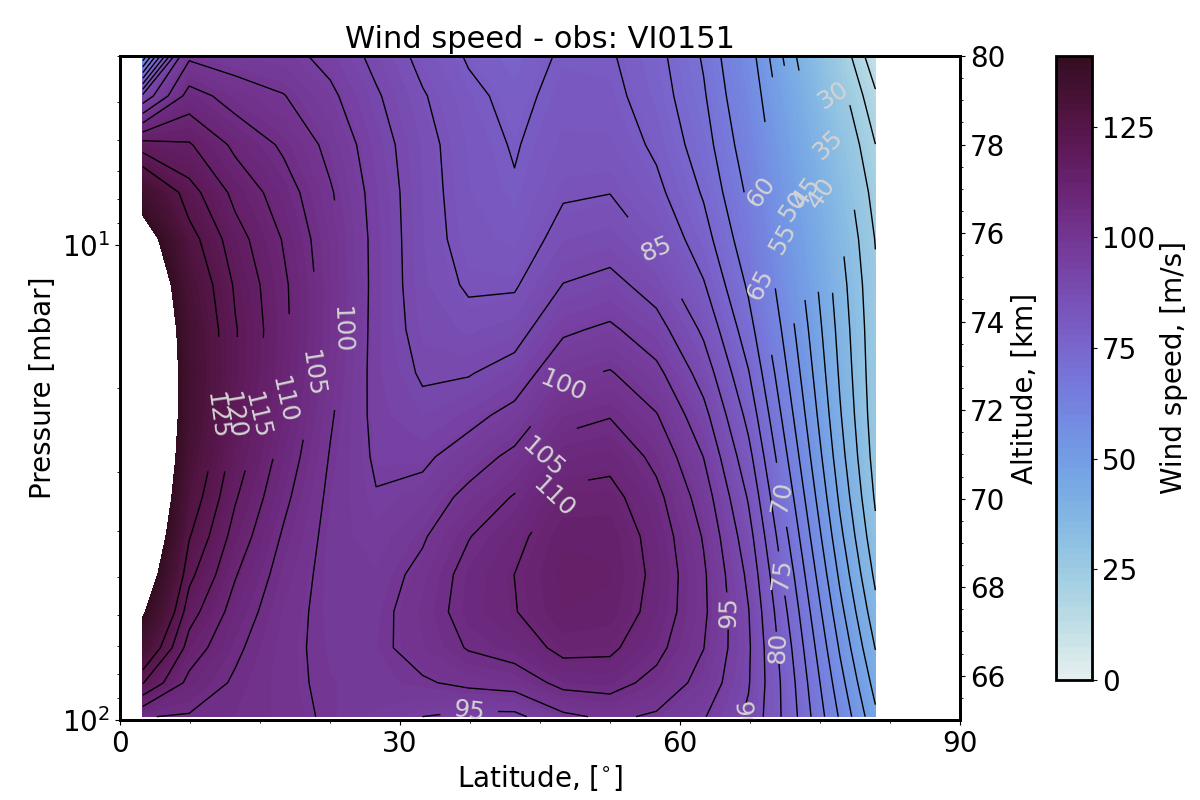
Figure 2: Example of a zonal wind cross-section for orbit #151.
Figure 3 compares 23 zonal wind profiles (thick colored lines) to cloud-tracking measurements (background image, from Goncalves et al., 2020 [5]) at an altitude of 70 km. The wind profiles present a high day-to-day variability, in good comparison with previous observations. As a next step, we plan to analyze more in detail both the day-to-day and the local time variability and compare our results to the Venus Planetary Climate Model [13].
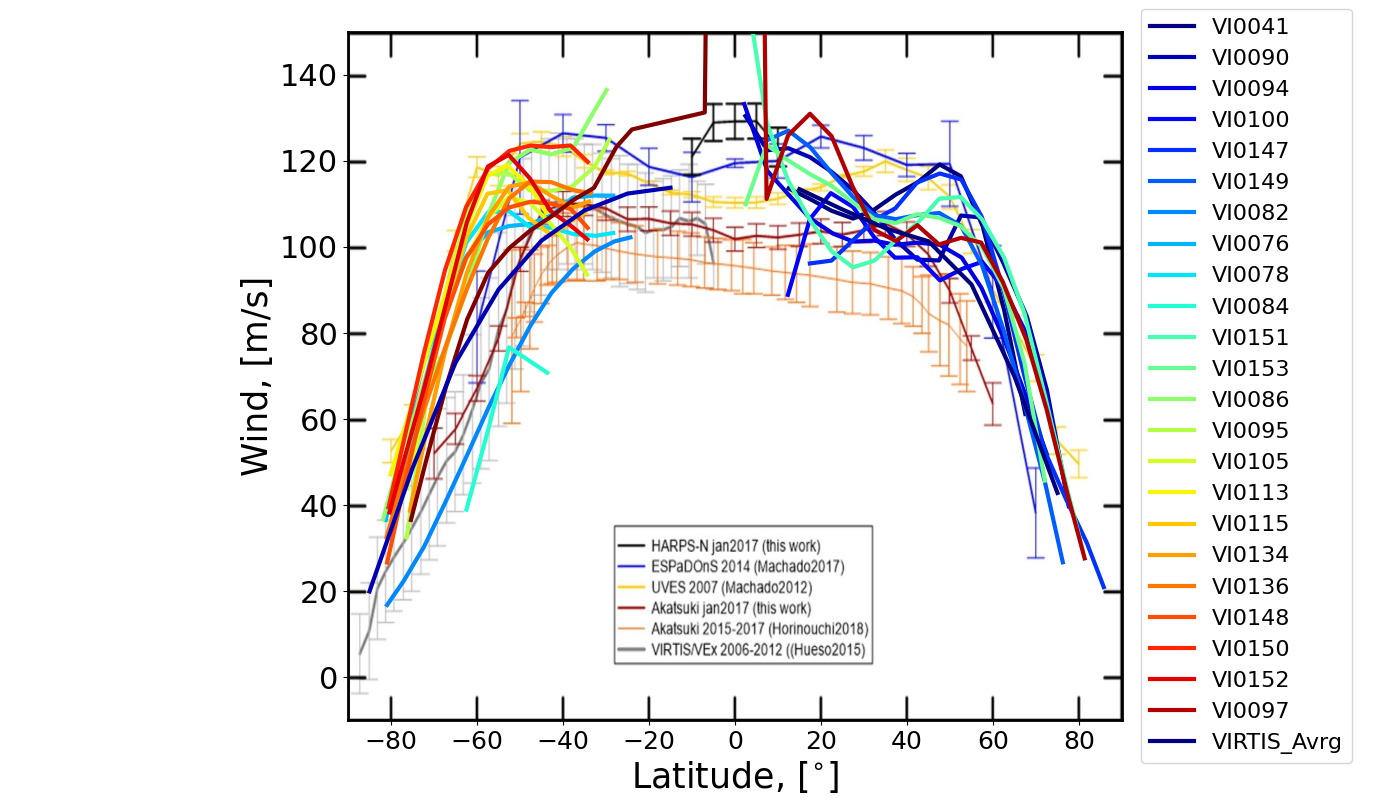
Figure 3: All zonal wind profiles (23 orbits) compared to cloud-tracking observations (from Goncalves R. et al., 2020) at an altitude of 70 km.
References
[1] Drossart, P. et al. (2007) PSS, 55:1653–1672
[2] Grassi D. et al. (2008) JGR., 113, 2, E00B09.
[3] Migliorini, A. et al. (2012) Icarus 217, 640–647.
[4] Sanchez-Lavega, A. et al. (2017) Space Science Reviews, Volume 212, Issue 3-4, pp. 1541-1616.
[5] Goncalves R. et al. Atmosphere, 12:2., 2021. doi: 10.3390/atmos12010002.
[6] Hueso, R. et al. (2012) Icarus, Volume 217, Issue 2, p. 585-598.
[7] Sornig, M. et al. (2013) Icarus 225, 828–839.
[8] Rengel, M. et al. (2008) PSS, 56, 10, 1368-1384.
[9] Piccialli, A. et al. A&A, 606, A53 (2017) DOI: 10.1051/0004-6361/201730923
[10] Newman, M. et al. (1984) J. Atmos. Sci., 41, 1901-1913.
[11] Piccialli A. et al. (2008) JGR, 113,2, E00B11.
[12] Piccialli A. et al. (2012) Icarus, 217, 669–681
[13] Martinez et al. (2023) Icarus, 389, 115272, doi:10.1016/j.icarus.2022.115272
How to cite: Piccialli, A., Grassi, D., Migliorini, A., Lebonnois, S., Politi, R., Piccioni, G., and Drossart, P.: Analyzing the variability of zonal winds in Venus mesosphere using VIRTIS/VEx temperature maps, Europlanet Science Congress 2024, Berlin, Germany, 8–13 Sep 2024, EPSC2024-94, https://doi.org/10.5194/epsc2024-94, 2024.
- Introduction
The Venus PCM (Planetary Climate Model) [1,2] has been using a pre-computed net exchange rate (NER) matrix formalism to calculate the infrared radiative transfer in the wavelength range, from 1.7 to 250 μm. This implementation allows the Venus PCM to compute temperature self-consistently. However, this formalism has a drawback, as the cloud model has to be fixed in the computation of the NER matrix, decoupled from the Venus PCM. In this work, we present recent improvements done to the infrared radiative transfer, in order to improve the Venus PCM performances.
- Update of the opacity properties
When calculating the NER coefficients, the high-resolution spectrum data, cloud opacities, and Collision induced absorption (CIA) are integrated [3]. As the dominant gas compound, CO2 dominates most of the energy exchange. In this work, the high-resolution spectrum data of different molecules are updated to the latest version as Figure 1 shows. A new combination of sub-lorentzian far-wing profiles of CO2 is also considered [4,5,6]. The influence of this update on the energy exchange, as discussed in [7], will be presented.
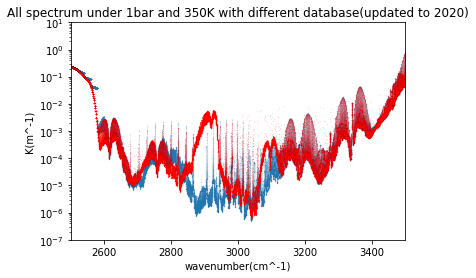
Figure 1: The comparison of the total spectrum absorption coefficient calculated under 1bar 350K for the 2500-3500 cm-1 wavenumber range. The blue line presents the former database used in the Venus PCM, and the red line is for the results using the updated HITRAN database
- A new IR scheme
A new scheme is now implemented to compute online the radiative transfer both for the solar and for the infrared radiation. This scheme, based on the radiative transfer scheme used in the Generic PCM, allows us to include a better coupling between opacity distributions and dynamics in the model [8]. In particular, it will allow a full coupling between cloud distributions (soon to be consistently modeled thanks to a full microphysical module), temperature structure and atmospheric dynamics. This provides more flexibility to study radiative sensitivity to opacity sources.
The different temperature structures simulated in the deep atmosphere using each of the two schemes are compared, as well as the energy exchange rates in the important windows such as 3-7 μm [7]. This update will help us to better understand the mechanisms that control temperature and dynamical structure in the deep atmosphere.
References
[1] Lebonnois, S., Sugimoto, N., & Gilli, G. (2016). Icarus, 278, 38-51, doi : 10.1016/j.icarus.2016.06.004
[2] Garate-Lopez, I., & Lebonnois, S. (2018). Icarus, 314, 1-11, doi : 10.1016/j.icarus.2018.05.011
[3] Eymet, V., Fournier, R., Dufresne, J. L., Lebonnois, S., Hourdin, F., & Bullock, M. A. (2009). Journal of Geophysical Research: Planets, 114(E11), doi : 10.1029/2008JE003276
[4] Tran, H., Boulet, C., Stefani, S., Snels, M., & Piccioni, G. (2011). Journal of Quantitative Spectroscopy and Radiative Transfer, 112(6), 925-936, doi : 10.1016/j.jqsrt.2010.11.021
[5] Tonkov, M. V., Filippov, N. N., Bertsev, V. V., Bouanich, J. P., Van-Thanh, N., Brodbeck, C., ... & Le Doucen, R. (1996). Applied optics, 35(24), 4863-4870.
[6] Pollack, J. B., Dalton, J. B., Grinspoon, D., Wattson, R. B., Freedman, R., Crisp, D., ... & Tipping, R. (1993). Icarus, 103(1), 1-42, doi : 10.1006/icar.1993.1055
[7] Lebonnois, S., Eymet, V., Lee, C., & Vatant d'Ollone, J. (2015). Journal of Geophysical Research: Planets, 120(6), 1186-1200, doi : 10.1002/2015JE004794
[8] Turbet, M., Leconte, J., Selsis, F., Bolmont, E., Forget, F., Ribas,I., Raymond, S., Anglada-Escudé, G. (2016). Astronomy & Astrophysics, 596, A112, doi:10.1051/0004-6361/201629577
How to cite: Han, P., Lebonnois, S., and Turbet, M.: Update of the thermal radiative transfer in the Venus PCM, Europlanet Science Congress 2024, Berlin, Germany, 8–13 Sep 2024, EPSC2024-344, https://doi.org/10.5194/epsc2024-344, 2024.
Please decide on your access
Please use the buttons below to download the supplementary material or to visit the external website where the presentation is linked. Regarding the external link, please note that Copernicus Meetings cannot accept any liability for the content and the website you will visit.
Forward to presentation link
You are going to open an external link to the presentation as indicated by the authors. Copernicus Meetings cannot accept any liability for the content and the website you will visit.
We are sorry, but presentations are only available for users who registered for the conference. Thank you.
Introduction
The VenSpec-U instrument is part of ESA’s EnVision mission (to be launched in 2031) as a core element part of the VenSpec instrumental suite. Its main scientific objectives are to study mesospheric gas variations as well as cloud and particulate variability, and how they are linked to intrinsic atmospheric processes or external forcings (e.g. volcanism). VenSpec-U is consequently dedicated to the monitoring of the cloud top sulphured gases (SO, SO2), as well as cloud top altitude and UV albedo contrasts through spectral and spatial analysis of backscattered sunlight on the dayside of Venus.
Instrument Description
Observations are performed on a “pushbroom” observational strategy, in a nadir or near-nadir (emission angle < 20°) geometry thanks to a UV imaging spectrometer operating in the 190 – 380 nm spectral range. Spectral resolutions shall be better than 0.2 nm in the 205 – 235 nm range (typical SNR of 100 or above at 220 nm), and better than 2 – 5 nm in the 190 – 380 nm range (typical SNR of 200 or above at 220 nm). Spatial sampling shall range from 3 km to 24 km, depending on spectral resolution and orbiter altitude. The narrow-slit axis of the instrument contains the spectral information, whereas the long-slit axis contains the spatial information along the 20° field of view. The remaining spatial direction is provided through orbital scrolling. The VenSpec-U instrument is therefore based on a dual-channel architecture, high spectral resolution (HR) and low spectral resolution (LR). Each channel consists of an entrance baffle, an objective and a spectrometer mainly composed of a slit, a short-pass filter and a spherical holographic grating. Each slit image is formed on a shared CMOS back-side illuminated detector. The detector is controlled such that the integration time and the binning scheme is adjusted independently (and simultaneously) for each channel giving high flexibility and providing parameters for the optimisation of each acquisition. Calibration will be performed through regular Sun observations, through pinholes or using a blank diffuser.
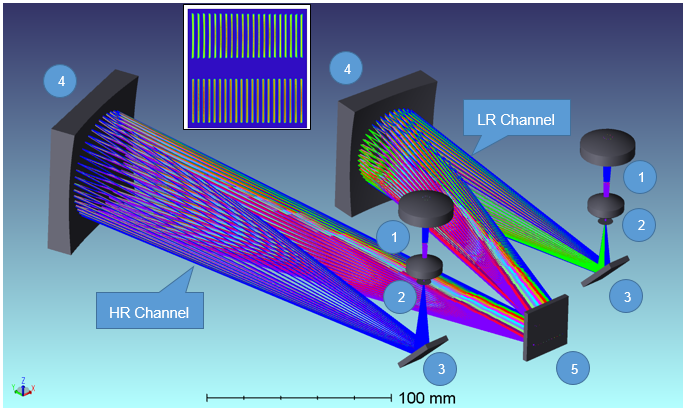
Figure 1: Optical layout of VenSpec-U. 1:Objectives, 2: Slits, 3: Filters, 4: Gratings, 5: Shared detector
Science Objectives
SO2 climatology The monitoring of sulfur dioxide (SO2) above the clouds of Venus has been ongoing since the 1980s, revealing significant variability. Measurements from spacecraft like Pioneer Venus Orbiter and Venera 15, as well as from Earth-based telescopes, have shown that SO2 levels vary greatly both temporally and spatially. In lower latitudes, variability spans three orders of magnitude, while at high latitudes (beyond ±50°), SO2 levels remain consistently low. Most variability occurs in localized and transient SO2 "plumes", which last for a few Earth days and cover about 1000 km.
The short lifespan of SO2 above the clouds suggests rapid photochemical reactions as primary sink for SO2. Vertical mixing from the lower atmosphere replenishes SO2 above the clouds. Fluctuations in vertical mixing may also occur due to atmospheric oscillations, further complicating the understanding of SO2 variability, and highlighting the need for a more accurate and extensive temporal and spatial characterization.
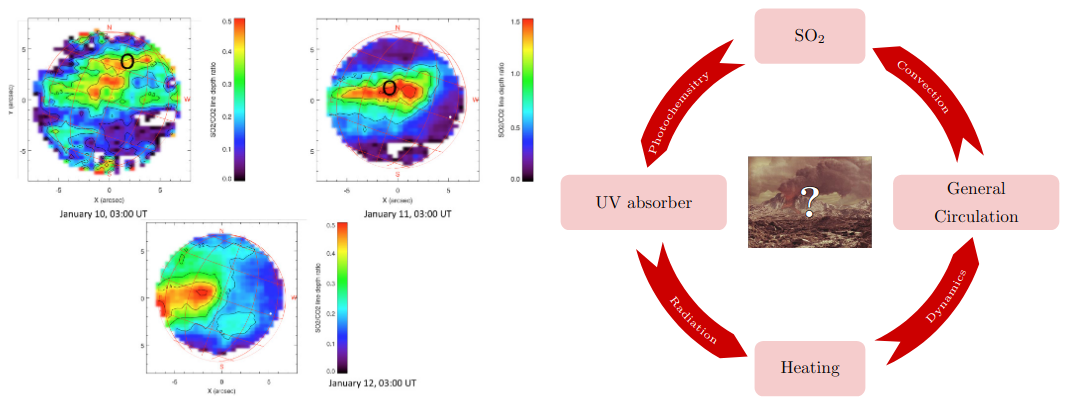
Figure 2: Left: SO2 plumes as observed by TEXES/IRTF; Right: putative closed feedback loop yielding spontaneous oscillations of these known to vary atmospheric quantities
SO:SO2 ratio measurements Observations have also focused on the relative abundance of sulfur monoxide (SO) to SO2, crucial for understanding sulfur chemistry and the above mentioned photochemical destruction of SO2. However, the overlap in absorption spectral bands necessitates high spectral resolution for accurate measurements. Studies using instruments like STIS on board the Hubble Space Telescope have found varying SO:SO2 ratios, impacting the interpretation of SO2 retrievals which usually assume a fixed value for the SO:SO2 ratio.
UV absorber monitoring Venus' upper clouds also contain an unidentified species that absorbs near UV light. This UV absorber's long-lasting presence allows for cloud tracking and wind speed measurements. Long-term monitoring reveals decennial variability in Venus' albedo, suggesting complex interactions between atmospheric parameters like SO2 levels, solar heating through UV absorption and general atmospheric circulation.
Small scale processes Small-scale (<10 km horizontal resolution) observations have identified convective structures and linear wave fronts at cloud top level, indicating a coupling between topography and atmospheric circulation. These observations raise questions about the existence of similar contrasts in other parameters, such as SO2 and SO column densities and/or cloud top altitude. Such observations would aid in refining mesoscale models and large eddy simulations including chemistry and microphysical processes, contributing to a better understanding of Venus' atmosphere at horizontal scales ranging from a few kilometers to several thousands kilometers.
How to cite: Marcq, E., Lustrement, B., Bertran, S., Lasue, J., Vinatier, S., Lara, L., Conan, L., Lefèvre, M., Alemanno, G., Vandaele, A. C., Robert, S., and Helbert, J.: The VenSpec-U Ultraviolet Spectral Imager on board EnVision, Europlanet Science Congress 2024, Berlin, Germany, 8–13 Sep 2024, EPSC2024-335, https://doi.org/10.5194/epsc2024-335, 2024.
Abstract:
The gravity field of planets is determined using the Doppler radio-tracking data of orbiting spacecraft. However, this method is intrinsically limited by the orbit of the spacecraft, the noise on the Doppler data, the temporal and spatial coverage of the tracking dataset, as well as the inaccuracies of the non-gravitational perturbations of the spacecraft motion and of the rotation and orientation of the planet.
The monitoring of tie-points identified on planetary surface images is helpful to improve the determination of the pole precession and rotation rate of the planet performed with Doppler data alone, and in turn the determination its gravity field.
This study investigates the joint inversion of tie-points identified on SAR images data and Doppler tracking data scheduled for the science phase of the EnVision mission to Venus due to be launched in 2031.
1- EnVision gravity experiment
The gravity experiment onboard Envision will use the telecommunication system onboard the spacecraft to establish a coherent Doppler link (X-band uplink and dual X/Ka band downlink) between this spacecraft and on ground deep space tracking stations. This link will be established at each telemetry slot providing at least 3,5 hours of effective tracking per day throughout the science phase of the mission, i.e. 6 Venusian days (4 Earth-years). The orbit of the spacecraft is foreseen to be near-polar (inclination of 88°) and slightly elliptical (altitude between 220 km to 525 km).
Numerical simulations of this Doppler tracking dataset have been performed to assess the expected precision of the determination of the gravity field (accuracy and spatial resolution) as well as of some geophysical parameters related to the internal structure of the planet, i.e. k2 tidal potential Love number, tidal phase lag and moment of inertia (MoI) of the planet (Rosenblatt et al., 2021).
These simulations show that the spatial resolution is better than 200 km over almost all the surface of the planet (Rosenblatt et al., 2024). The k2 tidal Love number is determined with a precision of about 1%, the pole precession with a precision yielding to an uncertainty of 2% on the MoI value, and the tidal phase lag with a precision of about 60% (see Table 1).
The uncertainty on k2, tidal phase lag, and MoI values will allow to further constrain models of the internal structure of the planet, in particular the viscosity profile of the mantle (single or multi layers models) (Dumoulin et al., 2017; Musseau et al., 2024).
The uncertainty on the rotation rate or length-of-day (LOD) of the planet is 0.03 minutes which is 0.4% of the 7 minutes range of values obtained at different periods and using different methods (see Lévesque et al., 2024).
Table 1: Expected uncertainty (3 times the formal error) on geophysical parameters determined with the Doppler tracking data alone.
| Parameter | 3-sigma uncertainty |
| Tidal Love number k2 (real part) | 3.6x10⁻³ (1.2%) |
| Moment of inertia (MoI) | 6.4x10⁻³ (1.9%) |
| Tidal phase lag (in degree) | 0.3° (62.2%) |
| Load Love number k’2 | 0.18 (54%) |
| Length Of Day (LOD) | 2x10⁻⁵ days (0.03 minute) |
2- Simulations of tie-points
In order to improve the error on the planet orientation parameters related to the interior structure (i.e. pole precession), we have simulated the monitoring of tie-points that could be built with the radar images that will be taken by the VenSAR instrument throughout the mission science phase.
The radar images will be collected over Regions of Interest (RoI) corresponding to about 20% of the planetary surface, offering the opportunity to monitor, over the 6 Venusian days duration of the mission, the position variations, in a celestial reference frame, of several tie-points associated with surface craters, coronae and so on. The spatial resolution of the radar images is foreseen to be 10 meters and 3 meters for some high-resolution images at dedicated local areas. As the geographical coordinates of these tie-points are known in a frame tied to the planet, it is possible to monitor the orientation parameters as well as to determine its rotation rate.
We have performed numerical simulations of the retrieval of the orientation parameters using the spatial and temporal coverage of the future VenSAR images. We have identified 104 tie-points and estimated the orientation parameters.
Then, we have merged both Doppler and tie-points simulated data to improve the resolution of these parameters and in turn of the gravity field and k2 Love numbers in order to further constrain models of interior. The uncertainty on the geophysical parameters (table 1) is expected to be improved since the tie-points provide additional information on the relative position between the spacecraft and the surface of the planet (Cascioli et al., 2023).
References:
Cascioli G. et al. (2023), The Planetary Science Journal, 4:65 (14pp); Dumoulin C. et al. (2017), JGR-Planets, 122 (6), 1338-1352; Lévesque M. et al. (2024), this meeting, Musseau Y. et al. (2024), https://doi.org/10.5194/egusphere-egu24-3129; Rosenblatt P. et al. (2021), Remote Sensing, vol. 13, 1624; Rosenblatt et al., (2024), https://doi.org/10.5194/egusphere-egu24-10232.
How to cite: Rosenblatt, P., Rambaux, N., Dumoulin, C., Marty, J.-C., Phan, P.-L., and Laurent-Varin, J.: EnVision gravity experiment: Joint inversion of Doppler tracking data and tie-points monitoring from SAR images., Europlanet Science Congress 2024, Berlin, Germany, 8–13 Sep 2024, EPSC2024-410, https://doi.org/10.5194/epsc2024-410, 2024.
Introduction
Previous missions to Venus depicted an environment dominated by volcanic landforms and hostile atmospheric conditions. The surface was imaged by the Magellan mission, and compositional information were extracted from the Venera, VEGA and Venus Express missions. However, these data show low resolution and uncertain geologic correlation. To improve our knowledge, new missions towards Venus are planned, like ESA’s EnVision. EnVision will study the surface and subsurface of Venus and its relationship with the atmosphere with various instruments, among which a subsurface radar sounder (SRS). SRS will operate at a central frequency of 9 MHz with a bandwidth of 5 MHz, penetrating for few hundred meters through the subsurface, with a vertical resolution of about 20 m [1]. One of SRS targets are lava flow features. This work analyses the existing literature related to lava flow features on Venus, to extract morphometric and compositional information to improve the SRS performance prediction through simulations based on geological analogues. This approach exploits existing radargrams in geologically analogous terrains to produce realistic simulations of the investigated target, using parameters related to the composition and morphometry of the target [2].
Lava flows properties and distribution
Several classifications for Venus flows are based on morphology and radar backscatter (Figure 1). These morphologies are then compared to terrestrial common effusive features: pahoehoe, a'a, and blocky. Pahoehoe interpretation prevails based on Magellan radar backscatter of Venus flows, panoramas of the Venera landing sites and comparison with terrestrial lava flows, with values of rms slopes at Magellan SAR resolution of 75 m ranging from 2.5° to 8° [3]. Estimates of flow thicknesses from Magellan altimetric data and stratigraphic relationships span from 10-30 m to 400 m [4]. The extension of flows ranges from tens up to thousands kilometres.
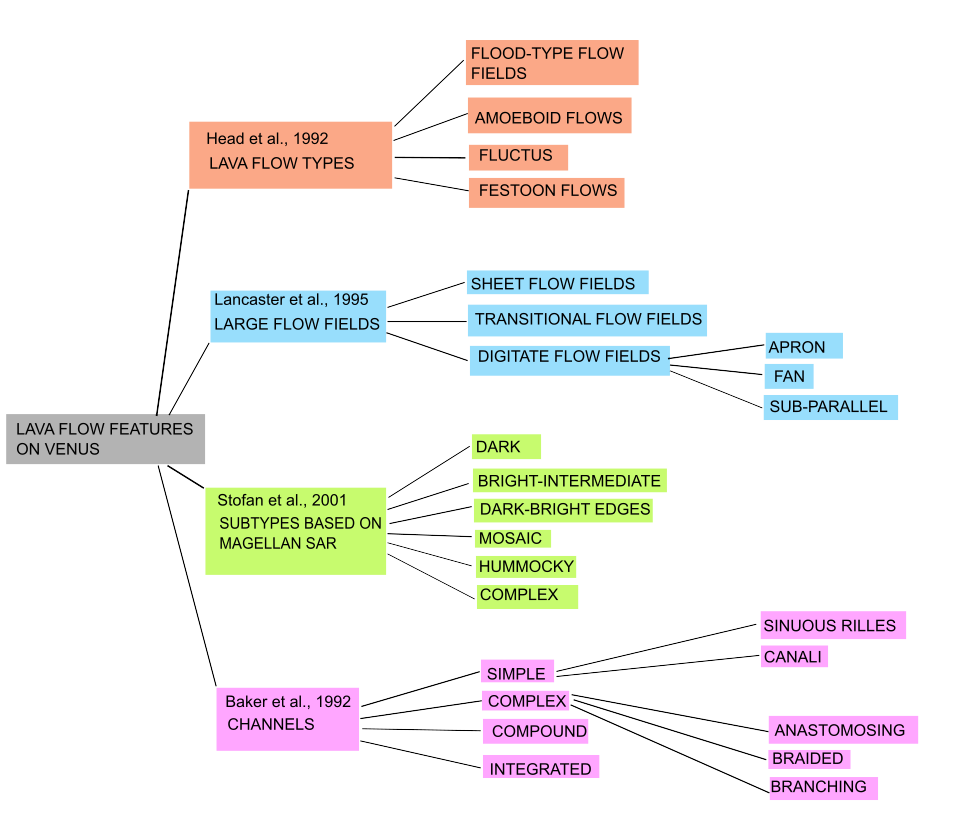
Figure 1: Classifications of lava flow features (elaboration from [5], [6], [7], [8]).
The composition of lava flows inferred by previous missions and morphological observations suggest a predominantly mafic composition, mostly tholeiitic and alkali basalts (Table 1) [9]. Predicted values of porosity are lower for Venus than Earth, varying from 0.05 to 0.75 (bubble volume fraction). More exotic compositions for channels are considered, such as carbonatite or sulphur, and more evolved compositions are possible. Emissivity measurements of Venus flows range from 0.7 to 0.9, consistent with basaltic samples [3].
Table 1: Characteristics of Venera and VEGA landing sites from [9].
|
Landing site (Lat°, Long°) |
Geochemistry |
Inferred porosity |
|
Venera 8 (-10.70, 335.24) |
Very high K, Th, U |
- |
|
Venera 9 (31.01, 291.64) |
Low K, U; high Th |
- |
|
Venera 10 (15.42, 291.51) |
Low K, U, Th |
1–7% |
|
Venera 13 (-7.55, 303.69) |
High K basalt |
50–53 % |
|
Venera 14 (13.05, 310.19) |
Tholeiitic basalt |
60–62 % (top layer)/ 50–53 % (below) |
|
VEGA 1 (8.10, 175.85) |
Low K, U, Th |
- |
|
VEGA 2 (-7.14, 177.67) |
Tholeiitic basalt; low K, U, Th |
13% |
Lava flows are associated with volcanic edifices, rift zones and coronae. There is a concentration of these features in the Beta-Atla-Themis Regios and in Sedna Planitia (Figure 2) [6]. Comparing the probable composition of lava flows to that of their terrestrial analogues, geodynamic contexts for tholeiitic and alkali basalts would be consistent with Earth analogues like NMORB, islands arcs and hot spots, with melting occurring in the shallow mantle or at much greater depth. Carbonatite volcanism occurs on Earth in intraplate regions, on hotspots, associated with orogenic activity or plate separation, and is mantle-derived [8].
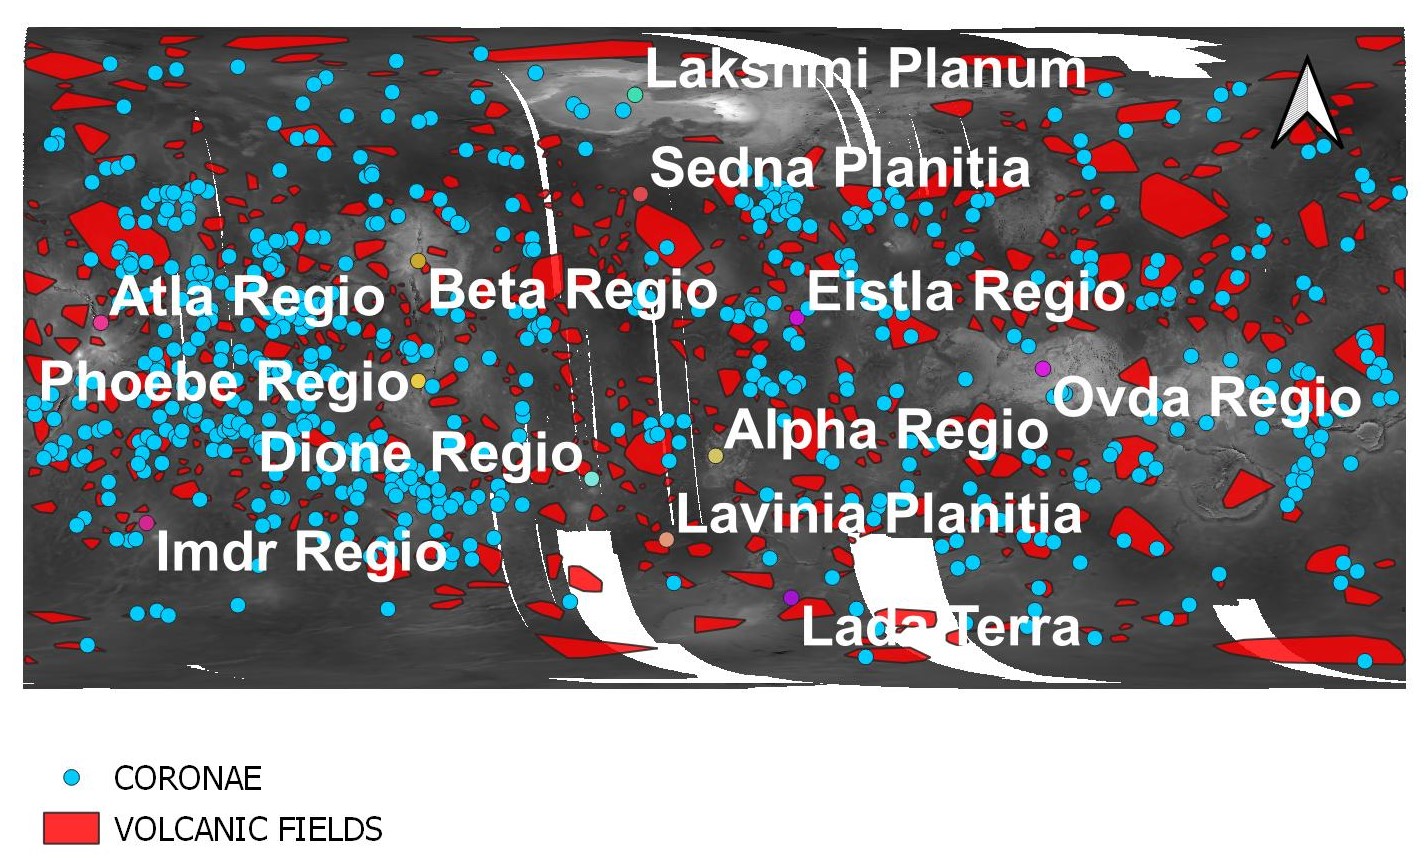
Figure 2: Map of Venus with major volcanic environments (elaboration from [10], [11]).
Conclusions
The analysis of the literature on lava flows on Venus is useful for both fine-tuning the expected performance of SRS on these features and defining scenarios to be accurately simulated. Considering lava flows compositional and morphological parameters, SRS is expected to be able to detect changes between flows based on composition, porosity, surface roughness and thus to provide a new stratigraphic perspective of Venus history.
References
[1] L. Bruzzone et al., ‘Envision Mission to Venus: Subsurface Radar Sounding’, in IGARSS 2020 - 2020 IEEE International Geoscience and Remote Sensing Symposium, Sep. 2020, pp. 5960–5963. doi: 10.1109/IGARSS39084.2020.9324279.
[2] S. Thakur and L. Bruzzone, ‘An Approach to the Simulation of Radar Sounder Radargrams Based on Geological Analogs’, IEEE Trans. Geosci. Remote Sens., vol. 57, no. 8, pp. 5266–5284, Aug. 2019, doi: 10.1109/TGRS.2019.2898027.
[3] B. A. Campbell and D. B. Campbell, ‘Analysis of volcanic surface morphology on Venus from comparison of Arecibo, Magellan, and terrestrial airborne radar data’, J. Geophys. Res. Planets, vol. 97, no. E10, pp. 16293–16314, Oct. 1992, doi: 10.1029/92JE01558.
[4] K. M. Roberts et al., ‘Mylitta Fluctus, Venus: Rift-related, centralized volcanism and the emplacement of large-volume flow units’, J. Geophys. Res. Planets, vol. 97, no. E10, pp. 15991–16015, 1992, doi: 10.1029/92JE01245.
[5] M. G. Lancaster et al., ‘Great Lava Flow Fields on Venus’, Icarus, vol. 118, no. 1, pp. 69–86, Nov. 1995, doi: 10.1006/icar.1995.1178.
[6] J. W. Head et al., ‘Venus volcanism: Classification of volcanic features and structures, associations, and global distribution from Magellan data’, J. Geophys. Res. Planets, vol. 97, no. E8, pp. 13153–13197, 1992, doi: https://doi.org/10.1029/92JE01273.
[7] E. Stofan, ‘Development of Large Volcanoes on Venus: Constraints from Sif, Gula, and Kunapipi Montes’, Icarus, vol. 152, no. 1, pp. 75–95, Jul. 2001, doi: 10.1006/icar.2001.6633.
[8] V. R. Baker et al., ‘Channels and valleys on Venus: Preliminary analysis of Magellan data’, J. Geophys. Res. Planets, vol. 97, no. E8, pp. 13421–13444, 1992, doi: https://doi.org/10.1029/92JE00927.
[9] A. Abdrakhimov and A. Basilevsky, ‘Geology of the Venera and Vega Landing-Site Regions’, Sol. Syst. Res., vol. 36, pp. 136–159, Jan. 2002, doi: 10.1023/A:1015222316518.
[10] R. M. Hahn and P. K. Byrne, ‘A Morphological and Spatial Analysis of Volcanoes on Venus’, J. Geophys. Res. Planets, vol. 128, no. 4, p. e2023JE007753, 2023, doi: https://doi.org/10.1029/2023JE007753.
[11] E. R. Stofan et al., ‘Preliminary analysis of an expanded corona database for Venus’, Geophys. Res. Lett., vol. 28, no. 22, pp. 4267–4270, 2001, doi: https://doi.org/10.1029/2001GL013307.
How to cite: Molaro, L. and Bruzzone, L.: Analysis of lava flow features on Venus for radar sounder simulations, Europlanet Science Congress 2024, Berlin, Germany, 8–13 Sep 2024, EPSC2024-836, https://doi.org/10.5194/epsc2024-836, 2024.
Introduction: One of the science priorities of the EnVision mission is to infer the interior structure of Venus, including the properties and thicknesses of its crust, mantle, and core [1]. Measurements of the moment of inertia and length-of-day variations provide critical geodetic constraints to understand the bulk interior structure of the planet. The polar moment of inertia of Venus is inversely proportional to the precession rate.
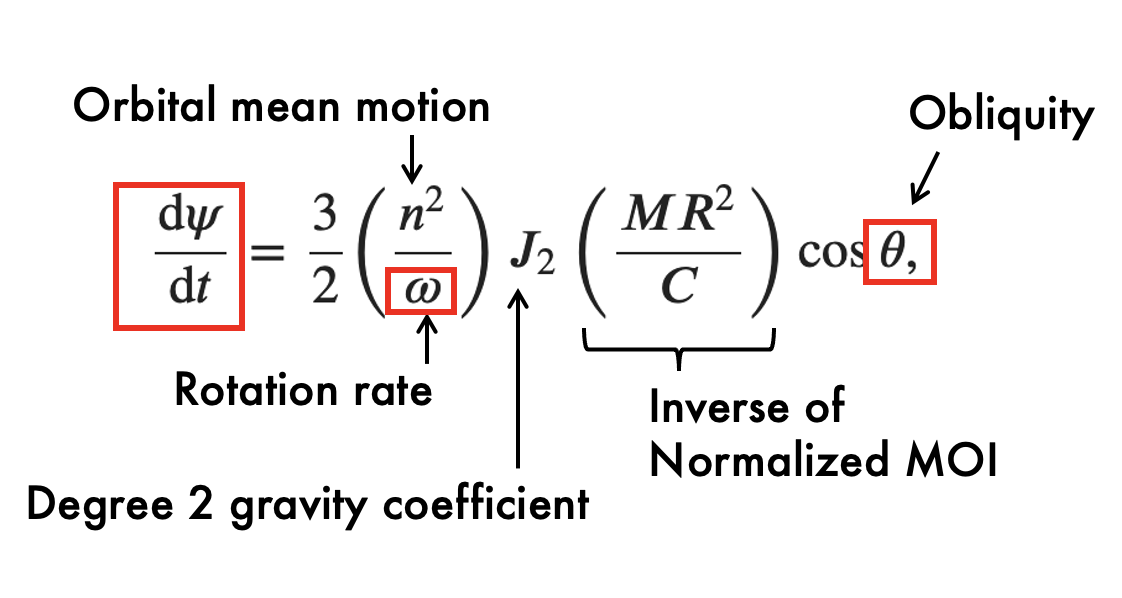
Measuring the precession rate directly from orbit is challenging. For Magellan, spacecraft ephemeris errors dominated the measurement errors and for EnVision very similar challenges are expected. The precession rate itself depends on a number of geodetic parameters, namely the orbital mean motion, the spin rate, the second-degree gravity coefficient, the total mass of the planet, the radius, and the obliquity. To constrain the inertia tensor of Venus and hence to meet the EnVision objectives, the gravity field information must be complemented by measurements of the rotational state. Therefore, augmenting the gravity science solution with surface feature tracking and/or altimetry – abilities that VenSAR offers – can be critical in achieving EnVision science objectives. VenSAR has the capability to make use of globally distributed VenSAR altimetry data and ground-track intersections (cross-over points) to create a dense geodetic net. These observations can be used in concert with gravity observations and SAR images (Figure 1) to improve the a posteriori orbit determination, to solve for the rotation state of Venus including spin axis orientation and precession, and to allow the co-registration of other data products generated by the EnVision mission via improving the overall reference frame of Venus. The precise measurement of the rotation state allows us to infer constraints on the interior structure (e.g., by inferring the moment of inertia) as has been recently demonstrated by ground-based radar observations [2]. However, these recent measurements still provide a weak constraint on the internal density profile and core size, and improved measurements (reducing the uncertainty in the moment of inertia from currently 7% to about 4% and a measurement of the tidal Love number k2) are needed to quantify the interior structure of Venus with precision [3].
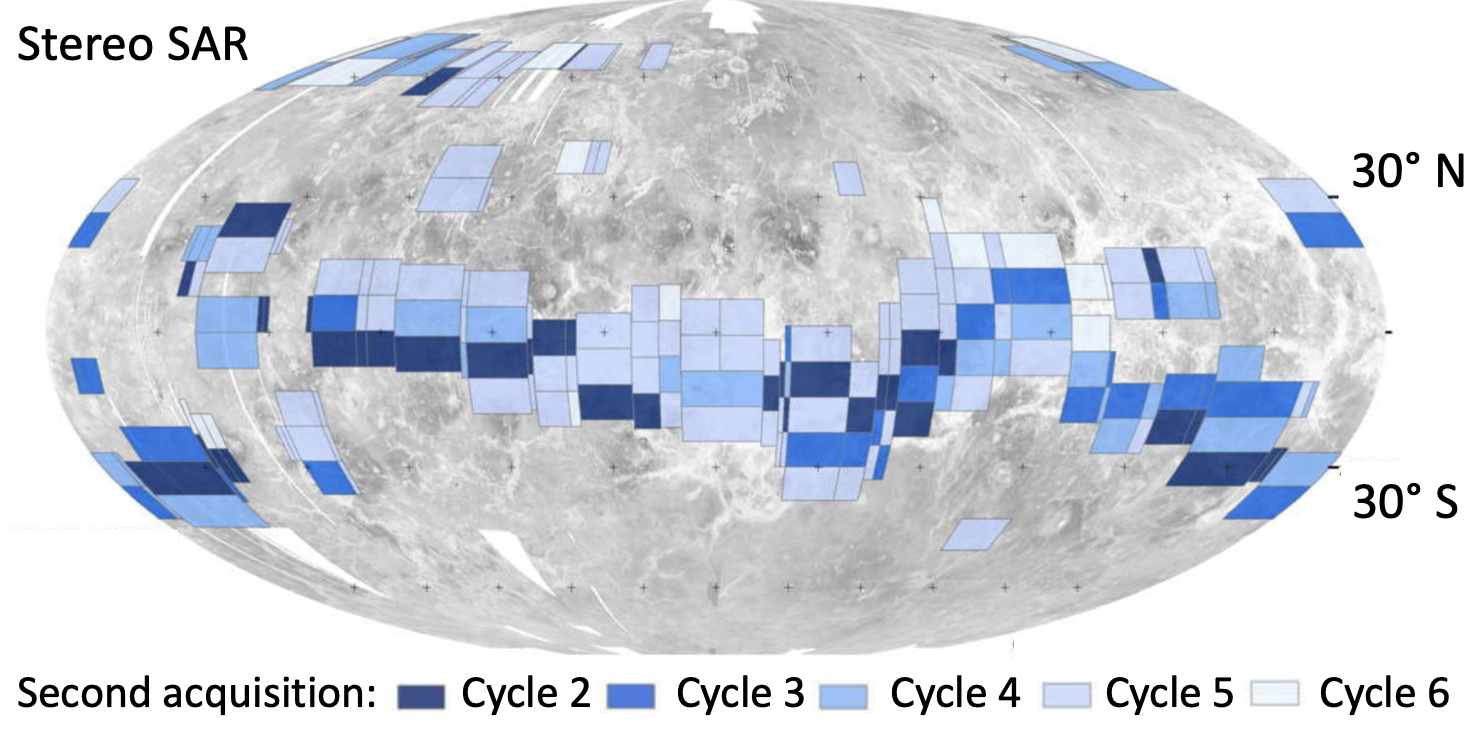
Figure 1: Second acquisition for VenSAR stereo at each Region of Interest (RoI). Adapted from [1].
Methods: As outlined in the ESA red book, in addition to stereo SAR data, VenSAR will acquire a global network of altimetry mode tracks with a vertical resolution of 2.5 m, potentially providing a far better constraint than any previous dataset. The aim of this work is to establish the link between VenSAR and EnVision’s geodetic measurements and the interior structure of Venus. We analyzed the currently planned EnVision orbit and operational profile, identifying regions with repeated coverage, and altimetry intersections. For the interior models, we adapted previous Mercury interior models [4] to Venus, updated with convective thermal profiles for Venus’ mantle. Two sets of models consistent with different geodetic constraints are generated. One set with an inner core, and one without. The set of inner core models is controlled by the inner core radius as a free parameter, in absence of the inner core, the temperature above the melting point is iterated.
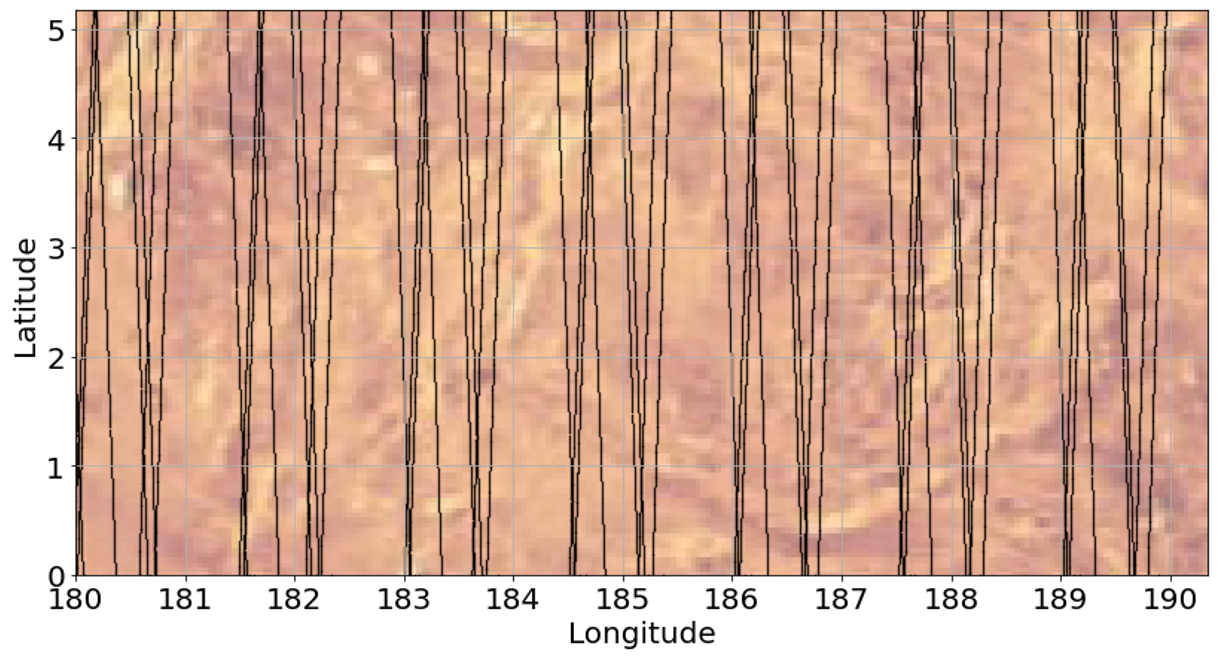
Figure 2: Zoomed in view on VenSAR altimetry groundtrack spacing and intersections.
Results: The ML007 tour has been analyzed, showing promising spatial and temporal coverage. A zoomed in view on the altimetry groundtracks is shown in Figure 3. Further, an initial set of interior models has been assembled for future investigation. An example model without inner core is shown in Figure 4. For the set of forward computed models, we further computed the tidal Love numbers for different mantle rheologies.
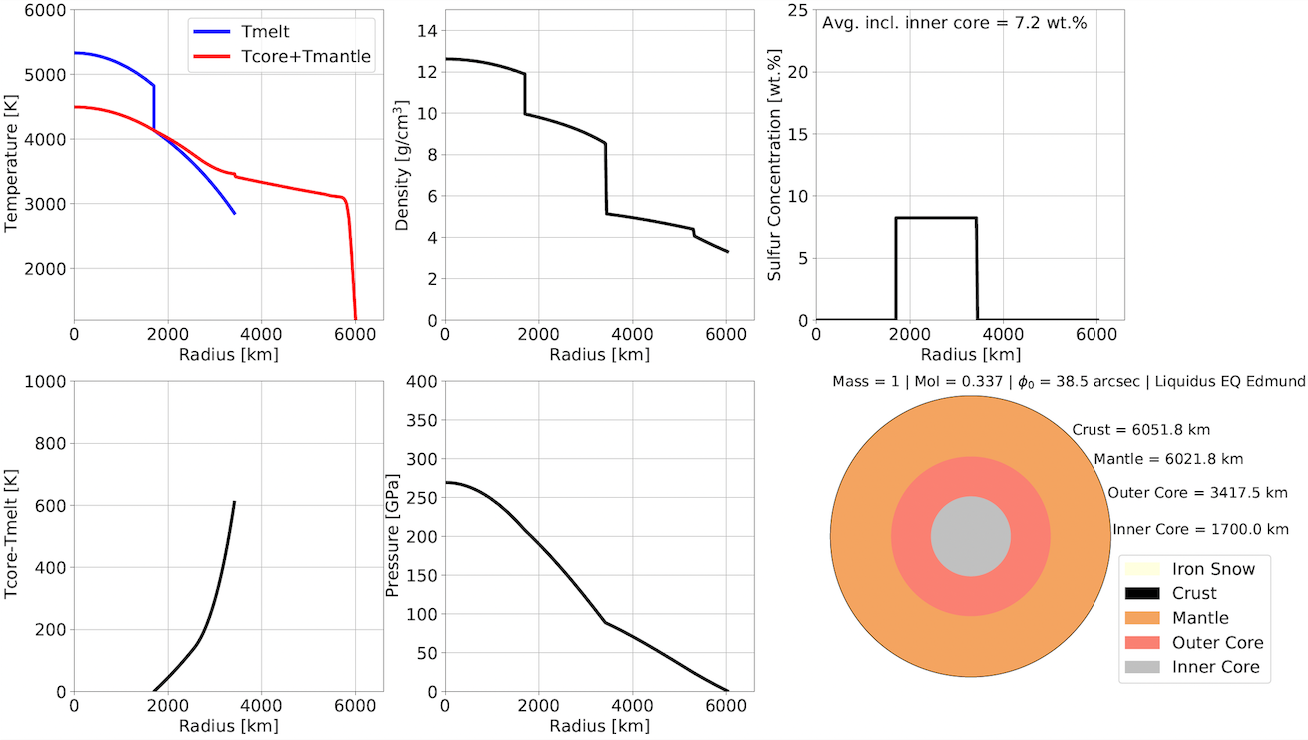
Figure 3: Example model of Venus interior structure for a model with an inner core.
Outlook: Future work we will use the tour analysis of EnVision and the estimated performance of VenSAR to infer the accuracy of the geodetic constraints from VenSAR. These constraints can then be combined with our interior models to refine the expected constraints on Venus interior structure. The assembled framework will help optimizing operation scenarios and to maximize the science return of the EnVision mission.
References: [1] ESA (2024). EnVision Definition Study Report (Red Book). [2] Margot, J.-L., et al. (2021). Spin state and moment of inertia of venus. Nature Astronomy, 5(7):676–683. [3] Cascioli, et al. (2021). The determination of the rotational state and interior structure of Venus with VERITAS. PSJ, 2(6):220. [4] Steinbrügge et al. 2021, Challenges on Mercury's interior structure posed by the new measurements of its obliquity and tides, GRL, 48;3.
Acknowledgements: A portion of this research was carried out at the Jet Propulsion Laboratory, California Institute of Technology, under a contract with the National Aeronautics and Space Administration (80NM0018D0004). This work was supported by NASA’s VENSAR program Grant NNH21ZDA001.
How to cite: Steinbruegge, G., Dunnigan, A., King, S., Mason, P., Hensley, S., and Carter, L.: Geodetic Contributions of the VenSAR Instrument for Inferring the Interior Structure of Venus, Europlanet Science Congress 2024, Berlin, Germany, 8–13 Sep 2024, EPSC2024-686, https://doi.org/10.5194/epsc2024-686, 2024.
This paper presents the Venus Emissivity Mapper (VEM) onboard NASAs Venus Emissivity, Radio science, InSAR, Topography, And Spectroscopy (VERITAS) and ESAs (EnVision) Venus orbiter missions. The VEM instrument, on EnVision called VenSpec-M, is a multispectral push-broom imager for mapping of the Venus surface and its lower atmosphere. By observation through narrow-band atmospheric windows present in the near-infrared spectral region around 1 µm, VEM will provide a global Venus coverage of >70%. The instruments SNR is on the order of 100 and allows for the detection of thermal emissions like surface rock composition, volcanic activity, water abundance and cloud formation.
We present the current VEM design and development status. The VEM instrument employs a telecentric optical system, which focuses images taken on the Venus nightside on a multilayered, narrow-band filter array. It splits the signal into 14 spectral bands, ranging from 790 nm to 1510 nm. Each filter band is imaged onto an InGaAs detector with integrated thermoelectric cooler. The optical system including detector and proximity electronics is mounted on top of an electronics box, which includes the instrument controller and power supply. An optically transmissive turn window mechanism is mounted in front of the entrance optics to protect VEM against contamination and during the aerobraking phase. In addition, a two-stage baffle prevents VEM from scattered light.
The delivery of the VEM instrument flight models is currently foreseen in 2028 for VERITAS and 2029 for EnVision. First VEM data obtained from Venus are expected in the 2030s.
How to cite: Hagelschuer, T., Pertenais, M., Walter, I., Dern, P., del Togno, S., Saeuberlich, T., Pohl, A., Rosas Ortiz, Y. M., Westerdorff, K., Kopp, E., Fitzner, A., Wendler, D., Ziemke, C., Rufini Mastropasqua, S., Loetzke, H.-G., Alemanno, G., Vandaele, A.-C., Marcqr, E., Helbert, J., and Peter, G.: Instrument design and development of the Venus Emissivity Mapper (VEM) for VERITAS and EnVision, Europlanet Science Congress 2024, Berlin, Germany, 8–13 Sep 2024, EPSC2024-351, https://doi.org/10.5194/epsc2024-351, 2024.
The first NASA spacecraft to visit and explore planet Venus since the 1990s will be the Venus Emissivity, Radio science, InSAR, Topography, And Spectroscopy mission (VERITAS) orbiter. The Venus Emissivity Mapper (VEM) onboard the spacecraft is designed for surface mapping of Venus within dedicated atmospheric spectral windows. The instrument will provide global coverage for the detection of thermal emissions like volcanic activity, surface rock composition, water abundance, cloud formation and their dynamics by observing 14 narrow filter bands in the near-infrared to short-wave infrared (NIR, SWIR) range of 790 nm to 1510 nm. An almost identical instrument will be part of ESA’s recently announced EnVision mission to Venus, the VenSpec-M in the Venus Spectroscopy Suite (VenSpec). The utilized photodetector for both missions will be an InGaAs type imaging sensor with integrated thermoelectric (TE) cooling, comprising a 640x512 pixel array with 20 µm pixel pitch.
In general, a space environmental qualification of electronic devices combines its susceptibility to radiation induced single event effects (SEE) and the evaluation of permanent degradation effects due to total ionizing dose (TID) and displacement damage dose (DDD) and the assessment of the radiation-induced noise.
After the qualification test with heavy-ions focusing on SEE performed at Radiation Effects Facility in Finland (RADEF) was completed, our imaging sensor was subject to a proton irradiation test campaign at Helmholtz-Zentrum Berlin (HZB) for combined TID and DDD testing, for the assessment of the radiation-induced noise and to investigate proton-induced SEE.
How to cite: Pohl, A., Del Togno, S., Rosas Ortiz, Y. M., Westerdorff, K., Arcos Carrasco, C., Wendler, D., Helbert, J., Peter, G., Walter, I., Dern, P., Pertenai, M., Alemanno, G., Hagelschuer, T., Saeuberlich, T., Marcq, E., and Vandaele, A.-C.: Irradiation qualification campaign of the vSWIR InGaAs imaging sensor for the VEM and VenSpec-M instruments on VERITAS and EnVision, Europlanet Science Congress 2024, Berlin, Germany, 8–13 Sep 2024, EPSC2024-1004, https://doi.org/10.5194/epsc2024-1004, 2024.
Introduction: Venus presents today a harsh environment characterized by extreme surface temperatures and pressures (approximately 740K and 95 bar, respectively), with an atmosphere predominantly composed of CO2 and N2 , along with small quantities of other gases, including sulfur compounds (such as SO2 and H2SO4). The permanent cloud cover of Venus prohibits observation of the surface with traditional imaging techniques. Fortunately, Venus’ CO2 atmosphere is transparent in small spectral windows near 1 μm allowing insights into the planet’s surface composition [1, 2]. Within the next decade, the ESA EnVision, and the NASA VERITAS and DAVINCI missions to Venus will carry instruments focused on the 1 μm spectral region to enhance our understanding of the planet's surface composition, geological history, and evolution. The Venus Emissivity Mapper (VEM) on VERITAS and VenSpec-M on EnVision [3], will play pivotal roles in mapping the surface of Venus, acquiring crucial orbital data in the NIR range. The Venus Descent Imager (VenDI) on DAVINCI, will acquire close images of the surface from beneath the clouds around 1 μm paired with emission measurements in the NIR from VISOR (Venus Imaging System for Observational Reconnaissance) [4].
Spectral laboratory work: Observations of the surface of Venus from orbit through the 1-μm windows can only be obtained on the nightside because reflected sunlight on the dayside hides any surface contribution [5]. Therefore, spectra of analog materials must be measured as emissivity, which is very challenging. In particular, thermal emission at these wavelengths is very low because it lies far below the main flank of the Planck curve for Venus surface temperatures, where the signal drops more than two orders of magnitude between 1.18 and 0.8 μm. In addition, dayside surface measurements performed by VenDI will need hemispherical reflectance measurements. To correctly interpret remote sensing data from Venus’ surface in the NIR range, laboratory measurements, replicating Venus' temperature, pressure, and chemical conditions, are essential.
Venus at PSL: At the Planetary Spectroscopy Laboratory (PSL) of the German Aerospace Center (DLR) in Berlin, we are operating a unique facility: it allows acquisition of spectra from solid and powdered materials, in air/vacuum, from low to very high T (-200° to 1000°C), over an extended spectral range (0.3 to > 100 µm) in a climate-controlled room. Currently, PSL operates three FTIR Spectrometers, featuring internal and external chambers for comprehensive spectral analyses. Emissivity, biconical, hemispherical reflectance, transmittance and Micro-FTIR reflectance measurements can all be performed.
A high-temperature emissivity setup (the Venus emissivity chamber, Figure 1), attached to a spectrometer allows routine measurements of NIR emissivity spectra of Venus' analogues at relevant Venus surface temperatures (400°C, 440°C, and 480°C) in vacuum (0.7 mbar) [6, 7]. Samples are heated in custom-made cups using a powerful induction system.
Ongoing investigations: At PSL, emissivity measurements on Venus' analogs are routinely performed with the main goal of creating increasingly complex spectral libraries for the interpretation and calibration of NIR data from Venus. The experiments investigate the emissivity response of basalt vs felsic rocks, but also of intermediate igneous compositions and mineral phases, mixtures of minerals and rock types, and potential Venus weathering products. Rock samples included in the calibration database are selected to represent a spread of compositions on the total alkali vs. silica (TAS) diagram for volcanic rocks and with a range of rock textures and grain sizes. Ongoing investigations include analysis of spectral mixtures; emissivity of weathered vs non-weathered samples; analysis on field campaign samples both on the field and in the laboratory [8, 9].
Spectral mixing effects: Using NIR emissivity spectra of mixtures at Venus' condition, we are investigating the best approaches for modeling this spectral region [10]. Measurements on mineral mixtures are used to test and simulate alteration of basalt in the Venus' atmosphere, using glass and mineral combinations that might occur within a weathered basalt, and to characterize intimate combinations of materials that might be found in the Venus regolith. Endmember minerals have been mixed with a tholeiitic basalt from Húsavík, Iceland [9] in 50% - 50% areal and intimate mixtures. The areal mixture measurements used custom-designed divided ceramic sample cups with each half containing material from one endmember. Preliminary results on the 50% - 50% mixtures show that as expected linear unmixing (LMM) [11] does not reproduce the NIR laboratory emissivity spectral behavior for some of the mixtures.
Weathering effects: Assessing how the rocks on the Venus' surface might chemically alter or weather due to surface-atmosphere interactions is crucial for interpreting data from the future missions to Venus. Joint work between PSL and the Hot Environments Laboratory (HEL) at NASA Goddard Space Flight Center (GSFC) is comparing the emissivity response of weathered vs non- weathered Venus’ surface analogs in the VenSpec-M/VEM and VenDI spectral range. For the weathering experiments, the samples are individually enclosed in the Small Venus Chamber (Lil’ VICI) of HEL (Figure 1) and heated to the average Venus surface temperature and pressure (740K & 95 bar). The samples are exposed to those conditions under a Venus simulated atmosphere (96% CO2, 4%N2, and 155ppm SO2) for a minimum of 100hrs.
Conclusions: Measurements described here are part of the VenSpec-M/VEM data calibration and validation plan, in support of the creation of several increasingly complex spectral libraries of Venus emissivity analog measurements [12]. These will be used to train machine learning algorithms for the interpretation and validation of laboratory and remote-sensed data.
References: [1] Allen D. A. et al., (1984) Nature 307, 222–224 (1984). [2] Pollack J. B. et al. (1993) Icarus 103, 1–42. [3] Helbert J. et al. 2024, this meeting. [4] Garvin et al. (2024), LPSC. [5] Mueller N. et al. (2008), J. Geophys. Res. 113. [6] Helbert et al. (2023), LPSC, Abstract #1679. [7] Maturilli at al. (2023), LPSC, Abstract #2120. [8] Adeli S. et al., 2024, this meeting [9] Garland S. et al., 2024, this meeting; [10] Dyar et al. (2023) Geological Society of America, Vol. 55, No.#6 [11] Dalton J.B. (2009), JGR, Vol. 34. [12] Alemanno G. et al. (2023), SPIE, vol. 12686, doi: 10.1117/12.2678683.
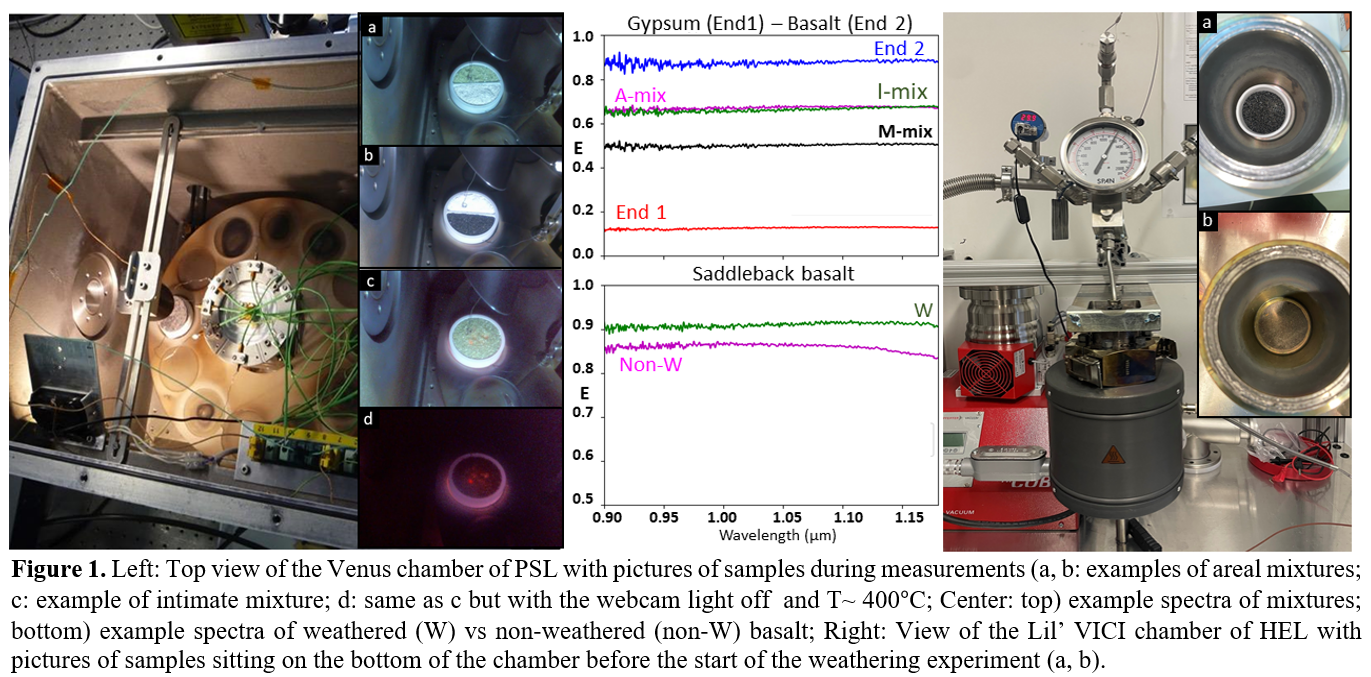
How to cite: Alemanno, G., Helbert, J., Maturilli, A., Dyar, M. D., Kohler, E., Adeli, S., Barraud, O., Van den Neucker, A., Leight, C. J., McCanta, M., Smrekar, S., Vandaele, A. C., and Marcq, E.: In the Lab with Venus: High-temperature emissivity spectroscopy for the interpretation of NIR data from Venus, Europlanet Science Congress 2024, Berlin, Germany, 8–13 Sep 2024, EPSC2024-303, https://doi.org/10.5194/epsc2024-303, 2024.
Abstract: Venus and Earth share key similarities yet differ fundamentally. It is uncertain how Venus's evolution diverged from Earth's and if its past was significantly different from its present state. Despite the interest in Venus since the dawn of planetary missions, orbiters could only use radar waves to observe the surface due to its dense and opaque atmosphere. Subsequent research revealed that Venus's atmosphere permits the transmission of electromagnetic waves emitted from its hot surface through six spectral bands centered at 0.86 μm, 0.91 μm, 0.99 μm, 1.02 μm, 1.11 μm and 1.18 μm within five atmospheric windows [1]. Advances in near-infrared imagers and laboratory measurements of the emissivity of rocks have spurred a new era of Venus exploration. In June 2021, two orbiters were announced as part of a fleet of Venus missions: NASA’s VERITAS and ESA’s EnVision. Both orbiters will be equipped with emissivity mappers designed and built by the German Aerospace Center (DLR) and aim to use these six bands to map the surface globally: Venus Emissivity Mapper (VEM) and VenSpec-M, respectively. [2, 3].
Here, we inquire into the potential of near-infrared remote sensing observations to investigate recent or active volcanic activity by employing machine learning methods for classifying surface units and change detection in preparation for future Venus missions.
Iceland serves as a primary analog for Venus in addressing the research questions of this study. This is because Iceland has a young, mostly vegetation-free surface that is formed by ongoing volcanic activity. Reykjanes Peninsula has been experiencing frequent fissure eruptions for the last 4 years. Two of these eruptions, known as the 2021 and 2022 Fagradalsfjall eruptions, resulted in the formation of a 5.01 km2 flow field called Fagradalshraun [4, 5, 6]. The study investigated the Reykjanes Peninsula, focusing on Fagradalshraun, using near-infrared bands in the spectral range of VEM of pre- and post-eruption Sentinel-2A datasets. The imagery dataset was selected based on three essential criteria that were satisfied by ESA’s Sentinel-2 constellation: Open public access, spectral bands within the range of VEM, and temporal coverage of the eruptions.
Supervised classification with the Support Vector Machines method and unsupervised classification with the K-means clustering method were performed to distinguish between geological units based on their age differences. In addition, the contributions of the Texture Analysis and the Principal Components Analysis methods for improving the classification results were tested. Then, the Normalized Difference of Time Series method was used for change detection. The results showed that despite employing a limited number of spectral bands as VEM and VenSpec-M will provide, both classification methods could distinguish between fresh basalt, weathered basalt, and aeolian cover. The accuracy of the classification methods improved with the inclusion of texture measures. Additionally, it was observed that the highest accuracy in unsupervised classification was achieved through the utilization of Principal Component Analysis. Finally, it was seen that the Normalized Difference of Time Series method detected the Fagradalshraun with an accuracy of 95%.
The results presented here underscore the capability of VEM and VenSpec-M, especially in detecting potentially active or recently active volcanism on Venus. In addition, they emphasize the contribution of studying the terrestrial analogs to enhancing the science return from future Venus missions.
References: [1] Helbert, J., et al. (2016). SPIE. [2] Helbert, J., et al. (2020). SPIE. [3] Widemann, T., et al. (2023). Space Science Reviews. [4] Adeli, S., et al. (2023). LPSC. [5] Adeli, S., et al. (2024) LPSC. [6] Pedersen, G., et al. (2022). Geophysical Research Letters.
How to cite: Domac, A., Adeli, S., Kenkmann, T., Arnold, G., and Helbert, J.: Remote Sensing Investigation of Recent Volcanic Activity on Reykjanes Peninsula, Iceland, as an Analog for Venus, Europlanet Science Congress 2024, Berlin, Germany, 8–13 Sep 2024, EPSC2024-1152, https://doi.org/10.5194/epsc2024-1152, 2024.
Venus is often referred to as the Earth’s twin due to its similar size and mass. While Venus surface is young (~750 Myr old on average), there is no direct evidence for large tectonic plates as we have on Earth. Most of the surface is thought to be basaltic in composition, although some regions, the so-called tessera, that cover about 8% of Venus’ surface have been suggested to be more felsic, potentially resembling continental crust on the Earth (Gilmore, 2015). The crustal composition carries valuable information about planetary differentiation processes and can be used to constrain the interior composition. Several mantle compositions have been proposed based on the evolution of the Solar System (condensation (e.g., Lewis, 1972) and chondrite models (Morgan and Anders, 1980)) or based on the similarities and differences between Venus and Earth (e.g., difference in mean density and similarity in radius (BVSP, 1981)). However, it is yet to be assessed if these mantle compositions can reproduce the composition of Venus surface rocks.
During the 1980’s, three landers (Venera 13 and 14, and Vega 2) successfully completed missions on the surface of Venus, collecting and analysing surface rock material (Surkov et al., 1984, 1986). The surface rock compositions were determined using X-ray fluorescence and then compared to a suite of Earth rocks analysed in the same way. The results show that Venus’ surface is best described as consisting of alkaline basalts (Venera 13) and tholeiitic basalts (Venera 14 and Vega 2) (Fegley, 2014). However, the data compiled from these missions contain large uncertainties and several elements, such as Na, have not been measured (Treiman, 2007). Although these analyses are limited, they remain the most accessible data we have about Venus’ surface, as there have been no further surface-based missions to Venus and there are no known Venus meteorites.
A combination of thermodynamic modelling with the Venera and Vega lander data can be used to constrain the composition of Venus’ mantle. Perple_X allows for primary melt compositions to be calculated using a combination of thermodynamic data and Gibbs energy minimisation (Connolly, 2005). Hence, in this study, proposed Venus mantle compositions (BVSP, 1981) and a terrestrial mantle composition (Davis et al., 2009) will be used to generate partial melt compositions in Perple_X (Connolly, 1990, 2005, 2009) in conjunction with the internally consistent database described in Holland, Green, and Powell (2018, 2022). These partial melt compositions will be compared with the Venera 14 and Vega 2 lander data (Treiman, 2007) with a focus on the abundance of major elements SiO2, Al2O3, FeO, MgO, and CaO. Further investigations will evaluate if fractional crystallisation may have played a role in the generation of Venera 14 and Vega 2 rocks.
Our models are a necessary step towards understanding the interior of Venus, its magmatic differentiation, and the link to surface composition. Combined with thermal evolution models (Herrera et al., this meeting), our work will provide a useful basis for the interpretation of future measurements of VERITAS and EnVision missions, that aim to characterize the types of rocks and minerals on Venus’ surface with unprecedented detail.
References: Basaltic Volcanism Study Project, 1981, Basaltic volcanism on the terrestrial planets: New York, Pergamon, 286 p.
Connolly, J., 1990, Multivariable phase diagrams; an algorithm based on generalized thermodynamics: AJS, v. 290, no. 6, p. 666–718, doi: 10.2475/ajs.290.6.666.
Connolly, J., 2005, Computation of phase equilibria by linear programming: A tool for geodynamic modeling and its application to subduction zone decarbonation: EPSL, v. 236, 1-2, p. 524–541, doi: 10.1016/j.epsl.2005.04.033.
Connolly, J., 2009, The geodynamic equation of state: What and how: Geochem, Geophys, v. 10, no. 10, doi: 10.1029/2009GC002540.
Davis, F.A., et al., 2009, The composition of KLB-1 peridotite: American Mineralogist, v. 94, no. 1, p. 176–180, doi: 10.2138/am.2009.2984.
Fegley, B., 2014, 2.7 - Venus, in Heinrich D. Holland, Karl K. Turekian, eds., Treatise on Geochemistry (Second Edition), Second Edition ed.: Oxford, Elsevier, p. 127–148.
Gilmore, M.S., et al., 2015, “VIRTIS emissivity of Alpha Regio, Venus, with implications for tessera composition.” In: Icarus 254, pp. 350–361, doi: 10.1016/j.icarus.2015.04.008.
Holland, T.J.B., et al., 2018, Melting of Peridotites through to Granites: A Simple Thermodynamic Model in the System KNCFMASHTOCr: Journal of Petrology, v. 59, no. 5, p. 881–900, doi: 10.1093/petrology/egy048.
Holland, T.J.B., et al., 2022, A thermodynamic model for feldspars in KAlSi 3 O 8 −NaAlSi 3 O 8 −CaAl 2 Si 2 O 8 for mineral equilibrium calculations: Journal of Metamorphic Geology, v. 40, no. 4, p. 587–600, doi: 10.1111/jmg.12639.
Lewis, J.S., 1972, Metal/silicate fractionation in the solar system: EPSL, v. 15, no. 3, p. 286–290, doi: 10.1016/0012-821X(72)90174-4.
Morgan, J.W., and Anders, E., 1980, Chemical composition of Earth, Venus, and Mercury: PNAS, v. 77, no. 12, p. 6973–6977, doi: 10.1073/pnas.77.12.6973.
Surkov, Y.A., et al., 1984, New data on the composition, structure, and properties of Venus rock obtained by Venera 13 and Venera 14: LPSC, v. 89, B393-B402, doi: 10.1029/JB089iS02p0B393.
Surkov, Y.A., et al., 1986, Venus Rock Composition at the VEGA 2 Landing Site: LPSC, v. 91, 215-E218.
Treiman, A.H., 2007, Geochemistry of Venus' Surface: Current limitations as future opportunities, in Esposito, L.W., et al., eds., Exploring Venus as a Terrestrial Planet: Washington, D. C., American Geophysical Union. Geophysical Monograph Series, p. 7–22.
How to cite: Jennings, L., Collinet, M., Plesa, A.-C., Herrera, C., Maia, J., and Klemme, S.: Determining the mantle composition of Venus: a preliminary investigation using thermodynamic modelling, Europlanet Science Congress 2024, Berlin, Germany, 8–13 Sep 2024, EPSC2024-599, https://doi.org/10.5194/epsc2024-599, 2024.
Venus is like Earth in terms of size, density, and composition. However, both bodies evolved so dramatically differently that Venus is characterized by an uninhabitable, run-away greenhouse atmosphere, in marked contrast to Earth's favorable habitable conditions. Understanding the extreme divergence of Venus and Earth’s evolution is of great importance for understanding our early Earth, climate change as well as for studying the habitability of Earth- and Venus-like exoplanets. The key role of Venus in these fields is reflected by at least three major explorative missions scheduled in the next decade by NASA and/or ESA to study Venus in unprecedented detail.
Interpretation of the latter mission results requires an extensive geochemical understanding of Venus and how volatile species, such as CO2, SO2 and H2O, are distributed (Fig. 1). This larger cycle includes surface weathering processes, (recent) volcanism, and chemical reactions within the Venusian clouds. Such models rely heavily on experimental data. However, conducting systematic experiments under corrosive, high pressure-temperature conditions directly relevant to Venus’ surface and lower atmosphere is very challenging. Thus, many aspects related to the chemistry Venus’ interior, surface and atmosphere remain poorly constrained. This includes the nature and degree of surface weathering by the corrosive atmosphere, the character of (past) volcanism, the origin of particular surface features and reactions within the sulfuric acid clouds.
Figure 1: The Venus Simulation Laboratory (VSL) is aimed to experimentally and numerically constrain volatile element fluxes between Venus’ interior, surface and atmosphere
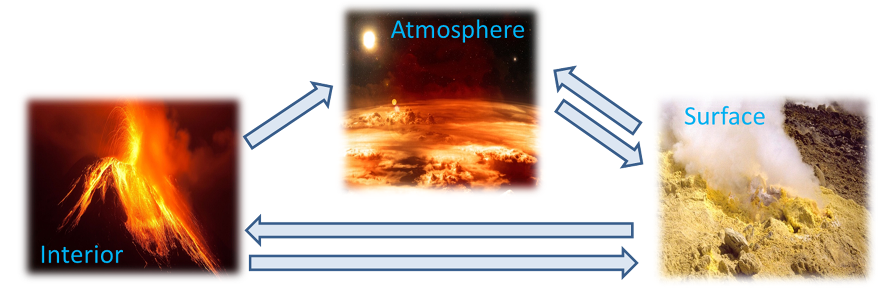
To study the Venus interior, surface and atmosphere in detail, a new lab is therefore being built at the Planetary Exploration Section, Faculty of Aerospace Engineering, TU Delft, using the ERC Starting Grant ‘’VenusVolAtmos’’’. The lab will initially consist of the following;
- A Thermogravimetric Analysis – Differential Scanning Calorimetry (TGA-DSC) apparatus with which chemical weathering of the Venusian surface can be studied in situ at the conditions directly relevant to Venus’ lowest atmosphere, while using a controlled, corrosive atmosphere.
- A piston cylinder press, with which subsurface magmatism on Venus can be simulated up to a depth of 100 km
- A gas mixing furnace, with which magma degassing in the earlier history of Venus can be studied.
More funding is currently requested that would be used for purchasing a high-pressure furnace, with which volcanism can be studied under the present-day dense atmosphere and more controlled reaction chambers, to accomdate multiple experiments at a given time. The specific research questions, progress and experimental goals will be presented at the meeting.
Acknowledgements: This work is supported by the ERC Starting Grant ‘’VenusVolAtmos’’ awarded to E.S.S.
How to cite: Steenstra, E. S.: Probing Venus’ enigmatic evolution with the new Venus Simulation Laboratory at TU Delft, Europlanet Science Congress 2024, Berlin, Germany, 8–13 Sep 2024, EPSC2024-388, https://doi.org/10.5194/epsc2024-388, 2024.
Venus represents a terrestrial planet similar to Earth in size and mass, but its evolution has been different enough to lead to the formation of a different planetary environment. Understanding the interior processes that shape Venus’ surface, and their present-day activity, is one of the fundamental tasks for the next decade(s) of Venus science. While evidence has been found for present-day volcanic activity on Venus, recent work also suggests that seismic activity can be expected on the planet [1]. Here, we shortlist and investigate areas that can provide key insights on different contexts where seismic activity could take place at present: Ishtar, Thetis, Lada, Atla, Beta, and Artemis corona. We will herein describe these regions and reasons for their inferred seismic activity (Figure 1). Moreover, we identify terrestrial analogues on Earth which may provide further insights into their seismic characteristics.
Ishtar Terra
Ishtar Terra, the second-largest highland region on Venus, spans approximately 4,000,000 km². It features Lakshmi Planum, an interior plateau surrounded by towering mountain belts, including Maxwell Montess - the highest point on Venus inferred to also have the thickest crust - and outlying tesserae. This elevated region is underpinned by a deep crustal root. Structural units within Ishtar Terra exhibit evidence of both vertical and horizontal crustal movements, indicative of crustal shortening due to lithospheric thickening [2]. Ishtar Terra presents an intriguing prospect for seismic activity. We expect seismic activity to be the deepest due to the suggested thickened cold crustal layer [3], with more distributed directionality compared to regions like Thetis Regio (see below).
Thetis Regio
Thetis Regio, an uplifted region 3 km above mean planet radius, constitutes the eastern part of Aphrodite Terra, the largest highland on Venus. Thetis Regio is composed primarily of tessera terrain: rugged and highly deformed terrain displaying different trends of parallel ridges and troughs. Given its resemblance to a Canadian shield-like tectonic scenario with increased heightened seismic activity at the edges, we infer the potential for seismic activity on the margins of Thetis Regio.
Atla Regio
Atla Regio, located within the BAT (Beta-Atla-Themis) region, hosts some of the most recent suggested volcanic and rifting activity on Venus. It features a distinct four-armed 'triple-junction' rift system, numerous large volcanic centers, and associated coronae, exhibiting topographic highs and gravity lows akin to terrestrial Large Igneous Provinces linked to active mantle plumes. Notable volcanic features include Maat Mons, the tallest volcano on Venus, for which the clearest evidence of ongoing volcanic activity has been presented [4]. Atla Regio commands attention with its intense volcanic activity alongside active fissure eruptions. Moreover, situated proximal to observable rifting and featuring “African rift-like” tectonic characteristics, Atla holds geological significance. Foreseen seismogenic thickness implies shallow seismic activity [5].
Lada Terra
Lada Terra, located at high southern latitudes on Venus, features elevated topography with numerous coronae, volcanoes, extensional belts, and deformed terrains. The main highland is dominated by the large Quetzalpetlatl corona and two massive intersecting rift zones. Long-wavelength gravity anomalies suggest a deep thermal upwelling underneath Lada Terra at present-day, yet it was not previously categorized as a “hot spot” [6]. Lada Terra might indeed represent a precursor stage of advanced rifting.
Artemis corona
Artemis is found on the southern side of the Aphrodite Terra and is by far the largest corona on Venus (26000 km diameter), and in fact one of the largest circular structures on a rocky planet in our solar system. Artemis' interior is depressed relative to the surrounding plains and features a large rift-like chasmata. The SE margin of Artemis hosts a deep, arcuate trough surrounded by compressional arcs which rise above the plains. The topographic features of the Artemis rim have been interpreted as resulting from plume-induced retreating subduction, consistent with several geodynamic studies [7,8].
Beta Regio
Beta Regio is considered a "rift-dominated" topographic rise similar to Atla Regio. It is intersected by the prominent north-to-south Devana Chasma. Geological mapping indicates early uplift, rifting, and volcanism attributed to a hot mantle diapir, consistent with the related positive geoid anomaly. We identify the region as active, yet possibly with a lower seismicity than above-mentioned regions, more akin to a Hawaiian-type hotspot. This area serves as a valuable reference for comparing expected activity levels with other target regions.
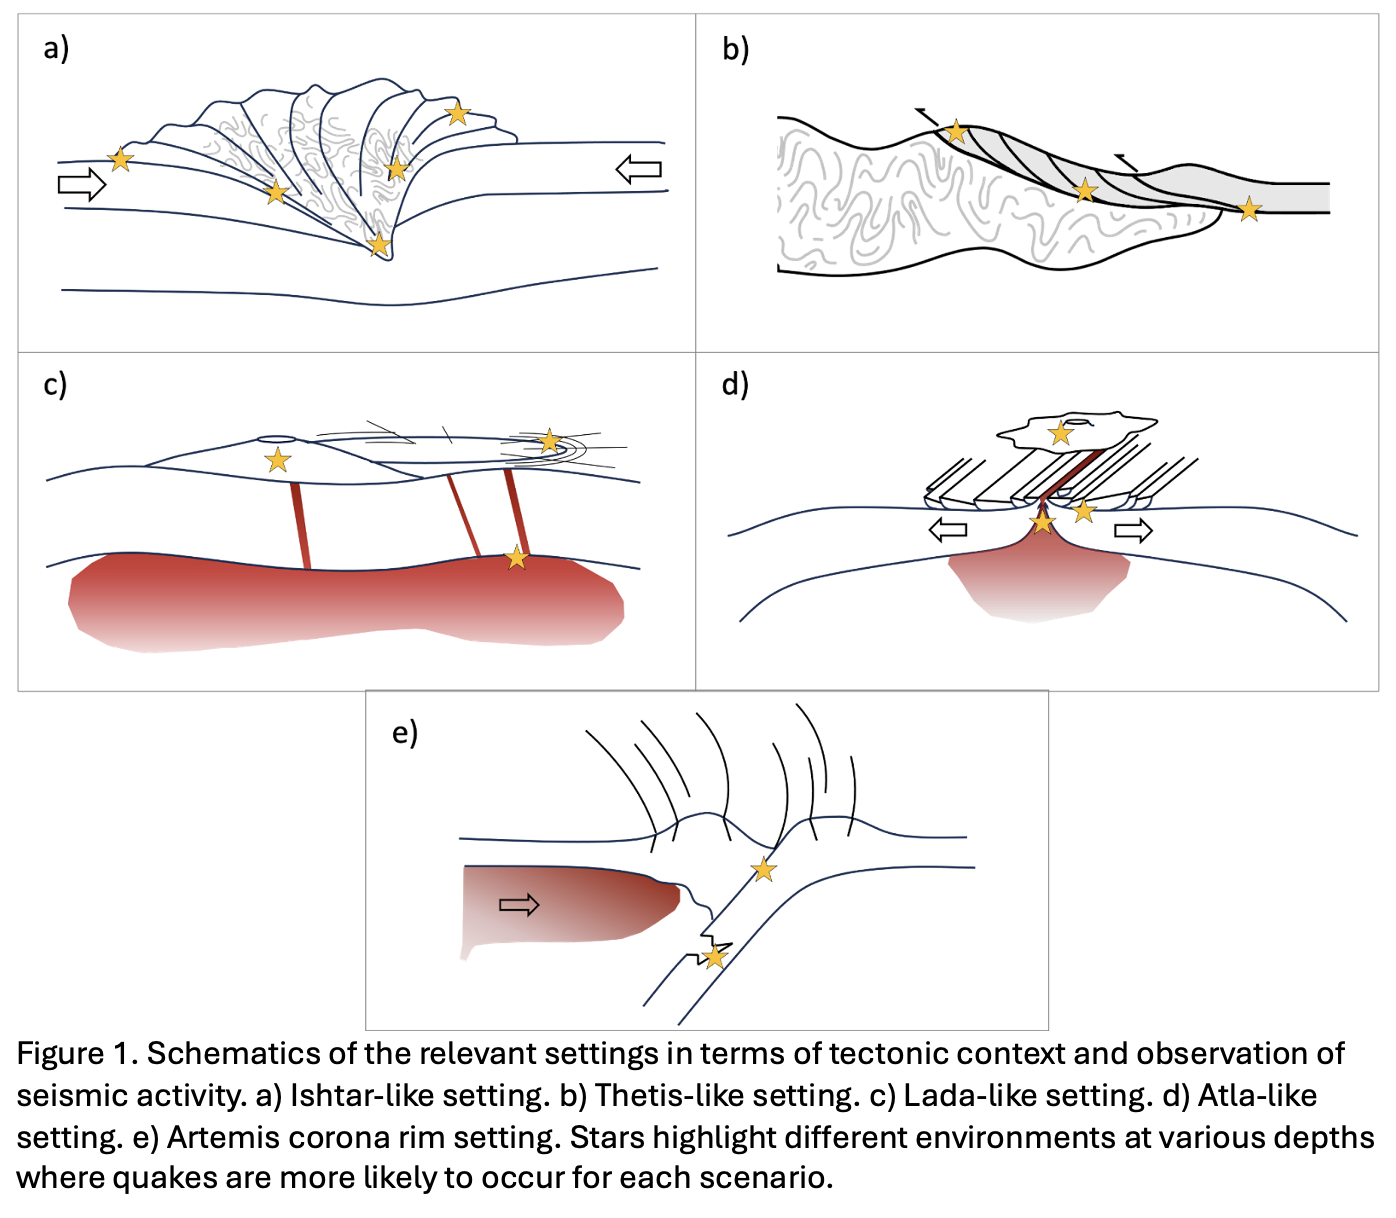
In the context of forthcoming Venus missions like VERITAS and EnVision, identifying potential areas of seismic activity on Venus can yield highly valuable insights in addition to the missions’ science goals. These missions aim to unravel the mysteries of Venus's geology and surface processes, shedding light on its tectonic history and volcanic activity. VERITAS (Venus Emissivity, Radio Science, InSAR, Topography, and Spectroscopy) will, amongst other data, provide detailed maps of Venus’ surface and study its geology using e.g. radar and infrared imaging [9]. EnVision aims to investigate Venus's atmosphere, surface, and interior structure to understand its geological evolution [10]. By pinpointing these target regions, this study provides crucial information for mission planning and target prioritization. Moreover, these insights will be valuable for future mission concepts that aim to detect seismic activity on Venus.
References
[1] van Zelst, I., et al., (2024), EPSC2024 [2] Vorder Bruegge, R.,W., & Head, J.,W., (1991) Geology, 19:885–888. [3] Hansen V.L. & Phillips R.J., (1995) Geology, 23, 292–296. [4] Herrick RR, & Hensley S (2023) Science 379, 1205–1208. [5] Maia, J., et al., (2024), EPSC2024 [6] Smrekar, S. & Stofan. E., (1999), Icarus, 139, 100-115. [7] Davaille, A. et al. (2017), Nat. Geosc. 10, 349-355 [8] Gülcher, A. J. P., et al. (2020), Nat. Geosc., 13, 547-554 [9] Freeman, A., et al. (2016). pp. 1– 11). IEEE. [10] Ghail, R. et al., (2021) ESA Assessment Study Report.
Acknowledgement
This research was supported by the International Space Science Institute (ISSI) in Bern, Switzerland through ISSI International Team project #566: Seismicity on Venus: Prediction & Detection led by Iris van Zelst. Some authors thank the European Union – NextGenerationEU and the 2023 STARS Grants@Unipd programme – “HECATE” support.
How to cite: De Toffoli, B., Ghail, R., Gülcher, A., Horleston, A., Maia, J., van Zelst, I., Plesa, A.-C., Garcia, R., Klaasen, S., Lefevre, M., Näsholm, S. P., Smolinski, K., and Solberg, C.: Potential Seismically Active Target Regions on Venus, Europlanet Science Congress 2024, Berlin, Germany, 8–13 Sep 2024, EPSC2024-786, https://doi.org/10.5194/epsc2024-786, 2024.
The crustal plateaus on Venus are highlands characterized by strongly deformed terrains, called tessera, and correspond to the stratigraphically oldest features on the planet [1]. Investigations of the gravity and topography signatures of the plateaus show that they are compensated by thickening of the crust and are consistent with being in an Airy isostasy state [2,3]. Recent crustal thickness estimates indicate that the base of the crust under plateaus can reach depths larger than 50 km [4], which correspond to pressures large enough to generate eclogite. A key property of eclogite is that it has a density larger than the surrounding mantle. This negatively buoyant material causes delamination and recycling of the crust. Hence, the depth of eclogite formation is commonly used to define the maximum possible crustal thickness of planets, and of Venus in particular [e.g. 5].
Nevertheless, the process of delamination of high-density eclogite under thickened crustal regions has not been numerically studied in detail using thermodynamic models that calculate the densities consistent with Venusian petrology and basalt-to-eclogite phase change. In this study, we combine depth-dependent crustal density profiles obtained with Perple_X considering the surface composition constrained by Vega 2 (see [6] for details) and the finite-element software COMSOL multiphysics that couples heat transfer, creeping flow, and the level set modules to investigate the delamination process. We focus in particular on the Western Ovda Regio, as this process could be relevant for the crustal structure suggested at this location by gravity and topography studies [5].
Western Ovda Regio, shown in Figure 1, has a unique topographic signature among all crustal plateaus. It presents a high-elevation rim, reaching up to 2 km altitude in the eastern part, and a collapsed center heavily embayed by the volcanic plains. The processes that caused this central collapse is not well-understood and cannot be explained by viscous relaxation alone [e.g., 7, 8]. In this study we investigate if Western Ovda could have experienced delamination of a high-density eclogitic material, which is thought to have formed at the base of the plateau as a consequence of the basalt-to-eclogite phase transition.
Our first results show that generating negatively buoyant eclogitic crust is not enough to trigger recycling. If the temperature is cold, this eclogitic crust would be trapped in the so-called stagnant lid, an immobile layer that forms as a consequence of the temperature-dependence of the viscosity. When considering a linear thermal gradient of 5 K/km throughout the crust, negatively buoyant material can be found below 40 km depth, but this material is only recycled if the crust reaches about 100 km thickness. On the other hand, if the temperature is high enough, (i.e., about 1200K), the material is able to flow, and the deeper crustal layer could delaminate. For a thermal gradient of 10 K/km, the stagnant lid is thin enough to allow for high density materials that form at depths of around 60 km to delaminate. In conclusion, our results show a delicate interplay between the thickness of the crust, the thermal conditions of the lithosphere and the density contrast between the crust and mantle. In scenarios where delamination occurs, the models indicate that the high surface topography indeed collapses, as we expected. Next steps in this study will include testing a wider range of model setups, in particular testing different lithospheric thermal gradients. In addition, we will extend our analysis by estimating the gravity signature from these models and comparing them with the observations.
References
[1] Ivanov and Head, 2011. PSS; [2] Grimm, 1994. Icarus; [3] Kucinskas and Turcotte, 1994. Icarus; [4] Maia and Wieczorek, 2022. JGR: Planets; [5] James et al., 2013. JGR: Planets; [6] Collinet et al., 2024. EPSC 2024 (this meeting); [7] Nunes et al., 2004. JGR; [8] Nunes and Phillips, 2007. JGR
How to cite: Maia, J., Ding, M., Collinet, M., and Plesa, A.-C.: The potential for crustal delamination at the base of crustal plateaus on Venus: The case of Western Ovda Regio, Europlanet Science Congress 2024, Berlin, Germany, 8–13 Sep 2024, EPSC2024-1230, https://doi.org/10.5194/epsc2024-1230, 2024.
Venus’ rotation is the slowest of all planetary objects in the solar system and is in the retrograde direction. It is commonly admitted that such a rotation state results from the balance between the torques created by solid and atmospheric tides effects (Dobrovolskis et Ingersoll, 1980; Correia et Laskar, 2001, 2003; Revol et al., 2023). The internal viscous friction associated with gravitational tides drives the planet into synchronization (i.e. deceleration toward a tidally locked rotation) while the bulge due to atmospheric thermal tides tends to accelerate the planet out of this synchronization (Correia et Laskar, 2001; Leconte et al., 2015).
The atmospheric thermal perturbations arise from the contrast in atmospheric temperature distribution caused by the day-night cycle. This results in a transfer of energy toward cooler regions through atmospheric circulation, leading to variations in atmospheric pressure with high pressures (or density) concentrated in the cooler regions. Because the heat peak of the atmosphere created by the solar insolation occurs in the early afternoon, the atmospheric pressure bulge forms with a delay between its main axis and the Venus-Sun direction (Gold et Soter, 1969; Dobrovolskis et Ingersoll, 1980). This lag creates an atmospheric thermal torque, due to the gravitational attraction of the Sun, which tends to push Venus’ rotation out of synchronization.
Using atmospheric pressure simulations, we showed in a previous study (Musseau et al., submitted) that ignoring the topography when evaluating the thermal tides (which was assumed in previous studies (Leconte et al., 2015; Auclair-Desrotour et al., 2017; Revol et al., 2023)) significantly underestimates the amplitude of the atmospheric torque and creates less pronounced variations throughout a Venusian day. Moreover, from the balance between the atmospheric torque and the solid interior torque, we assess that the viscosity of Venus’ deep mantle should range between 3×10²⁰ and 6×10²¹ Pa.s, about one order of magnitude smaller than Earth’s deep mantle. This estimate relies on the atmospheric torque which has been computed for present-day topography and rotation state.
As shown by Correia et Laskar (2001) and, more recently, by Revol et al. (2023), the rotation state (obliquity and rotation rate) may have changed in a recent past, and may still be evolving. Any change in rotation state may affect the strength of the atmospheric tides and hence in return affect the rotation rate. Here, we propose to evaluate the strength of the atmospheric tides using GCM simulations performed with different rotation configurations. First GCM simulations and implications for the rotation evolution will be presented and discussed during the conference.
References:
Auclair-Desrotour, P., J. Laskar, S. Mathis et A. C. M. Correia (2017). “The Rotation of Planets Hosting Atmospheric Tides: From Venus to Habitable Super-Earths”. Astronomy & Astrophysics 603, A108.
Correia, A. C. et J. Laskar (2001). “The Four Final Rotation States of Venus”. Nature 411(6839), 767–770.
Correia, A. C. et J. Laskar (2003). “Different Tidal Torques on a Planet with a Dense Atmosphere and Consequences to the Spin Dynamics”. Journal of Geophysical Research: Planets 108(E11), 2003JE002059.
Dobrovolskis, A. R. et A. P. Ingersoll (1980). “Atmospheric Tides and the Rotation of Venus I. Tidal Theory and the Balance of Torques”. Icarus 41(1), 1–17.
Gold, T. et S. Soter (1969). “Atmospheric Tides and the Resonant Rotation of Venus”. Icarus 11(3), 356–366.
Leconte, J., H. Wu, K. Menou et N. Murray (2015). “Asynchronous Rotation of Earth-mass Planets in the Habitable Zone of Lower-Mass Stars”. Science 347(6222).
Musseau, Y., G. Tobie, C. Dumoulin, C. Gillmann, A. Revol et E. Bolmont (submitted). “Viscosity of Venus’ mantle as inferred from its rotational state”. JGR planet.
Revol, A., E. Bolmont, G. Tobie, C. Dumoulin, Y. Musseau, S. Mathis, A. Strugarek et A. Brun (2023). “Spin Evolution of Venus-like Planets Subjected to Gravitational and Thermal Tides”. Astronomy & Astrophysics.
How to cite: Musseau, Y., Dumoulin, C., Tobie, G., and Lebonnois, S.: Investigating the atmospheric thermal tides on Venus and their consequences for its rotation state., Europlanet Science Congress 2024, Berlin, Germany, 8–13 Sep 2024, EPSC2024-766, https://doi.org/10.5194/epsc2024-766, 2024.
Venus is similar to Earth in terms of mass and size and is sometimes also referred to as “Earth’s twin”. Nevertheless, there are some significant differences between the two planets such as their atmospheric mass and composition, geophysical activity, rotation, and magnetic field. The origins for the differences between the two planets are still unknown. Since giant impacts are expected to be common in the early evolution of the solar system, it is likely that Venus also experienced an impact.
Giant impacts on Venus have likely played an important role in shaping its geological and atmospheric evolution, impacting factors such as volcanic activity and surface composition. Investigating such impact events could provide an improved understanding of Venus' present-day characteristics. Furthermore, contrasting the consequences of impacts on Venus and on other terrestrial planets like Earth and Mars provides a comparative framework for analyzing their histories, and valuable insights into the underlying factors that influence the evolution and the internal structure of terrestrial planets.
In this research we explore a range of possible impacts on Venus and investigate their effects on Venus evolution. We present results from ultra-high resolution simulations of giant impacts on Venus using Smoothed Particle Hydrodynamics (SPH). Venus’ interior pre-impact is assumed to consist of an iron core (30% of Venus’ mass) and a forsterite mantle (70% of Venus’ mass), where the planetary mass is set to be Venus’ current mass.
We also consider models where Venus has a primordial atmosphere with a mass of 1% of Venus’ mass. We allow for different atmospheric compositions including: hydrogen, hydrogen-helium, water, CO and CO2. For the impactors we assume differentiated bodies with masses ranging from 10-4 – 0.1 Earth masses. Impact velocities vary between 10 and 30 km/s, which translates to roughly 1 - 3 times Venus’ escape velocity. We also consider different impact geometries (head-on and oblique) and a range of pre-impact rotation rates for Venus.
We show how different impact conditions lead to different post-impact composition, thermal profiles and rotation periods. We also quantify atmospheric losses caused by the impacts in various scenarios, most relevant for highly energetic collisions.
Finally, we use the impact results to infer the post-impact thermal profile of Venus and explore how it affects Venus’ long-term thermal evolution and current-state internal structure. We then identify the impact scenarios that are most consistent with Venus’ observed properties. Our research clearly demonstrates that an exploration of giant impacts on Venus can provide valuable insights into the fundamental processes shaping terrestrial planets. This understanding not only enhances our comprehension of planetary evolution within our solar system but also extends to terrestrial exoplanets.
How to cite: Bussmann, M., Helled, R., Paul Tackley, P., Gillmann, C., Reinhardt, C., and Stadel, J.: Giant Impacts on Venus , Europlanet Science Congress 2024, Berlin, Germany, 8–13 Sep 2024, EPSC2024-453, https://doi.org/10.5194/epsc2024-453, 2024.
Although similar to the Earth in size and mass, Venus represents today one of the most extreme places in the Solar System having a dense CO2 atmosphere and a young surface dominated by volcanic features at all spatial scales (Hahn & Byrne, 2023). While the present-day interior structure and geodynamic regime is still debated, models agree that magmatism played a major role during the entire thermal history (Rolf et al., 2022).
Limited constraints for the deep interior of Venus are available from measurements of the tidal Love number k2, which is sensitive to the size and state of the core, and moment of inertia factor (MoIF), which describes the distribution of mass in the interior. While the tidal Love number k2 = 0.295±0.066 has been determined from Magellan and Pioneer Venus Orbiter tracking data (Konopliv & Yoder, 1996), the phase lag of the deformation, whose value is particularly sensitive to the thermal state of the interior, has not yet been measured. A rough estimate of the core size of 3500 km with large (>500 km) uncertainties comes from the MoIF that was determined from Earth-based radar observations (Margot et al., 2021). The large uncertainties on the data available for the Venus interior make it thus difficult to constrain the size and state of the core and the composition and viscosity of the mantle (Dumoulin et al., 2017).
Early studies that used Pioneer Venus and later Magellan data showed that Venus has a higher correlation of gravity and topography for long wavelengths and a globally large apparent depth of compensation (Sjogren et al., 1980). Recently, the study by Maia et al., (2023) used the long wavelength spectrum of the gravity and topography acquired by Magellan to constrain the interior viscosity of Venus. The dynamic geoid and topography estimates for Venus confirm that a viscosity jump at 700 km depth (corresponding to ringwoodite-bridgmanite phase transition) is inconsistent with the observations, while a 250-km-thick low-viscosity layer at the base of the lithosphere is favored by the data (Maia et al. 2023).
In this study, we use the mantle convection code GAIA (Hüttig et al., 2013) to compute the full thermal evolution of Venus. GAIA solves numerically the conservation equations of mass, linear momentum, and thermal energy to obtain the spatial and temporal distribution of the temperature field in the interior of a planetary body. Our models use a pressure- and temperature-dependent viscosity, and allow for surface mobilization. Our models are compatible with the so-called plutonic squishy lid regime (Lourenco et al., 2020), in which magmatic intrusions can considerably affect the thermal state of the lithosphere (Herrera et al., this meeting). The thermal expansivity and conductivity in our models are pressure- and temperature-dependent and use the parametrizations described in Tosi et al., (2013). Furthermore, we consider the effects of core cooling and radioactive decay as appropriate for thermal evolution modeling. In our models we vary the size of the core and the viscosity of the mantle. For the viscosity we test reference values of 1e20, 1e21, and 1e22 Pa s, and vary its increase with depth over several orders of magnitude. We investigate models with a core radius between 3025 km and 4000 km. Based on the thermal state and temperature variations, viscosity structure, and core size from our models we calculate the tidal deformation, the MoIF, and evaluate the dynamic topography and geoid signatures.
Our models indicate that intrusive melt can lead to local surface mobilization (Fig. 1a). The increase of viscosity with depth should be less than two orders of magnitude, since larger values would significantly decrease the spectral correlation and admittance obtained in our models, at odds with observations (Fig. 1b). Models with a core radius >4000 km are incompatible with current estimates of k2, but all models are compatible with current MoIF values (Fig. 1c). Furthermore, we obtain a lower tidal quality factor for Venus compared to the Earth, which suggests a hotter interior.
Future measurements of the NASA VERITAS (Smrekar et al., 2022) and ESA EnVision (Straume-Lindner et al., 2022) missions will provide unprecedented information to address the interior structure and thermal history of Venus, and will help to refine models of the interior evolution.
References:
Hahn, R. M., & Byrne, P. K. (2023). A morphological and spatial analysis of volcanoes on Venus. JGR: Planets.
Herrera, C., Plesa A.-C., Maia, J., Jennings, L., & Klemme, S. (2024). Effects of intrusive magmatism on the thermal evolution and present-day state of Venus. EPSC 2024.
Hüttig, C., Tosi, N., & Moore, W. B. (2013). An improved formulation of the incompressible Navier–Stokes equations with variable viscosity. PEPI.
Konopliv, A. S., & Yoder, C. F. (1996). Venusian k2 tidal Love number from Magellan and PVO tracking data. GRL.
Lourenço, D. L., Rozel, A. B., Ballmer, M. D., & Tackley, P. J. (2020). Plutonic-squishy lid: A new global tectonic regime generated by intrusive magmatism on Earth-like planets. Geochemistry, Geophysics, Geosystems.
Maia, J. S., Wieczorek, M. A., & Plesa, A. C. (2023). The mantle viscosity structure of Venus. GRL.
Margot, J. L., Campbell, D. B., Giorgini, J. D., Jao, J. S., Snedeker, L. G., Ghigo, F. D., & Bonsall, A. (2021). Spin state and moment of inertia of Venus. Nature Astronomy.
Rolf, T., Weller, M., Gülcher, A., Byrne, P., O’Rourke, J. G., Herrick, R., ... & Smrekar, S. (2022). Dynamics and evolution of Venus’ mantle through time. Space Science Reviews.
Sjogren, W. L., Phillips, R. J., Birkeland, P. W., & Wimberly, R. N. (1980). Gravity anomalies on Venus. JGR: Space Physics.
Smrekar, S., Hensley, S., Nybakken, R., Wallace, M. S., Perkovic-Martin, D., You, T. H., ... & Mazarico, E. (2022, March). VERITAS (Venus emissivity, radio science, InSAR, topography, and spectroscopy): a discovery mission. In 2022 IEEE aerospace conference (AERO) IEEE.
Straume-Lindner, A.-G., Titov, D., Ocampo Uria, A. C., & Voirin, T. (2022). The EnVision Mission to Venus. 44th COSPAR Scientific Assembly.
Tosi, N., Yuen, D. A., de Koker, N., & Wentzcovitch, R. M. (2013). Mantle dynamics with pressure-and temperature-dependent thermal expansivity and conductivity. PEPI.
How to cite: Plesa, A.-C., Maia, J., Walterová, M., and Breuer, D.: The present-day interior of Venus as predicted by global geodynamical models and constrained by observations, Europlanet Science Congress 2024, Berlin, Germany, 8–13 Sep 2024, EPSC2024-1350, https://doi.org/10.5194/epsc2024-1350, 2024.
HDO is an isotopic form of water that can provide clues about the history and evolution of water. By comparing the ratio of HDO to H2O on Venus with that of other planets or comets that have similar origins, we can estimate how much water Venus received during its formation and early evolution. The Venus Global Climate Model (VGCM) developed in several laboratories (LMD, LATMOS) of Institute Pierre-Simon Laplace (IPSL, in Paris area) can simulate the dynamics of the Venusian atmosphere. However, VGCM does not include the influence of HDO. In this work, we dedicate to implement HDO as a new tracer into the model to investigate the influence of HDO fractionation and spatial and temporal distribution. Two new tracers are added, HDO(g) and HDO(l), to account for both the vaporous phase and the condensed phase. As an isotope of water, HDO participates in many chemical and physical processes where water is involved. Therefore, we implement HDO(g) and HDO(l) in every routine where H2O(g) and H2O(l) are present except for photochemical processes. The initial value for HDO is set to 10-2 times the value of H2O. HDO(l) is then calculated by using the equation of the isotopic fractionation of water during condensation. The results indicate that when there is no isotopic fractionation, HDO(g) and HDO(l) are exact copies of H2O(g) and H2O(l).
How to cite: Li, D. and Montmessin, F.: HDO Modeling in a 3D Climate Model of Venus, Europlanet Science Congress 2024, Berlin, Germany, 8–13 Sep 2024, EPSC2024-571, https://doi.org/10.5194/epsc2024-571, 2024.
Venus is completely shrouded by optically thick clouds of sulfuric acid that are located between ~47 and 70 km. The cloud tops have been investigated through imaging, spectroscopy, and polarimetry in a broad range of wavelengths, from UV to mid-infrared, as well as in-situ measurements. For example, Ignatiev et al. (2009) studied the cloud top altitude from the depth of CO2 absorption band at 1.6 μm acquired by VIRTIS onboard Venus Express. They found that the cloud tops decreased poleward of 50° and this depression coincided with the eye of the polar vortex.
Sato et al. (2020) described the dayside cloud top structure of Venus as retrieved from 93 images acquired at a wide variety of solar phase angles (0–120°) using the 2.02-μm channel of the 2-μm camera (IR2) onboard the Venus orbiter, Akatsuki, from April 4 to May 25, 2016 (Orbit #12–16). Since the 2.02-μm channel is located in a CO2 absorption band, the sunlight reflected from Venus allowed us to determine the cloud top altitude corresponding to a unit aerosol optical depth at 2.02 μm. First, the observed solar phase angle dependence and the center-to-limb variation of the reflected sunlight in the low-latitude region (30°S–30°N) were used to construct a spatially averaged cloud top structure characterized by cloud top altitude zc, Mode 2 particle radius rg,2, and cloud scale height H, which were 70.4 km, 1.06 μm, and 5.3 km, respectively. Second, cloud top altitudes at individual locations were retrieved on a pixel-by-pixel basis with an assumption that rg,2 and H were uniform for the entire planet. The latitudinal structure of the cloud top altitude was symmetric with respect to the equator. The average cloud top altitude was 70.5 km in the equatorial region and showed a gradual decrease of ~2 km by the 45° latitude. It rapidly dropped at latitudes of 50–60° and reached 61 km in latitudes of 70–75°.
In this study, we focused on investigating the solar phase angle dependence of the reflected sunlight in the low-latitude region (30°S–30°N) using the complete set of 2.02-μm images: a total of 374 images taken from December 11, 2015, to October 29, 2016 were selected by carefully excluding those with saturated pixels and/or defect image tiles. In general, the reflected sunlight gets more intense as solar phase angle increases due to the forward scattering of aerosols in the atmosphere. Interestingly, the curve of the reflected sunlight in solar phase angles higher than 90° acquired in Orbit # 29–30 was approximately twice more gradual than that acquired in Orbit #11–12. Because these data were taken under the similar geometry, the difference is likely to be caused by some real variations in the cloud top structure. Such solar phase angle dependence of the reflected sunlight or brightness temperature in the same region was also studied using images taken in the same observation period but at other wavelengths: 283 nm and 365 nm from the Ultraviolet imager (UVI), 0.9 μm from the 1-μm camera (IR1), and 10 μm from the Longwave infrared camera (LIR). This multispectral comparison showed that no significant difference in the curve between Orbit #11–12 and #29–30 was detected at the wavelengths other than 2.02 μm. Wavelengths at 283 nm, 365 nm, and 0.9 μm are sensitive to optical thickness of aerosols but insensitive to their vertical distributions; therefore, vertical distributions of Modes 1 and 2 particles characterized by scale height are key parameters to make the difference in the curve of the reflected sunlight discovered from the 2.02-μm images. In addition, wavelength at 10 μm is less sensitive to Mode 1 particles because their size is small compared with wavelength. These facts imply that such difference is caused by vertical distribution of Mode 1 particles.
In this presentation, we present the solar phase angle dependence of the reflected sunlight or brightness temperature using the five wavelengths of Akatsuki’s instruments. While Sato et al. (2020) reproduced the solar phase angle dependence and the center-to-limb variation of the reflected sunlight by Mode 2 particle size and its cloud scale height (common with Mode 1 particles), free parameters in this study are the scale height of Mode 1 particles (scale height of Mode 2 particle is fixed to the value used by Haus et al., 2015) and the abundance ratio of Mode 1 and 2. Trial-and-error results to reproduce the difference in the curve only obtained from the 2.02-μm images using radiative transfer calculation will be discussed.
How to cite: Sato, T. and Satoh, T.: Short-term variation in cloud top structure of Venus obtained from the complete set of Akatsuki IR2 images, Europlanet Science Congress 2024, Berlin, Germany, 8–13 Sep 2024, EPSC2024-713, https://doi.org/10.5194/epsc2024-713, 2024.
Abstract
In this study we use the most recent version of the ground-to-thermosphere VPCM [1] that includes an ionosphere model, ambipolar diffusion and nitrogen chemistry [2]. This tool allows us to investigate and identify in 3D potential mechanisms responsible for the observed variability in Venus’s atmosphere, in the region between 90 km and 130 km altitude. NO and O2(Δg) airglows, are commonly used to shed light on the global dynamics and circulation patterns above 90 km. Their characteristics are a combination of horizontal, vertical transport and chemical net reactions [3,4].
We performed sensitivity tests of unconstrained parameters (e.g. gravity waves drag and eddy diffusion vertical profile) to evaluate the impact on the dynamical structures, O densities, temperature and O2(Δg) nightglow characteristics. These results depict possible scenarios useful to interpret future EnVision observations of trace compounds in those mesosphere layers currently poorly constrained, and not fully explained by current 3D models.
Introduction
Large latitude and day-to-day variations of temperature, composition, and apparent zonal wind velocities were measured by Venus Express [5,6,7] and ground-based telescopes [8,9] in the region between 90 and 130 km altitude. In this atmospheric region two main dynamical flows coexist: the subsolar-to-antisolar circulation (SS-AS) and the retrograde super-rotating zonal wind (RSZ). Those atmosphere levels lack observations and airglow emissions (e.g. O2(Δg) and NO nighttime fluorescence) are commonly used as tracers for studying the dynamical structure due to their peak brightness and horizontal distribution [10]. Unfortunately, many free parameters and theoretical uncertainties (i.e. limited gravity wave constraints for wave breaking, quenching rate coefficient for the IR mesospheric cooling, etc) prevent existing GCMs to converge to a unique set of wind field, eddy diffusion coefficients and wave drag parameters to reproduce observed density, temperature, and airglow variations. In addition, airglow variability is a combination of horizontal transport, vertical transport, chemical reactions and local change of temperature and density. Predictions with the Venus Planet Climate model (V-PCM) [4] showed that contributions from chemical processes and vertical transport often prevail over horizontal transport. Therefore, 1.27 um O2(Δg) nightglow is not necessarily a good dynamical tracer of zonal wind in this region. Those authors also explained the observed variability with the impact of westward propagating Kelvin waves, enhancing the meridional circulation, and periodically transporting molecular oxygen to high latitudes.This highlights the importance of an exhaustive and precise description of oxygen chemistry, which is still a challenge on Venus.
Motivation of this study
Recent V-PCM improvements presented in [1] and [2] focused on Venus’s atmosphere above 130 km, and performed a comprehensive validation of model results with PVO, Magellan and VEX observations in the thermosphere and ionosphere. The outputs of those simulations fed the current version of the Venus Climate Database (see http://www-venus.lmd.jussieu.fr). However, those model developments, together with ad-hoc tuning of parameters (see [1] for details) to fit observational data, changed dramatically the global circulation in the transition region. For instance, we found that this region is very sensitive to the unconstrained parameters used in our gravity wave parameterization (e.g. EP-flux, diffusion coefficient). In addition, there is still large uncertainty on the quenching rates and rate coefficient value used in the main production reaction of O2(Δg) nightglow (O + O + M -> O2(Δg) + M).
This work is a follow-up of [4], where we use an updated version V-PCM as in [1,2] to perform a number of sensitivity tests and provide an exhaustive analysis of the impact on our results (e.g. temperature, circulation, O densities, O2(Δg) nightglow) from unconstrained parameters and theoretical uncertainties (e.g. gravity waves drag, eddy diffusion coefficients, rate coefficients).
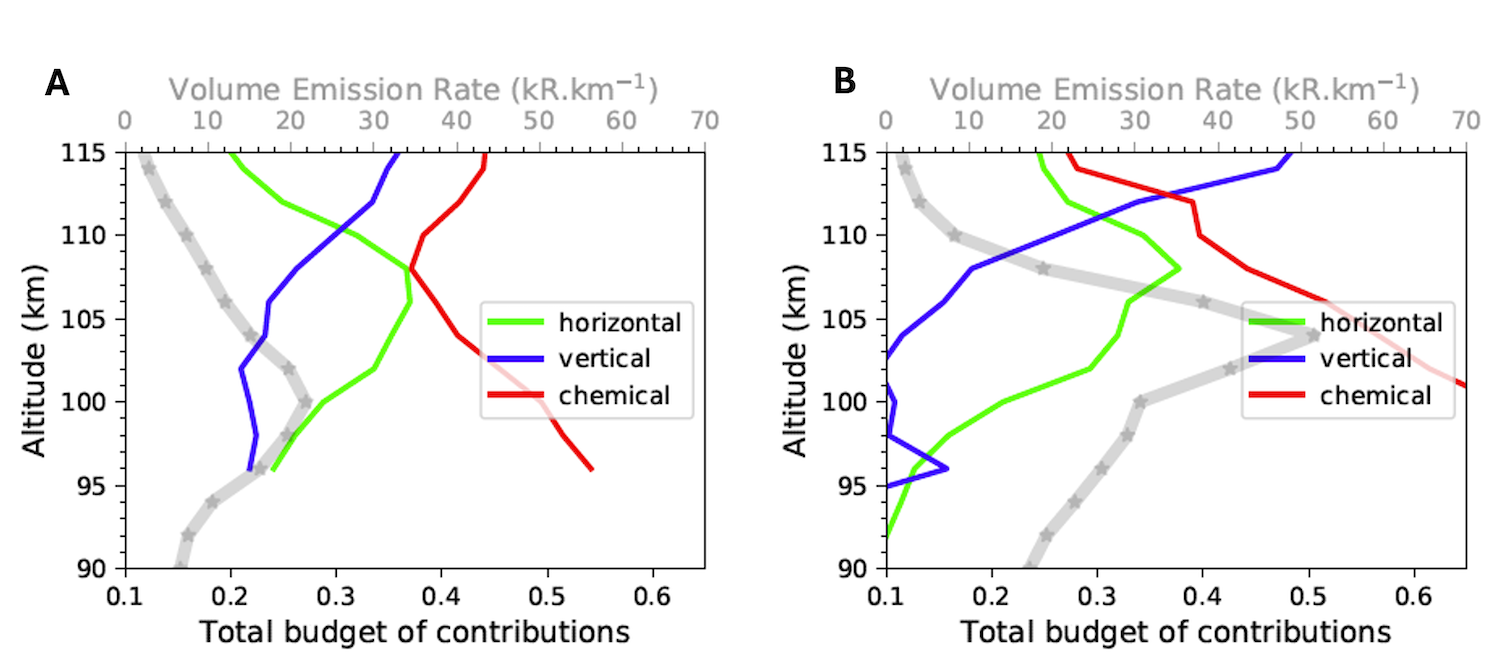
Figure1: Example of sensitivity tests performed with the V-PCM using the Volume Emission Rate (VER) of O2(Δg) as proxy. According to [4] (Panel A), the contributions from chemical processes and vertical transport often prevail over horizontal transport. Near the peak of O2(Δg), the chemical contributions account for 50% of the variation, the horizontal transport for 30% and vertical transport for about 20%. With the current version of the V-PCM as in [2,3] (Panel B) the vertical contribution is reduced to 10%, due to the reduced temperature at nighttime by about 40 K (consequently a decreased subsidence) and increased gravity wave drag above 100 km.
Acknowledgements
G.G. and A.M. acknowledge financial support from Junta de Andalucía through the program EMERGIA 2021 (EMC21 00249). AS and LML arefunded by the Spanish MCIU, the AEI and EC-FEDER funds under project PID2021-126365NB-C21. IAA-team also acknowledges financial support from the Severo Ochoa grant CEX2021-001131-S funded by MCIN/AEI/ 10.13039/501100011033.
References
[1] Martinez et al. 2023 Icarus, 2023, 115272, 0019-1035, https://doi.org/10.1016/j.icarus.2022.115272
[2] Martinez et al. 2024, Icarus, 415:116035
[3] Gilli et al. 2021, Icarus, 366:114432, https://doi.org/10.1016/j.icarus.2021.114432
[4] Navarro et al. Icarus, 366:114400, https://doi.org/10.1016/j.icarus.2021.114400
[5] Soret et al.2009, Icarus, 217:849–855
[6] Vandaele et al. 2016, Icarus, 272 (2016), pp. 48-59
[7] Shakun et al. 2023, Solar System Research, Vol.57,n3
[8] Moullet et al. 2012, A&A, 546:A102
[9] Lellouch et al. 1994, Icarus, 110:315–339
[10] Brecht et al. 2011, JGR(Planets), 116 (2011), p. 8004
How to cite: Gilli, G., Martinez, A., Stolzenbach, A., Navarro, T., Lebonnois, S., Lefèvre, F., Streel, N., and Lara, L. M.: A re-analysis of the circulation in the “transition region” of Venus atmosphere (90-130 km) with the Venus PCM, Europlanet Science Congress 2024, Berlin, Germany, 8–13 Sep 2024, EPSC2024-256, https://doi.org/10.5194/epsc2024-256, 2024.
The design of in-situ missions such as the DAVINCI probe requires quantitative models of turbulence and wind shear in order to assess their effects on the vehicle motion which in turn can influence radio link performance or camera image blur. Some first-principles estimates can be derived from large-scale wind shears and convective fluxes . Experience with the Huygens probe at Titan also showed that the buoyancy frequency gives an informative guide to wind shear : the large-scale vertical shear at Venus is typically 2-3 m/s/km : the strong stability just below and above the clouds may permit shears up to 10 m/s/km, these values being a little below and above the maximum seen by Huygens. 10 m/s/km is considered the upper end of 'light turbulence' in terrestrial aviation. I also present the limited information we have from Pioneer Venus accelerometer measurements, Doppler tracking (Venera, VEGA and Pioneer Venus) and wind measurements (VEGA balloons). For example, in the middle-cloud convective region, a characteristic turbulence amplitude is ~1.5 m/s over a length scale of about 700m, and some localized shear reaches ~ 20 m/s/km. A simple 'random-walk' model for the turbulent wind profile appears to describe the Venera data well. I present the model for the low latitudes to be visited by DAVINCI, and discuss considerations for extending the model to high latitude.
How to cite: Lorenz, R.: Towards Turbulence and Wind Shear Models for the Venus Atmosphere, Europlanet Science Congress 2024, Berlin, Germany, 8–13 Sep 2024, EPSC2024-603, https://doi.org/10.5194/epsc2024-603, 2024.
Data assimilation of the Venus atmosphere has become more feasible due to the long-term observations by the Venus climate orbiter “Akatsuki”. We have produced the first objective analysis for the Venus atmosphere by assimilating horizontal winds derived by the cloud tracking of the Akatsuki Ultraviolet Imager (UVI) [1]. Here, we assimilate the temperature derived by the Akatsuki Longwave Infrared Camera (LIR), using the AFES-LETKF data assimilation system for Venus "ALEDAS-V" [2], which is based on the atmospheric general circulation model for Venus "AFES-Venus" [3] and local ensemble transform Kalman filter “LETKF”. In this experiment the altitude for the assimilation is set to 65 km regardless of the emission angle for simplicity, though the altitude observed by LIR depends on the emission angle (the angle between the zenith and observer directions as seen from the observation point). The influence of the emission angle is investigated for two cases; the one is the emission angle limited to 40 degrees or less and the other one is that limited to 75 degrees or less.
[1] Fujisawa, Y., Sy. Murakami, N. Sugimoto, M. Takagi, T. Imamura, T. Horinouchi, G. L. Hashimoto, M. Ishiwatari, T. Enomoto, T. Miyoshi, H. Kashimura and Y.-Y. Hayashi, Y.-Y. (2022), Sci. Rep. 12, 14577.
[2] Sugimoto, N., A. Yamazaki, T. Kouyama, H. Kashimura, T. Enomoto, and M. Takagi (2017), Sci. Rep., 7(1), 9321.
[3] Sugimoto, N., M. Takagi, and Y. Matsuda (2014a), J. Geophys. Res. Planets, 119, 1950–1968.
How to cite: Fujisawa, Y., Sugimoto, N., Komori, N., Ando, H., Takagi, M., Murakami, S., and Kouyama, T.: Assimilation of the temperature derived by Akatsuki Longwave Infrared Camera in the Venus atmosphere, Europlanet Science Congress 2024, Berlin, Germany, 8–13 Sep 2024, EPSC2024-112, https://doi.org/10.5194/epsc2024-112, 2024.
Imaging of the Venus night side in the near-infrared spectral transparency “windows” at 1, 1.7 and 2.3 µm by Venus Express revealed details of the deep cloud structure and total opacity variations. These observations provide important clues for understanding of the atmospheric and cloud dynamics and the energy balance in the thick Venusian atmosphere. The most remarkable change of the cloud opacity occurs at about 60 S latitude where the emission from the deep atmosphere strongly decreases that corresponds to abrupt transition to the much thicker polar cloud with almost doubled total opacity. We will present results of the radiative transfer modelling by the Spherical Harmonics Discrete Ordinates Method (SHDOM) simulating outgoing emission on the night side and preliminary assessments of the total cloud opacity and its variability.
How to cite: Titov, D.: Venus cloud opacity from the Venus Express observations in the near-IR transparency “windows” , Europlanet Science Congress 2024, Berlin, Germany, 8–13 Sep 2024, EPSC2024-706, https://doi.org/10.5194/epsc2024-706, 2024.
Introduction: The Venus Climate Database (VCD) is a free tool designed to be useful for engineers and scientists in need of a reference atmosphere of Venus for mission planning, observations preparation, analysis and interpretation. The VCD atmospheric fields are based on outputs from simulations using the Venus Planetary Climate Model (V-PCM) [1,2]. This project is funded by the European Space Agency, in the frame of the EnVision mission to Venus. The currently distributed VCD is version 2.3.
Overview of the Venus Climate Database: The VCD provides mean values and statistics of the main meteorological variables (atmospheric temperature, density, pressure and winds) as well as atmospheric composition and related physical fields for any given point in space and time. It extends from the surface up to and including the thermosphere (~250km), with extrapolation for higher altitudes.
The database contains high resolution temporal outputs (using 24 hourly bins) enabling a good representation of the diurnal evolution of quantities over a climatological Venusian day.
Several conditions (scenarios) can be chosen from: various Extreme UltraViolet (EUV) input from the Sun (solar minimum, average and maximum, given Earth date, or chosen E10.7 index), combined with different values (minimum, standard or maximum) of the cloud UV albedo to bracket observed variations. An illustrative example of the importance of the EUV input on thermospheric structure is presented in Figure 1.
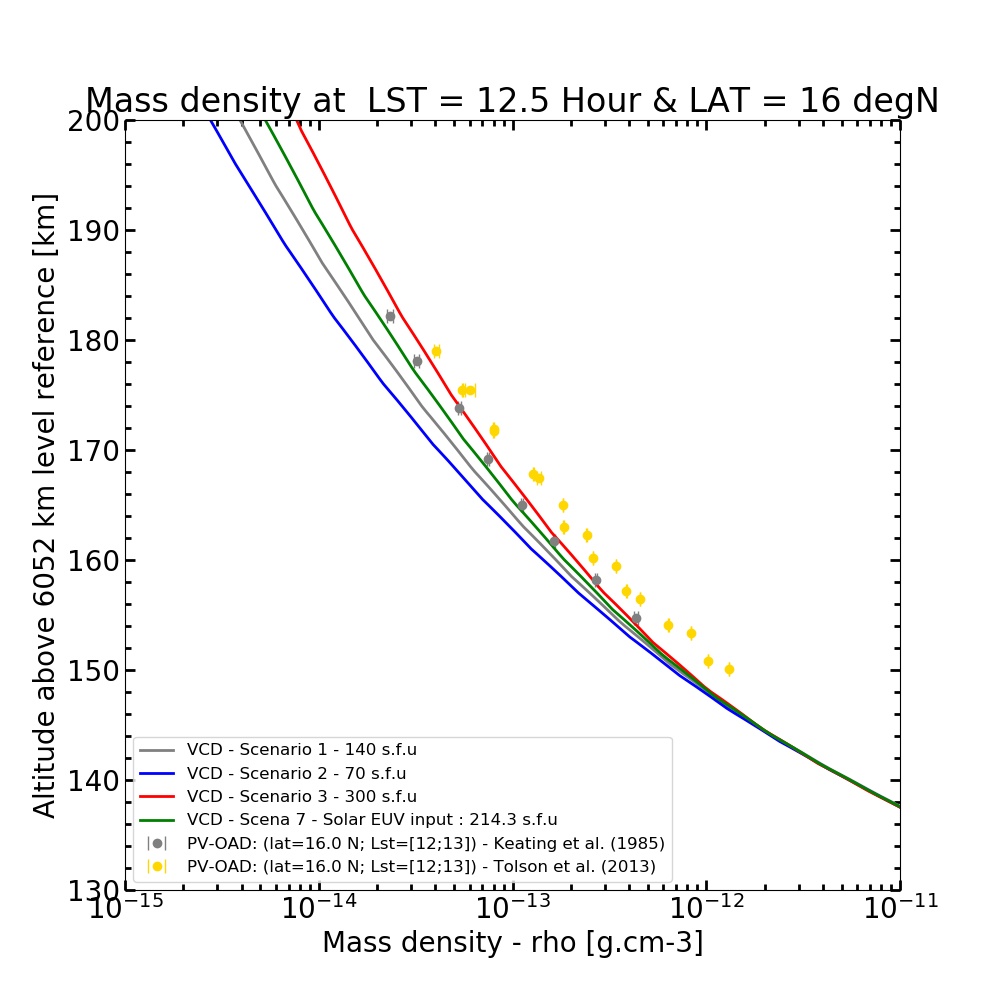
Figure 1: Mass density predicted by the VCD for various EUV solar input, expressed in solar flux units, compared to Pioneer Venus OAD measurements.
In addition to the climatological values, the VCD provides the Venusian intra-hour variability (RMS) of main meteorological variables, as well as the Venusian day-to-day variability thereof, as estimated from the multiple Venus days of V-PCM simulations. Perturbations can also be added to the climatological values as : (i) large-scale perturbations representative of the large-scale waves present in the V-PCM simulations, through use of EOF decomposition as shown in Figure 2; (ii) small-scale perturbations representative of gravity waves, tuned to reproduce available observations (e.g. VeXADE torque measurements), as illustrated in Figure 3.

Figure 2: Illustrative example of the use of the VCD large scale perturbations scheme (purple dots), compared to Magellan aerobraking measurements (green dots). The red dots display VCD climatological (unperturbed) values encompassed with the associated RMS (in orange).
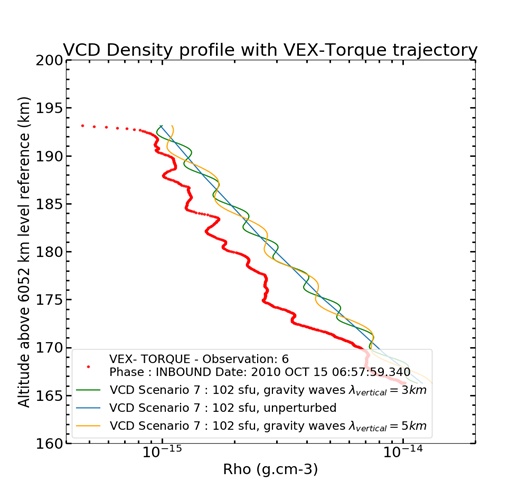
Figure 3: Illustrative example of use of the VCD small scale perturbations scheme (representative of gravity waves of vertical wavelength specified by the user), compared to Venus Express Torque observations.
For deep atmosphere applications, a “high resolution mode” is also available: although the V-PCM simulations have been run at the resolution of a few degrees in longitude and latitude (3.75° x 1.875°), the VCD uses some post-processing and a high resolution topography map (at 23 pixels/degree) to adjust the local pressure (and density) and temperature, as shown in Figure 4.
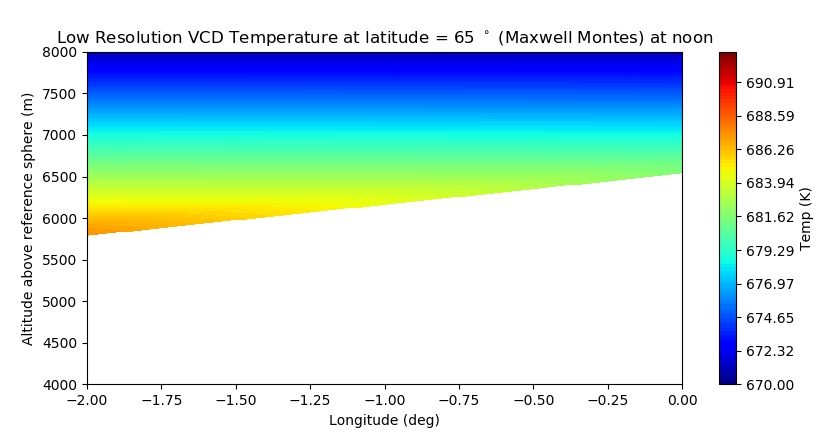
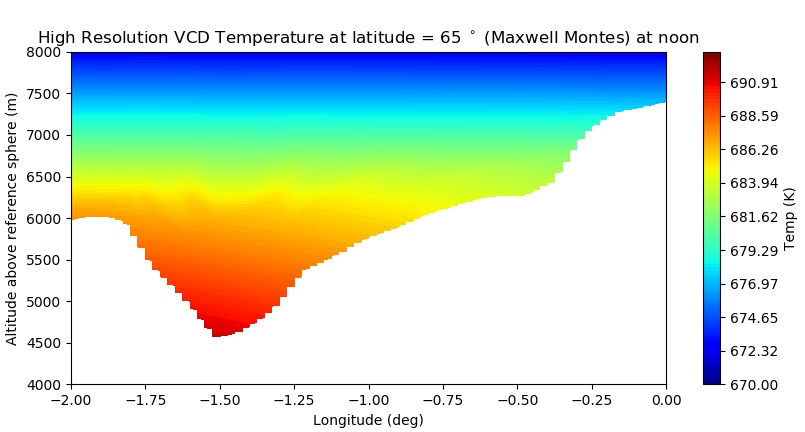
Figure 4: Example of extraction of atmospheric temperatures using the VCD low resolution (top plot), i.e. V-PCM simulation resolution or VCD high resolution (lower plot), i.e. post-processed to ~0.04° effective horizontal resolution.
VCD validation: The VCD has been validated using available datasets from experiments on various missions (Pioneer Venus, Magellan and Venus-Express) enabling some comparisons and investigations in terms of temperature, density and composition. All these are reported in the VCD validation document distributed with the VCD.
Using and Obtaining the VCD: For a quick look users may use the online interface available here : http://www-venus.lmd.jussieu.fr
For more extensive usage, a full (i.e. datafiles and access software) version is available for download from the same website. In practice the software comes as a Fortran subroutine meant to be called by the user’s personal code; examples of interfaces in other programming languages (C,C++, Python, IDL, Matlab) are also given.
References:
[1] Martinez A. et al. (2023) Icarus 389, 115272, 10.1016/j.icarus.2022.115272.
[2] Stolzenbach A. et al. (2023) Icarus 395, 115447, 10.1016/j.icarus.2023.115447.
How to cite: Lebonnois, S., Millour, E., Martinez, A., Boissinot, A., Pierron, T., Bierjon, A., Forget, F., Salminen, J., Lefèvre, F., Chaufray, J.-Y., and Cipriani, F.: The Venus Climate Database, VCD 2.3 , Europlanet Science Congress 2024, Berlin, Germany, 8–13 Sep 2024, EPSC2024-430, https://doi.org/10.5194/epsc2024-430, 2024.
In the frame of the preparation of the EnVision mission, going back to existing datasets is essential. In this investigation, the 1.17 µm band both of interest for VenSpec-M and VenSpec-H is analysed from a statistical point of view based on the calibrated dataset provided in Mueller et al. (2020) [1]. The radiative transfer model, ASIMUT-ALVL [2], is then validated against these averaged observations.
VenSpec-H is part of the VenSpec suite [3], also including an IR mapper and a UV spectrometer [4]. The suite science objectives are to search for temporal variations in surface temperatures and tropospheric concentrations of volcanically emitted gases, indicative of volcanic eruptions; and to study surface-atmosphere interactions. Maintenance of the clouds requires a constant input of H2O and SO2. A large eruption would locally alter the composition by increasing abundances of H2O, SO2, and CO and possibly decreasing the D/H ratio. Observations of changes in lower atmospheric SO2, CO, and H2O vapour levels, cloud level H2SO4 droplet concentration, and mesospheric SO2, are therefore required to link specific volcanic events with past and ongoing observations of the variable and dynamic mesosphere, to understand both the importance of volatiles in volcanic activity on Venus and their effect on cloud maintenance and dynamics. VenSpec-H’s main scientific objectives are (1) to better constrain the composition of the atmosphere both below and above the clouds to relate changes in the composition to changes on the surface or geological processes such as volcanism; (2) to investigate short and long-term trends in the composition to better grasp the climate evolution on Venus.
VenSpec-H is designed to measure H2O, HDO, CO, OCS, and SO2 on both the night and day side to contribute to this investigation. VenSpec-H is a nadir-pointing, high-resolution (R~8000) infrared spectrometer that will perform observations in different spectral windows between 1 and 2.5 µm. Spectra in these bands will be recorded sequentially with the help of a filter wheel and will allow the sounding of different layers in the Venusian atmosphere: close to the surface (1.17 µm), 15-30 km (1.7 µm), 30-40 km (2.4 µm) and above the clouds (1.38 & 2.4 µm). Two additional polarization filters will be used during dayside observations to better characterize the clouds’ properties.
VIRTIS was an instrument with three different channels, mapping visible (M-VIS), mapping infrared (M-IR) and high-resolution infrared (H). It flew onboard Venus Express from 2006 to 2014 and delivered major science results [5-7].
We consider the M-IR channel which was a line scanning imaging spectrometer observing in the near infrared from approximately 1 μm to 5 μm. Having acquired about 5000 data cubes, VIRTIS-M-IR stopped measuring science data in October 2008 when its cryocooler failed.
This investigation is based on calibrated data covering the spectral range from 1020 nm to 1400 nm (bands 0 to 39) with a spectral sampling of 9.5 nm and published in 2020. This dataset has been calibrated to include the 1 to 1.4 µm with Even-Odd correction and sun straylight subtraction [1]. It was also spectrally calibrated based on Cardesin Moinelo et al., 2010 [8].
A statistical analysis of the VIRTIS-M-IR dataset was performed, considering account millions of spectra, In the frame of the scientific preparation of EnVision, we focused on the 1.17 µm band which is common to VenSpec-H and VenSpec-M. Averaged spectra were calculated by considering latitudinal and temporal binning. Outliers were identified for further analysis.
The BIRA-IASB radiative transfer code, ASIMUT-ALVL [2], has been used as a forward modeling tool in this spectral range to make sure all contributions were properly understood. The radiances of the nightside atmosphere of Venus originate from the thermal emission of the surface and atmosphere. The impacts of the molecular species (line-by-line and collision induced absorption) and of the aerosols were analyzed separately to, in fine, reproduce the VIRTIS-M-IR calibrated observations.
This investigation has been led to characterise the radiance levels that VenSpec-H will likely observe when measuring the variations of the minor species in Venus’ troposphere. In this presentation, we will discuss the data analysis and its impact on the expected performances of our future instrument.
References
[1] N.T. Mueller et al., “Multispectral surface emissivity from VIRTIS on Venus Express”, Icarus, 335 (2020) 113400.
[2] A.C. Vandaele, M. Kruglanski and M. De Mazière, “Modeling and retrieval of atmospheric spectra using ASIMUT”, Proc. of the First 'Atmospheric Science Conference', ESRIN, Frascati, Italy, 2006.
[3] J. Helbert et al., “The VenSpec suite on the ESA EnVision mission to Venus”, Proc. SPIE 11128, Infrared Remote Sensing and Instrumentation XXVII, (2019) 1112804.
[4] E. Marcq et al., “Instrumental requirements for the study of Venus’ cloud top using the UV imaging spectrometer VeSUV”, Advances in Space Research, 68 (2021) 275-291.
[5] Piccioni, G. et al., “South-polar features on Venus similar to those near the north pole”, Nature, 450 (7170) (2007) 637-640.
[6] Drossart, P. et al., “A dynamic upper atmosphere of Venus as revealed by VIRTIS on Venus Express”, Nature, 450 (7170) (2007) 641-645.
[7] E. Marcq et al., “Minor species in Venus’ night side troposphere as observed by VIRTIS-H/Venus Express”, Icarus, 405 (2023) 115714.
[8] A. Cardesin Moinelo, et al., “Calibration of hyperspectral imaging data: VIRTIS-M Onboard Venus Express “ IEEE Transactions on Geoscience and Remote Sensing, 48(11) (2010) 3941-3950.
How to cite: Robert, S., Erwin, J., Mueller, N., Marcq, E., Ducreux, E., Thomas, I., De Cock, R., Neefs, E., Alemanno, G., Helbert, J., and Vandaele, A. C.: Assessing near-surface radiance levels based on VIRTIS spectra to prepare VenSpec-H science, Europlanet Science Congress 2024, Berlin, Germany, 8–13 Sep 2024, EPSC2024-1025, https://doi.org/10.5194/epsc2024-1025, 2024.
The Venera 13 probe recorded spectrophotometric data of Venus’s atmosphere from 62 km down to the surface. While the main dataset was lost, a part of it was reconstructed using the originally published graphic material [1]. The reconstructed downward radiance profiles indicate the presence of a possible near-surface particulate layer (NSPL) in the atmosphere. By fitting these Venera 13 radiance data, NEMESIS [2], a radiative transfer and retrieval tool, is used to retrieve the parameters of the particles forming the NSPL, such as size, abundance, and refractive index. The retrieved layer could have an aeolian or volcanic origin, or it could be formed by volatile transport from the surface. Considering the possible formation mechanisms, it is likely that the NSPL exhibits some form of spatiotemporal variability. On nightside of Venus, it is possible to probe the surface and deep atmosphere (surface up to 15 km altitude) in several near-IR thermal emission windows within the wavelength range of 0.78 to 1.18 μm. Thus, if optical thickness variations of the NSPL exist, then it could be possible to detect them using repeated spacecraft observation in near-IR windows. The instruments EnVision/VenSpec-M and VERITAS/VEM will perform such observations using several surface-observing spectral windows [3, 4]. Motivated by these upcoming missions, simulations are performed to study the effect of the NSPL on near-IR spacecraft observations.
NEMESIS is used to perform simulations of the nightside thermal emission while introducing an assumed variability in the above retrieved NSPL. The sensitivity of the simulated thermal emission spectra to an assumed variability of the NSPL is inspected. However, the main cloud deck (MCD) also shows high variability and affects the surface thermal emission. Thus, the spacecraft observations are simulated by also introducing the variability of MCD in simulations. These simulated spacecraft observations are then corrected for MCD optical thickness variations by following the methodology given by [5] to correct the Venus Express/VIRTIS-M-IR observations. The detectability of the NSPL after correcting the observations for MCD variations is then investigated.
References:
[1] Ignatiev, N. I., Moroz, V. I., Moshkin, B. E., Ekonomov, A. P., Gnedykh, V. I., Grigor’ev, A. V., and Khatuntsev, I. V. Cosmic Research 35(1), 1–14 (1997).
[2] Irwin, P. G., Teanby, N. A., de Kok, R., Fletcher, L. N., Howett, C. J., Tsang, C. C., Wilson, C. F., Calcutt, S. B., Nixon, C. A., and Parrish, P. D. Journal of Quantitative Spectroscopy and Radiative Transfer 109(6), 1136–1150 (2008).
[3] Helbert, J., Vandaele, A. C., Marcq, E., Robert, S., Ryan, C., Guignan, G., Rosas-Ortiz, Y. M., Neefs E., Thomas, I. R., Arnold, G., Peter, G., Widemann, T., and Lara, L. M., In Infrared Remote Sensing and Instrumentation XXVII, 1112804, SPIE, (2019).
[4] Helbert, J., Pertenaïs, M., Walter, I., Peter, G., Säuberlich, T., Cacovean, A., Maturilli, A., Alemanno, G., Zender, B., Arcos Carrasco, C., and others. In Infrared Remote Sensing and Instrumentation XXX, 1223302, SPIE, (2022).
[5] Mueller, N. T., Smrekar, S. E., and Tsang, C. C. Icarus 335(August 2019), 113400 (2020).
How to cite: Kulkarni, S., Irwin, P., and Wilson, C.: Searching for a near-surface particulate layer using near-IR spacecraft observations, Europlanet Science Congress 2024, Berlin, Germany, 8–13 Sep 2024, EPSC2024-1042, https://doi.org/10.5194/epsc2024-1042, 2024.
Introduction:
The Venusian atmosphere is a fascinating object of interest to planetary scientists. Obtaining in-situ data from Venus’ atmosphere and surface is however challenging. Radiative transfer (RT) modelling is an essential tool to understand planetary atmospheres. In a nutshell, radiative transfer codes model absorption, emission, and scattering of light by various components present in the atmosphere and surface. Accurate modelling of the atmosphere is also essential for decoding surface information from remote sensing data collected by probes. In the coming decade, several missions to Venus are planned that aim to image Venus thermal emission in the NIR spectral windows [1]. In order to process the data from these missions once they are available, radiative transfer modelling of the Venusian atmosphere is a necessary first step. One important aspect of the model is absorption by gases. Modelled absorption cross-sections are governed by the line list chosen for the model. These line lists are provided for wavelength ranges over which absorption occurs. The high-resolution transmission molecular absorption database (HITRAN) is a frequently used line database in radiative transfer modelling [2]. Several Venus atmospheric studies [3], however, have relied on the database of [4] for CO2 lines, referred to as “Hot CO2” from here on. This database is structurally similar to high-temperature molecular spectroscopic database (HITEMP) [5]. Fortunately, due to advances in exoplanetary sciences, newer line databases have been developed for high temperature atmospheres which are yet to be applied to Venusian atmospheric studies. In this work we compare absorption cross sections generated by using different line databases for relevant species present in the Venusian atmosphere: HITRAN 2020, HITEMP 2010, Hot CO2, and ExoMol [2,4,5,6]. Additional comparisons are made between radiance spectra generated by radiative transfer methods using different line lists with measured spectra in the NIR wavelength range.
SPICAV dataset from Venus Express:
The NIR wavelength range of 0.8 – 1.2 micron contains spectral windows where Venus’ surface thermal emission radiation is detectable from space, paving the way for surface studies in these bands [4]. Hence, the NIR region of Venus’ spectra is of particular importance. The Spectroscopy for the Investigation of the Characteristics of the Atmosphere of Venus (SPICAV) suite on board Venus Express made observations of Venus’ nightside in the spectral range of 0.65–1.7 um. The data used in our analysis is detailed in [7].
Materials and Methods:
The following computational tools have been utilized in this work: PYthon for Computational ATmospheric Spectroscopy (Py4CATS) [8] and Planetary Spectrum Generator (PSG) [9]. Both Py4CATS and PSG are equipped to read various line lists to produce radiance spectra from calculated absorption coefficients for a specified atmospheric profile. PSG is an online multi-purpose tool capable of computing radiance and transmission for planets and exoplanets with preconfigured settings. Py4CATS implements several scripts for radiative transfer calculations which can be executed from a Python interpreter or from a console. PSG includes a module capable of modelling scattering in the Venusian clouds while Py4CATS has to be combined with additional tools to do so, e.g. [10].
Preliminary results:
In the Venusian atmosphere, absorption features are majorly dominated by CO2 and H2O lines. Thus, we start by comparing absorption cross sections for CO2 computed by Py4CATS for the following line databases: HITRAN 2020, HITEMP 2010, and Hot CO2. From figure 1, one can note that HITEMP 2010 has missing lines in the 8500 – 9000 cm-1 wavenumber region and that absorption cross sections produced from HITRAN 2020 are much closer to those of Hot CO2. This work aims to further explore implications on radiative transfer modelling using recently updated line databases such as HITRAN 2020 and ExoMol.
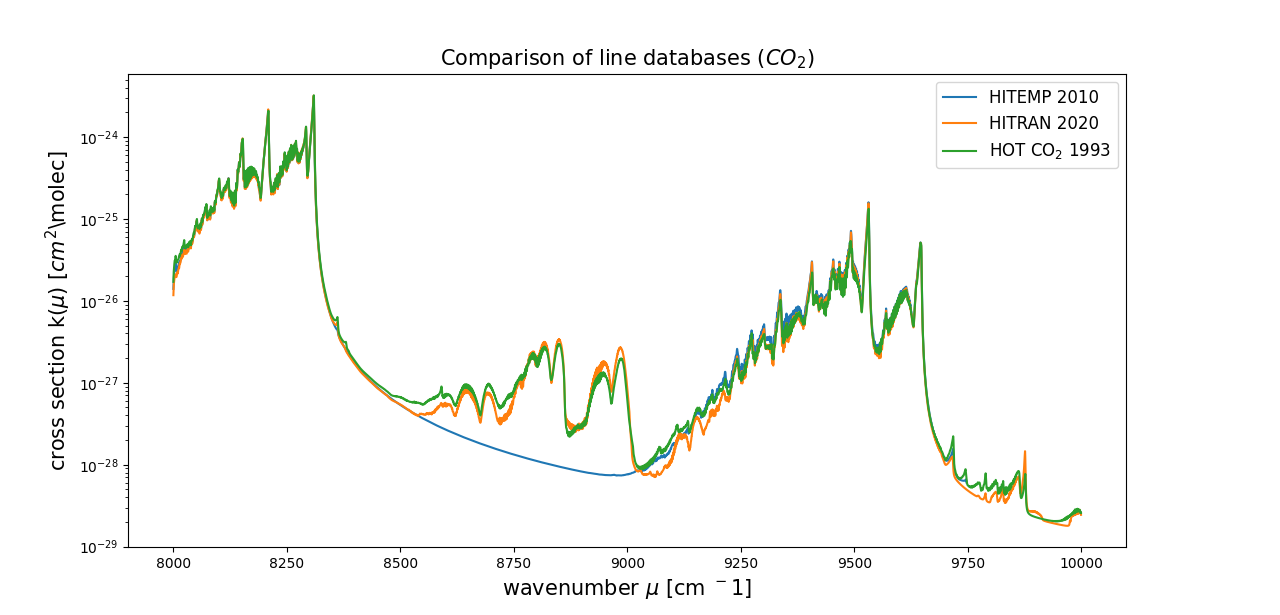
Figure 1: Comparison of line databases in NIR region generated using Py4CATS, computed for575 K and 2x10⁶ Pa
To decide which database is best suited it is necessary to compare modelled top of atmosphere radiances to observed spectra. We use the PSG to model nadir radiances of the default Venus atmosphere profile and modules (i.e. Lambertian surface with emissivity 0.8, absorption by gases, Rayleigh scattering, multiple scattering at cloud droplets with cloud optical thickness 15). Figure 2 shows that there are noticeable differences in the radiance spectrum generated by the PSG [9] upon using HITRAN 2020 line database and the ExoMol line database.
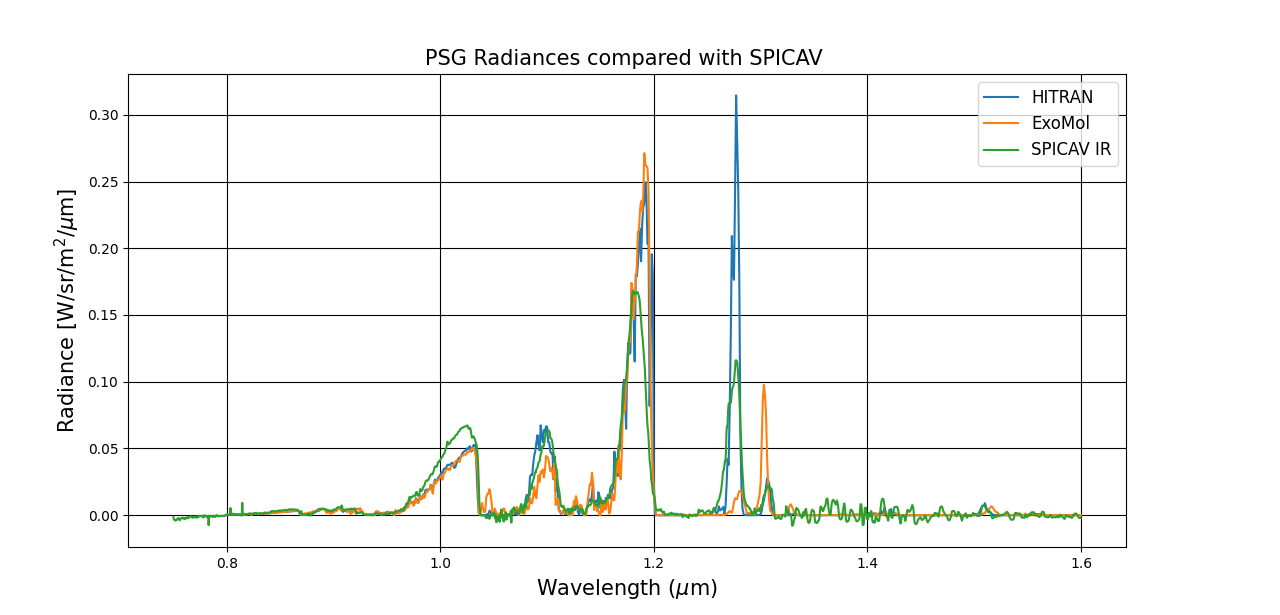
Fig 2: Radiance spectra generated by PSG (HITRAN 2020 and ExoMol) compared to SPICAV IR data.
It can be noted from figure 2 that radiances generated using HITRAN 2020 database to have a better agreement with SPICAV data than those generated using ExoMol database. It is likely that further modifications to the line shapes and continuum absorption similar to those that are used in other Venus studies will have to be introduced [3, 11].
Conclusions:
The HITRAN 2020 line list is closer to the often used ‘’Hot CO2’’ line list than previous versions of HITRAN. Line databases such as ExoMol which are intended for high temperature atmospheres may improve radiative transfer models for Venus, although our initial comparison does not show an improvement over HITRAN. Overall our investigations have shown HITRAN 2020 to be more promising for Venus RT studies than HITEMP 2010 and ExoMol. This work aims to further explore applying these new databases to radiative transfer models and compare generated spectra to measured data.
References:
[1] Allen D. A. et al. (1984) Nature, 307, 222–224
[2] Gordon I. E. et al. (2022) J. Quant. Spectrosc. Radiat. Transfer, 277, 107949
[3] Bézard B. et al. (2011) Icarus, 216(1), 173–83
[4] Pollack J. B. et al. (1993) Icarus, 103, 1–42
[5] Rothman L. S. et al. (2010) J. Quant. Spectrosc. & Radiat. Transfer, 111(12-13), 2139–2150
[6] Tennyson J. et al. (2016) J. Mol. Spectrosc., 327, 73 – 94
[7] Korablev O. et al. (2006) J. Geophys. Res. 111(E9)
[8] Schreier F. et al. (2019) Atmosphere, 10(5), 262
[9] Villanueva G. L. et al. (2018) J. Quant. Spectrosc. & Radiat. Transfer, 217, 86 – 104
[10] Efremenko D. et al. (2023) Environmental Sciences Proceedings , 29(1), 20
[11] Kappel D. et al. (2016) Icarus 265, 42–62
How to cite: Das, A., Mueller, N., Schreier, F., Kappel, D., Grenfell, J. L., Rauer, H., and Helbert, J.: Radiative Transfer Modelling of Venus – A comparison of line databases, Europlanet Science Congress 2024, Berlin, Germany, 8–13 Sep 2024, EPSC2024-1078, https://doi.org/10.5194/epsc2024-1078, 2024.
Venus is the twin sister of our planet Earth, whose atmosphere underwent a dramatically different evolution. The atmosphere of Venus is hot and dense near the surface, which entirely covered by the clouds. The upper cloud layer spans altitudes up to ~70 km. On top of this layer, there also seats a layer of haze, whose upper boundary is as high as 90 km. This haze layer and top of the upper cloud layer are what can be observed in the visible from space; whereas, other layers of the atmosphere and underlying terrains remain permanently hidden from an external observer using reflected solar radiance. These clouds of Venus appear to be rich in enigmas. One of them is the unknown UV absorber. This term is often used in the literature to designate an unknown substance that yields a very steep gradient in the spectrum detected in the atmosphere of Venus (e.g., Pollack et al. 1980; Lee et al. 2015; Jessup et al. 2020). Figure 1 shows an example of such spectrum as it is reported by Jessup et al. (2020). As one can see here, there is a noticeable gap in the albedo spectrum centered at wavelength λ = 0.36 μm and a factor of ~3 increase of reflectivity over quite narrow range of wavelength λ = 0.36 – 0.55 μm. In the literature, several plausible candidates were put forth to explain the observed spectral gradient. It also is worth noting that there is no consensus about this matter yet. A relatively broad absorption band cannot be explained by the existing atmospheric gaseous compositions. As such, all the candidates for a role of the UV absorber(s) considered in the literature to date are assumed to have local, Venus origin. However, it necessarily implies an existence of mechanism for systematic transport of a considerable amount of aerosol particles to extremely high altitudes, 70+ km. In this work, we report preliminary results of the ongoing research on an interplanetary origin of the unknown UV absorbers.
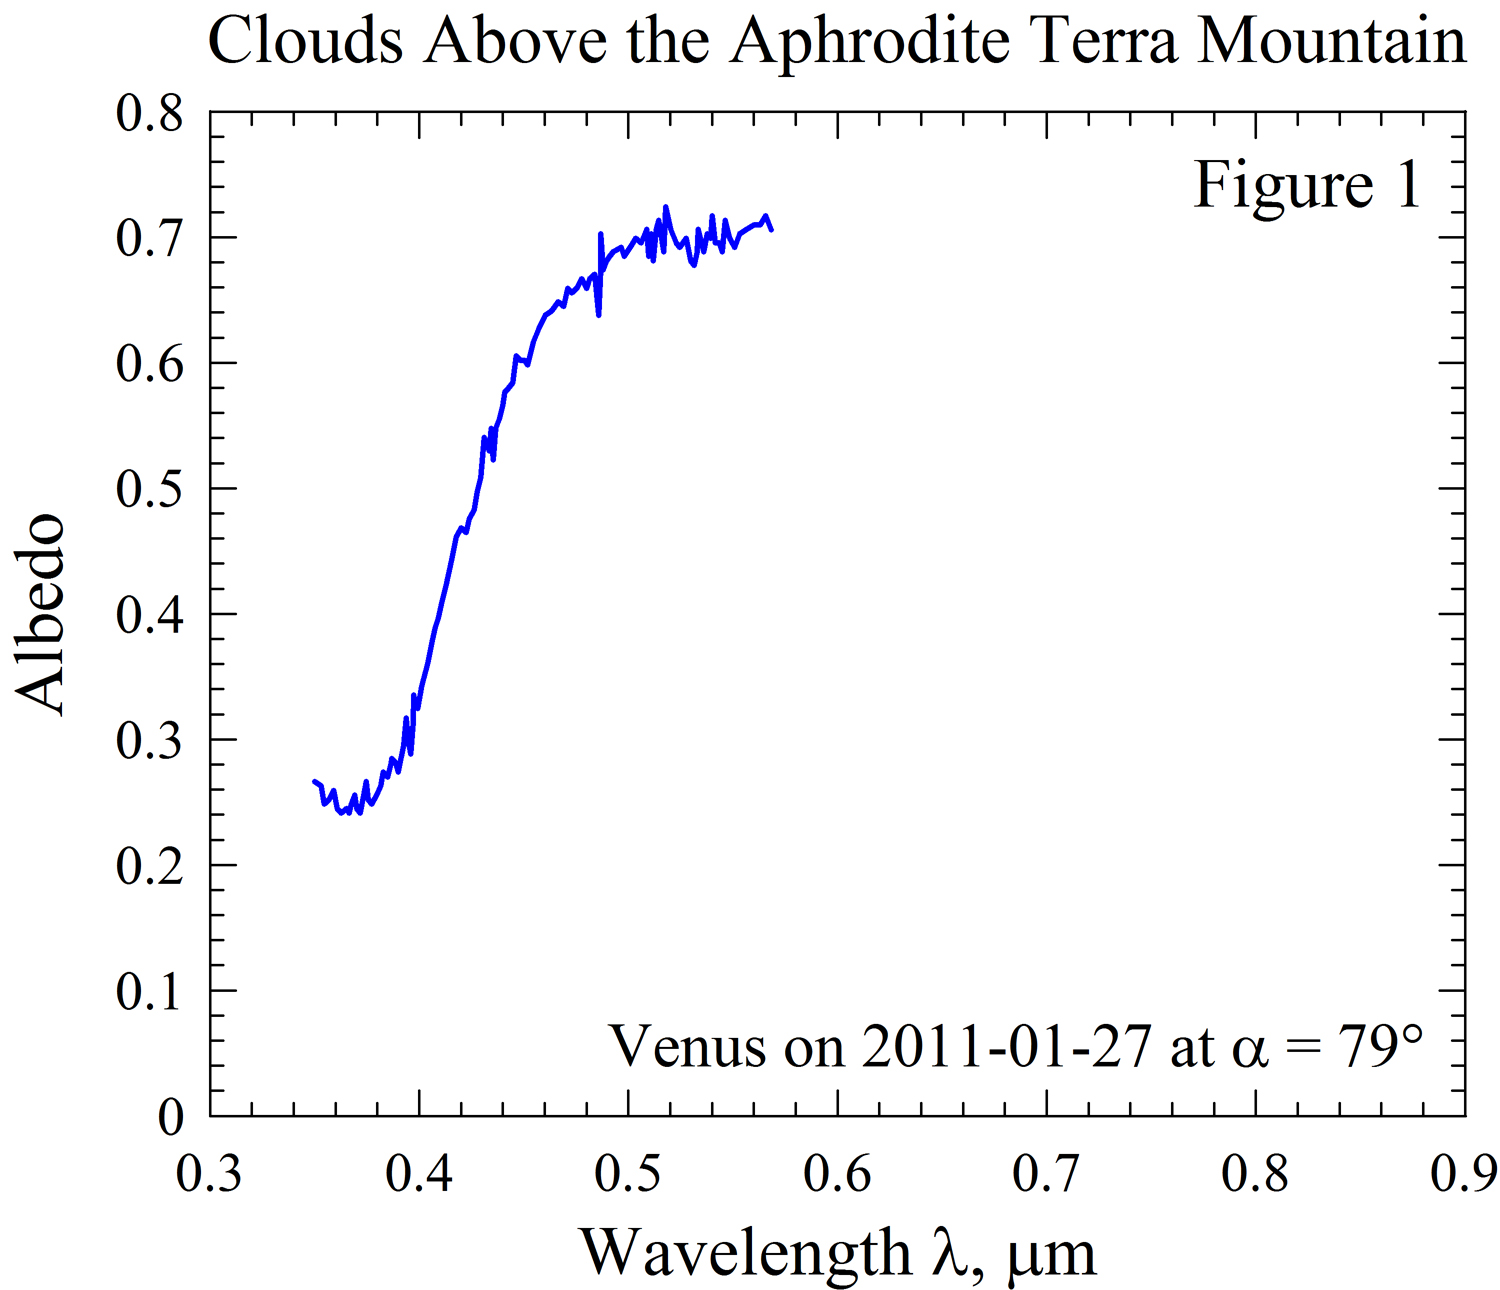
Interplanetary space in our Solar System is filled with dust. The cloud of interplanetary dust particles (IDPs) can be observed from Earth (Zodiacal Light) in places having low light pollution. IDPs continually strike the Earth atmosphere, loading a considerable amount of dust, up to 60,000 metric tons per year (Love & Brownlee 1993). It is significant that the cumulative mass input of IDPs may exceed that of large meteoroids (> 1 cm) and asteroids (< 10 km) over our historically recorded time period. However, unlike meteoroids and asteroids immediately falling onto a planet surface, IDPs settle in the upper atmosphere for a while, altering its chemical composition. It is important that due to closer heliocentric distance Venus is expected to gather about twice higher load of interplanetary dust as compared to Earth, i.e., 120,000 metric tons per year. As reasoned by Nesvorný et al. (2010), IDPs have mainly cometary origin and, hence, they may consist of primordial material(s). Interestingly, polarimetric observations of exploding and split comets reveal predominantly carbonaceous-dust composition of their nuclei (e.g., Zubko et al. 2011; 2020). A common feature of these species of comets is that their material absorption in the visible is greater at shorter wavelengths. Therefore, these species could appear consistent with the strong spectral gradient observed spectrum of Venus, and attributed to the unknown UV absorber. Here, we investigate material kerogen, whose optical constants were reported by Khare et al. (1990). Note, wavelength dependence of the imaginary part of refractive index Im(m) in kerogen closely matches what was measured in the Murchison meteorite Khare et al. (1990). As such, a similar wavelength dependence of Im(m) was inferred in comets (e.g., Zubko et al. 2011).
Using our own code implementing the Mie theory (e.g., Bohren & Huffman 1983), we study scattering and absorption of light by spherical particles having two types of chemical composition: (1) pure kerogen and (2) uniform mixture of 10% kerogen (by volume) and 90% typical composition of the aerosol particles in atmosphere of Venus (i.e., mixture of 75% sulfuric acid and 25% water).
Refractive index of pure kerogen is adapted from Khare et al. (1990); whereas, refractive index of typical Venusian aerosol is taken from Palmer & Williams (1975). Refractive index of their mixture is obtained using the Bruggeman effective-medium theory (e.g., Bohren & Huffman 1983). Particles of both types obey the same power-law size distribution r–n at n = 2. Radius of particles spans the range from r = 0.05 μm up to 2 μm with increment Δr = 0.05 μm. Such size distribution closely matches the in situ finding in the upper cloud layer of Venus (Knollenberg and Hunten 1980). Figure 2 shows spectra of efficiency of absorption Qabs and scattering Qsca, the single-scattering albedo ω, the albedo Ap at phase angles 0°, 30°, and 90°. Note, Ap is defiend as a product of the geometric albedo A and the phase function normalized at 0°. As one can see in Figure 2, both types of particles reveal qualitatively similar wavelength dependence of their albedo at all phase angles. They do suggest an absorption band near UV that gets quickly dampened at larger wavelength, resembling what emerges from the unknown UV absorber in Figure 1. Searching for quantitative fit to observations is a subject for our further research.
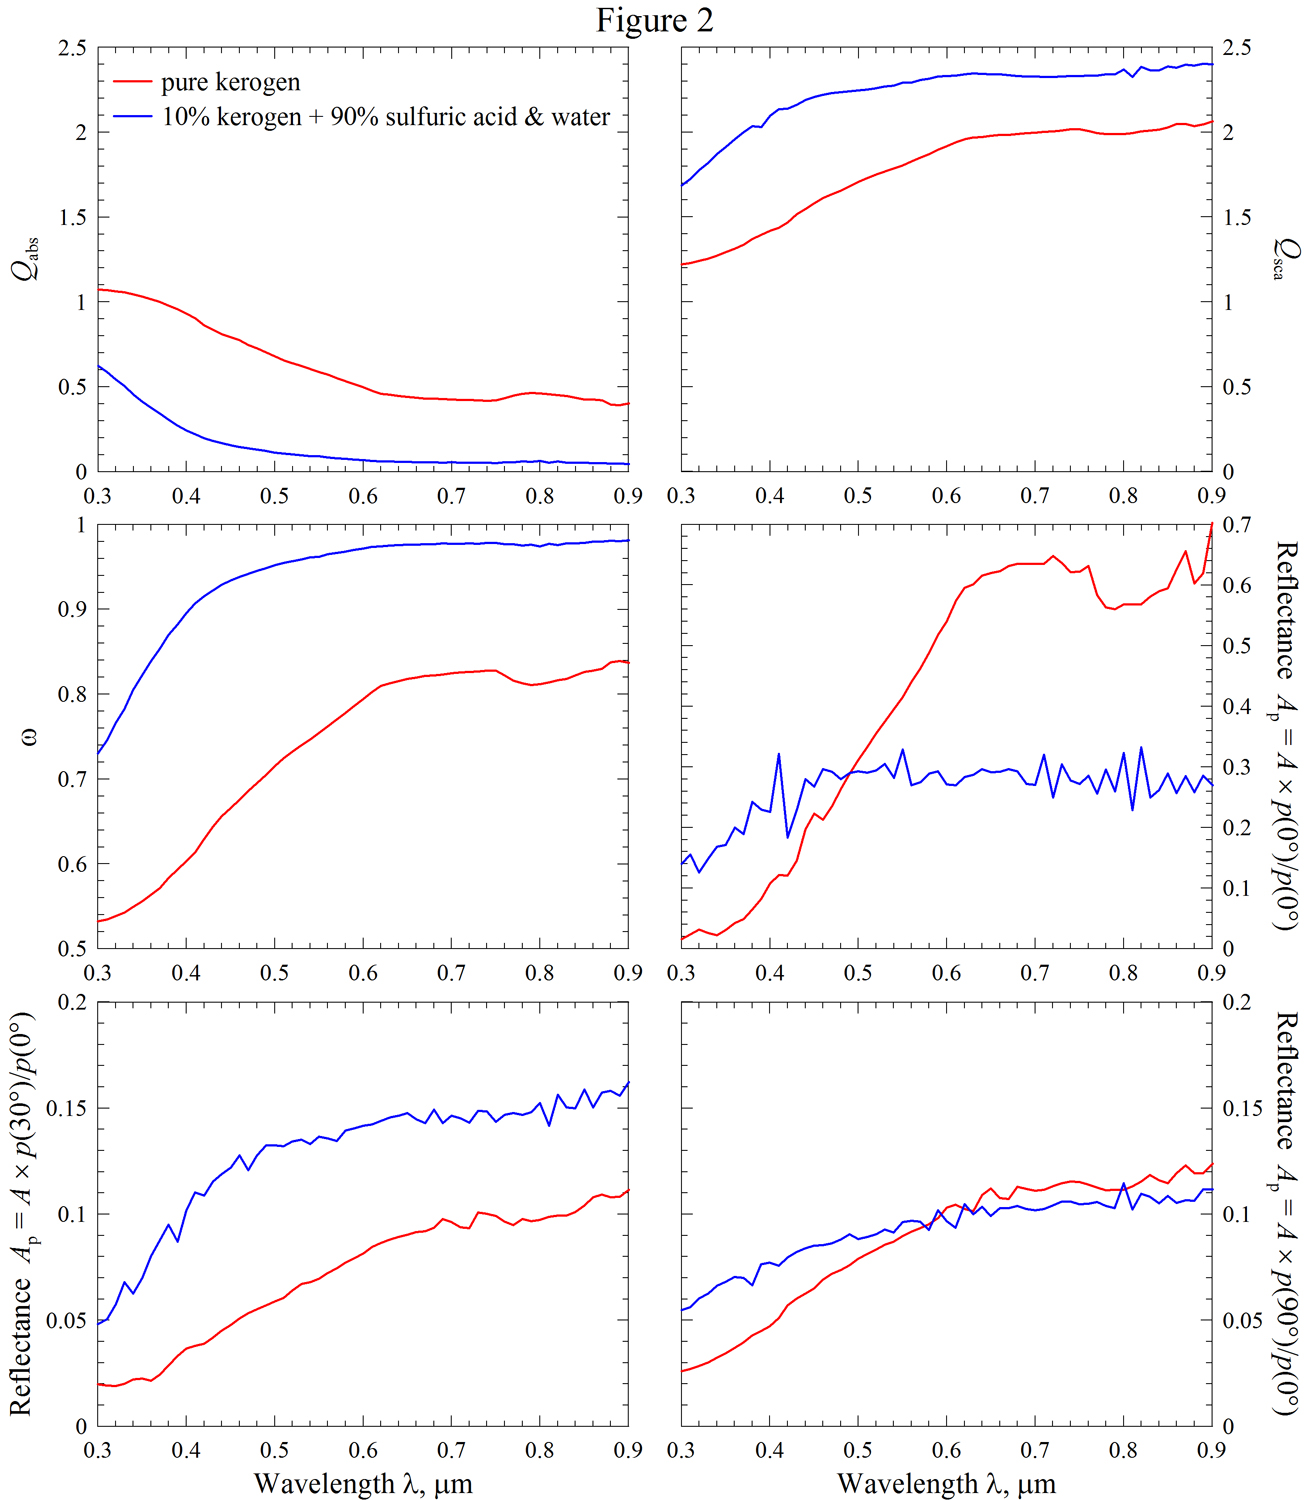
References
Bohren C. F., Huffman D. R., 1983, Absorption and Scattering of Light by Small Particles. Wiley, New York, USA
Jessup K.-L., et al. 2020, Icarus, 335, 113372
Khare et al. 1990, LPSC, 21, 627
Knollenberg R.G., Hunten D.M. 1980, J. Geophys. Res., 85, 8039
Lee Y.J., et al. 2015, Icarus, 253, 1
Love S.G., Brownlee D.E. 1993, Science, 262, 550
Nesvorný D., et al. 2010, Astrophys. J., 713, 816
Palmer K.F., Williams D. 1975, Appl. Opt., 14, 208
Pollack J.B., et al. 1980, J. Geophys. Res., 85, 8141
Zubko et al. 2011, J. Quant. Spectrosc. Radiat. Transfer, 112, 1848
Zubko et al. 2020, Mon. Not. Roy. Astron. Soc., 497, 1536
How to cite: Zubko, E. and Lee, Y. J.: On interplanetary origin of the unknown UV absorber in the atmosphere of Venus, Europlanet Science Congress 2024, Berlin, Germany, 8–13 Sep 2024, EPSC2024-284, https://doi.org/10.5194/epsc2024-284, 2024.
The study of the atmospheres of the nearest planets to Earth, Venus and Mars, is of major importance for the understanding of the solar system formation and evolution, as well as the history of Earth. That is why, since the 1960s, numerous space missions have been dedicated to such studies, through the sending of space probes or landers, having ever-increasing spectral resolution and improved signal-to-noise ratio. This is also true for ground-based observation facilities, which provide atmospheric spectra of indisputable quality. However, the constant improvement of observation instruments requires the use of suitable spectroscopic data, at the risk of making an error during atmospheric retrieval process. In the case of the H2O molecule, found in small amounts in the atmospheres of Mars and Venus, many radiative transfer models use the air-collisional parameters, instead of the CO2-collisional parameters for the water vapor lines, due to a lack of spectroscopic data. The aim of this study is therefore to contribute to the development of a list, as complete as possible, of CO2-collisional parameters for H2O, following our previous article [1], and therefore to assess its impact on the study of atmospheric spectra.
To this end, new H2O broadened by CO2 spectra were recorded at room temperature using the GSMA high-resolution Fourier transform infrared spectrometer in several spectral regions of atmospheric interest. Isolated H2O lines were then selected, and their CO2-collisional parameters determined using a multi-spectral fitting procedure. Different line shape profiles were used: Voigt, Rautian, quadratic speed-dependent Voigt and quadratic speed-dependent Rautian. The three latter consider fine physical effects leading to better reproduce the experimental line shape profile [2]. The collisional half-width parameters obtained with Voigt profile were used to determine the interaction potential for the H2O-CO2 molecular system. The semi-classical Modified Complex Robert-Bonamy formalism was then used to calculate the half-widths and line shifts for a large number of lines.
In the context of the future European space mission to Venus, and future observations by the VenSpec-H onboard infrared spectrometer, the calculated H2O broadened by CO2 linelist was then used to simulate atmospheric spectra of Venus, in two different transparency windows, using the Asimut radiative transfer model [3]. The first spectra window is located around 1.17 µm and will be used to perform observation on the nightside of Venus, under the thick cloud layer, in the low troposphere, between 0 and 15 km of altitude. The infrared signal is weak as it is emitted by the surface and the different hot atmospheric layers. The second spectral region simulated is around 2.34 µm. It will be useful to observe both the nightside, from 30 to 45 km, i.e. under the cloud layer, and the dayside, from 65 to 80 km, i.e. above the cloud layer. The dayside will provide a stronger infrared signal because of the aerosols in the Venusian clouds, which reflect a large part of solar infrared radiation passing through the mesosphere back to space, and thus to the instrument in orbit. The simulated atmospheric spectra were used to retrieve water vapor atmospheric concentration and to investigate the error made using the air-collisional parameters for H2O lines in a CO2-rich environment. Samples of 1000 spectra were used to obtain a 1% statistical error on retrieved parameters. Gaussian random noise was added to the samples corresponding to a chosen signal-to-noise ratio. In order to observe the dependence of the error made in function of the signal-to-noise ratio selected, the initial guess of water vapor concentration given and the standard deviation of the fit, these parameters were modified for each spectra sample. The results showed that using air-collisional parameters can lead to significant difference in the retrieved H2O concentration in the Venus atmosphere. It is therefore necessary to continue measuring the CO2-collisional parameters for H2O lines, for the benefit of the planetary community. To conclude, this study is also planned for the second isotopologue of water vapor, HDO, also present in trace form in the atmospheres of our planetary neighbors.
[1] L. Régalia et al., Laboratory measurements and calculations of line shape parameters of the H2O–CO2 collision system, JQSRT 231 (2019)
[2] É. Ducreux et al., Measurements of H2O broadened by CO2 line-shape parameters: beyond the Voigt profile, JQSRT Accepted (2024)
[3] A.C. Vandaele et al., Modeling and retrieval of atmospheric spectra using Asimut, Conference Proc. of the First ‘Atmospheric Science Conference’, ESA SP-628 (2006)
How to cite: Ducreux, É., Régalia, L., Grouiez, B., Lepère, M., Vispoel, B., Gamache, R., and Robert, S.: Investigating the impact of using CO2-collisional parameters in atmospheric water vapor retrievals, Europlanet Science Congress 2024, Berlin, Germany, 8–13 Sep 2024, EPSC2024-663, https://doi.org/10.5194/epsc2024-663, 2024.
At the cloud top of the Venus atmosphere, mid-latitude Rossby waves have been observed. They are considered to play an important role in the maintenance of the super-rotation. Here, we reproduce those waves in a general circulation model named AFES-Venus (Atmospheric GCM for the Earth Simulator for Venus [1]) by conducting an observing system simulation experiment with the help of a data assimilation technique (ALEDAS-V: AFES–LETKF Data Assimilation System for Venus [2]). The synthetic observations of horizontal winds associated with the Rossby wave are produced by a linear wave propagation model, and they are assimilated at the cloud top (~70 km) for 30 Earth days in realistic conditions, assuming they are derived from the cloud tracking of the ultra-violet images taken by the Venus climate orbiter “Akatsuki”. It is demonstrated using Eliassen–Palm fluxes that enhanced Rossby wave in the mid-latitudes induces a deceleration in zonal-mean zonal wind. After the stop of data assimilation, the model fields reached another quasi-equilibrium state within about 10 Earth days, indicating that the “memory” of assimilated observations can be kept for a while even new observations are not available.
[1] Sugimoto, N., M. Takagi, and Y. Matsuda (2014a), J. Geophys. Res. Planets, 119, 1950–1968.
[2] Sugimoto, N., A. Yamazaki, T. Kouyama, H. Kashimura, T. Enomoto, and M. Takagi (2017), Sci. Rep., 7(1), 9321.
How to cite: Komori, N., Sugimoto, N., Fujisawa, Y., Abe, M., Kouyama, T., Ando, H., Takagi, M., and Yamamoto, M.: Observing system simulation experiment to reproduce Rossby wave in the Venus atmosphere, Europlanet Science Congress 2024, Berlin, Germany, 8–13 Sep 2024, EPSC2024-115, https://doi.org/10.5194/epsc2024-115, 2024.
The upper atmosphere of Venus still leaves many unsolved questions. Even the thermal structure, a fundamental physical quantity of planetary atmospheres, is subject to limited observational knowledge and, moreover, there is a variation of several tens of Kelvins at altitudes above ~80 km in the results measured by Venus Express instruments and ground-based observations [e.g., 1]. This disagreement remains to be discussed whether it is indicative of actual spatial/temporal variability or whether it includes systematic biases from one instrument to another. The first and foremost challenge is to increase the number of more observational data.
To address this issue, we focus on oxygen (O2) airglow emitted at an altitude of around 95 km in the Venusian atmosphere and derive the O2 rotational temperature from its high-dispersion spectra to constrain the thermal structure at this altitude. Although observations of Venusian O2 airglow itself have been conducted for many years [e.g., 2 - 7], most of the previous studies analyzed the spatial distribution of the emission intensity using spectrometers with relatively low or moderate spectral resolutions. There are only a limited number of studies in which the rotational temperature was derived with high-dispersion spectroscopy. Most of them were conducted with spectrometers at that time, which had a narrow instantaneous spectral coverage, and only a few lines of the O2 airglow were acquired simultaneously.
A new and sensitive Venusian O2 airglow observation became a reality with the recent installation of a new instrument, named WINERED, on the Magellan Clay 6.5-m telescope in the Las Campanas Observatory, Chile. WINERED is a cross-dispersed echelle spectrograph with a very high throughput [8]. It achieves high spectral resolution (resolving power of 28,000 or 70,000) with a sufficiently wide instantaneous wavelength coverage that captures the entire O2 emission lines at the 1.27-micron band. This should significantly improve the precision and accuracy of the rotational temperature derivation. Needless to say, the high spatial resolution of the Magellan telescope and the high sensitivity of WINERED are beneficial for mapping the O2 rotational temperature.
To assess the performance of Magellan/WINERED for Venusian O2 observations with the aim of realizing long-term continuous observations in the future, we carried out pilot observations in June and November 2023 when Venus was in favorable positions for the airglow observation. It was confirmed that spectra of O2 airglow emission can be obtained with sufficient quality for scientific analysis, although stray light contaminations from the dayside of Venus exist. The stray light from the dayside can be quantitatively evaluated by using the CO2 absorption lines near 1.21 micron, a wavelength range where the emission from the Venus nightside should not be detected. This talk will discuss the results of these initial observations and our plan for future continued observations.
References: [1] Limaye et al. (2017), Icarus, 294, 124 - 155. [2] Connes et al. (1979), ApJ, Part 2, 233, p. L29 - L32. [3] Crisp et al. (1996), Journal of Geophysical Research, 101, p. 4577 - 4594. [4] Ohtsuki et al. (2008), Planetary and Space Science, 56, p. 1391 - 1398. [5] Bailey, et al. (2008), Icarus, 197, p. 247 - 259. [6] Krasnopolsky (2010), Icarus, 207, p. 17 - 27. [7] Gérad et al. (2014), Icarus, 236, p. 92 - 103. [8] Ikeda et al. (2022), Publications of the Astronomical Society of the Pacific, 134, id.015004, 39 pp.
How to cite: Sagawa, H. and Sarugaku, Y. and the WINERED Team: Oxygen airglow in the Venusian upper atmosphere: High-spectral resolution spectroscopy using WINERED, Europlanet Science Congress 2024, Berlin, Germany, 8–13 Sep 2024, EPSC2024-1057, https://doi.org/10.5194/epsc2024-1057, 2024.
Radio occultation measurements conducted at Venus have yielded invaluable insights into the atmospheric properties of the planet. Among the intriguing phenomena observed during these measurements is radio scintillation, marked by rapid fluctuations in signal intensity. These scintillations arise from small-scale irregularities in the refractive index, which are associated with corresponding variations in atmospheric density. One possible cause of these variations is the presence of vertical propagating internal gravity waves.
The frequency-dependent nature of radio scintillations has been observed at altitudes characterized by enhanced atmospheric stability, where the propagation of gravity waves is facilitated. Thus, gravity waves offer a plausible explanation for the occurrence of radio scintillations. Analyzing radio scintillations provides valuable information regarding the intensity and global distribution of gravity waves.
During the period from 2006 to 2014, the Venus Express mission probed the atmosphere of Venus using X- and S-band radio waves. In this study, we present the characteristics of radio scintillations observed in the X- and S-band radio signals from Venus Express. Additionally, we examine latitudinal and temporal variations and compare them with the variations evident in temperature profiles derived from Venus Express radio occultation measurements. Furthermore, we offer comparisons with previous observations of radio scintillations.
How to cite: Oschlisniok, J., Pätzold, M., Tellmann, S., and Häusler, B.: Radio Scintillations observed during Venus Express radio occultation measurements, Europlanet Science Congress 2024, Berlin, Germany, 8–13 Sep 2024, EPSC2024-721, https://doi.org/10.5194/epsc2024-721, 2024.
RIU-Planetary Research is reprocessing original data from the Pioneer Venus Orbiter radio science experiment ORO which were recorded between 1979 and 1988. These valuable raw open-loop data are available from the PDS (Planetary Data System). However, the original processed atmospheric and ionospheric profiles from the Venus atmosphere are not available on the PDS.
A limited selection of original ORO profiles, primarily comprising electron density profiles, with only a few temperature profiles, was obtained from an NSSDC server and published by Withers et al. (2020) on a Boston University server.
We are using state-of-the-art software code along with an updated version of the Venus gravity field (Konopliv et al., 1999) and newly processed PVO orbit data provided as SPICE kernels.
The longer open-loop observation sets consist of ingress data (at two-way) and egress data (at one-way). The uplink was performed at S-band, while the downlink was coherent dual-frequency S-band and X-band. The X-band downlink was activated just before entering occultation, resulting in a relatively short baseline.
We shall present atmospheric and ionospheric profiles derived from S-band and differential Doppler recordings, respectively, processed from the original Pioneer Venus Orbiter raw open-loop data sets. We will then compare these profiles with VEX-VeRa radio occultation profiles obtained under comparable observation conditions, as well as with the few existing original PVO profiles retrieved from the Boston University server account (Withers et al., 2020).
The VEX-VeRa profiles show excellent agreement with the reprocessed ORO profiles under similar observation conditions. However, the few original ORO profiles exhibit a noticeable altitude shift of several kilometers, most likely caused by the less precise PVO orbit solution available at the time of observation.
How to cite: Pätzold, M., Hahn, M., Oschlisniok, J., Peter, K., and Tellmann, S.: Reprocessing the Pioneer Venus radio occultation data, Europlanet Science Congress 2024, Berlin, Germany, 8–13 Sep 2024, EPSC2024-1008, https://doi.org/10.5194/epsc2024-1008, 2024.
Please decide on your access
Please use the buttons below to download the supplementary material or to visit the external website where the presentation is linked. Regarding the external link, please note that Copernicus Meetings cannot accept any liability for the content and the website you will visit.
Forward to presentation link
You are going to open an external link to the presentation as indicated by the authors. Copernicus Meetings cannot accept any liability for the content and the website you will visit.
We are sorry, but presentations are only available for users who registered for the conference. Thank you.
Please decide on your access
Please use the buttons below to download the supplementary material or to visit the external website where the presentation is linked. Regarding the external link, please note that Copernicus Meetings cannot accept any liability for the content and the website you will visit.
Forward to session asset
You are going to open an external link to the asset as indicated by the session. Copernicus Meetings cannot accept any liability for the content and the website you will visit.
We are sorry, but presentations are only available for users who registered for the conference. Thank you.