
Towards understanding spectral and physical characteristics of lunar pyroclastics
 1,2,3,
- 1Physical Research Laboratory, Planetary Sciences Division, India (samratmisra.18@gmail.com)
- 2Indian Institute of Technology Gandhinagar, Gandhinagar, 382055, India
- 3Image Analysis Group, TU Dortmund University, 44227 Dortmund, Germany
- 4Department of Earth Sciences, Indian Institute of Technology Roorkee, Roorkee, 247667, India
- 5Centre for Space Science and Technology, Indian Institute of Technology Roorkee, Roorkee, 247667, India
Introduction: Dark mantle deposits (DMDs) are one of the lunar lithological units commonly composed of mafic minerals mixed with pyroclasts [1,2]. Lunar pyroclasts in the form of partially crystallized Fe-Ti bearing volcanic glasses provide records of the early history of lunar volcanism [3]. DMDs of diverse nature in terms of their mineralogy and physical characteristics indicate complex nature of lunar explosive volcanism which is not yet fully understood.
This study focuses on regional (>1000 km2) pyroclastic deposits around Sinus Aestuum (12.1˚ N, 8.3˚ W) and Aristarchus (23.7˚ N, 47.5˚ W) regions and local deposits (<1000 km2) at Atlas (46.3˚ N, 44.9˚ E) and Alphonsus (13.4˚ S, 2.8˚ W) craters.
Data and methods: We constructed reflectance mosaics of the study regions using level-2 spectral reflectance data of the Moon Mineralogical Mapper (M3) onboard Chandrayaan-1 [6] for carrying out the mineralogical analysis. We prepared false color composite (FCC) (Fig. 1) images of these region following the methodology described in [7]. We used the Fe and TiO2 maps of [8] and [9], respectively, to assess the compositional variation over these studied regions in comparison with lunar volcanic glasses [10], mare and highland soil samples [LSCC] [11]. We acquired multiband polarimetric images of pyroclastic deposits using a monochrome industrial camera DZK 33GX250 of The Image Source company mounted on the 43 cm telescope of the Physical Research Laboratory observatory, situated at Mount Abu, India. We followed the data processing steps mentioned in [12].
Results and Discussion: Lunar volcanic glasses have overlapping spectral characteristics in the visible to near-infrared (VIS-NIR) wavelength range with other common mafic minerals (e.g., Olivine, Pyroxene) [2]. Hence, its remote detection is feasible only if more than 70 wt.% volcanic glass present in the mafic mixture [1]. Fig. 1 shows that the FCC scheme used here can identify pyroclastics successfully. DMDs are showing distinct color variation from the surroundings, presumably due to presence of volcanic glasses in the crystalline matter. Olivine-enriched mafic mixture is represented by the yellowish trend, whereas cyan color corresponds to the fresh craters with spectral signature of pyroxene. Based on the amount of pyroxene present on the surface, the shades of green are changing from one rock unit to other. Anorthositic rock type is characterized by red pixels, whereas blue pixels represent pyroxene-bearing and highly weathered mafic compositions. Though using uniform methodology over different regions, DMDs (outlined by white dashed line in Fig. 1) are reflecting variation in color, which indicates that DMDs have heterogeneous mineralogical and compositional association.
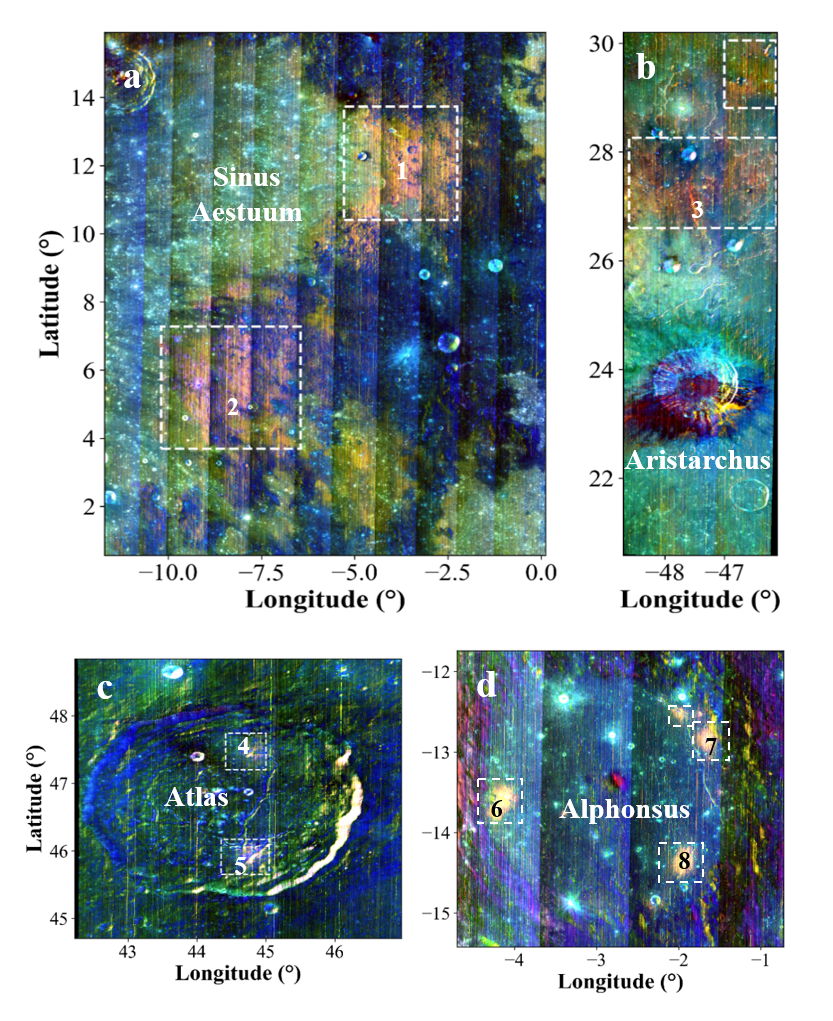
Figure 1: FCC of the M3 based mosaic around the study regions. (a) Sinus Aestuum, (b) Aristarchus, (c) Atlas, and (d) Alphonsus, respectively. The FCC color scheme is: avg. glass BD [red], avg. BD I [green], avg. BD II [blue]. The regions outlined by white dashed lines represent the DMDs.
To understand the compositional variations within DMDs exposed at different locations, we plot FeO vs. TiO2 in Fig. 2. The compositional variations of Apollo sample glasses [10] area also plotted along with lunar highland and mare soil samples in the background for a reference.

Figure 2: Average FeO variation with respect to mean TiO2 concentration around the study regions. Lunar sample data from different Apollo missions are denoted through distinct shape of legend. Highland and mare soil sample data are plotted in gray and brown color, respectively. Volcanic glasses are represented in their true color (e.g., green, yellow, orange, black, and red) except very-low Ti (VLT) glasses (marked in blue). The error bars correspond to one standard deviation.
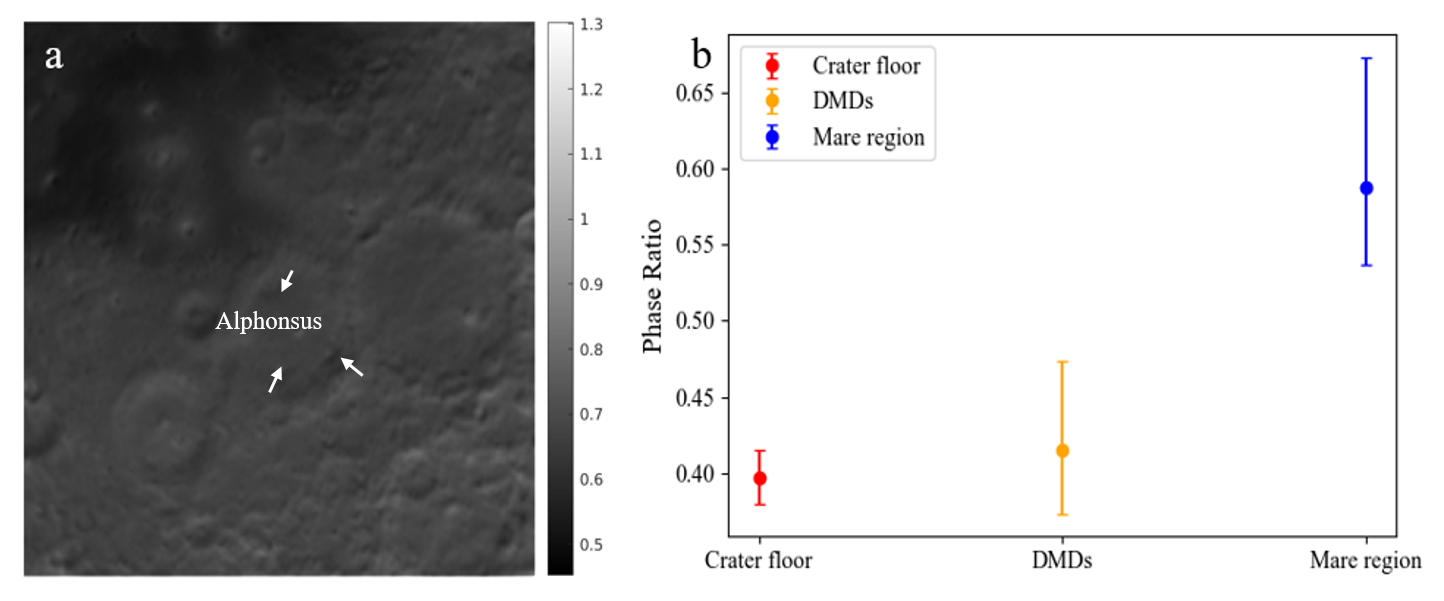
Figure 3: (a) Phase ratio intensity (19/4) image of crater Alphonsus and its surroundings in I filter. (b) Variation in average phase ratio in DMDs, crater floor, and mare region.
The regional DMDs around Aristarchus and the local deposits in Alphonsus crater have relatively high Fe and very-low to low Ti concentration, similar to the composition of reported green and VLT lunar volcanic glasses. In the case of Atlas crater, the northern deposit has very low Fe and Ti similar to Apollo 14 highland soil, whereas the southern deposit has intermediate Fe and Ti concentration, similar to the Apollo 17 mare soil. Possibly the northern deposit is more strongly contaminated by highland crater ejecta, corresponding to a heterogeneity on the surface that leads to compositional variations within DMDs across the small areal extent of Atlas crater. On the other hand, both regional deposits in the Sinus Aestuum region have high Fe and Ti concentrations. It can be inferred that the northern deposit of this region has a higher glass content, similar to the composition of orange glass, whereas in the southern deposit pyroclastic materials are less and mixed with surrounding mare composition.
Phase ratio images (Fig. 3) are a proxy to understand variation of surface roughness and porosity. As the variation range is small, we extracted average phase ratio values from the Alphonsus crater floor, nearby mare region and from DMDs (Fig. 3b). We observed that the phase ratio values of DMDs are intermediate to mare and highland regions. Further, we will be deriving polarimetric properties of Pyroclastics in the negative branch of polarization as part of the integrating framework for analyzing DMDs. The work will be extended to all DMD locations considered from nearside of the Moon.
References: [1] Horgan, B.H. et al. (2014), Icarus, 234, 132-154; [2] Bennet, K.A. et al. (2016) Icarus, 273, 296-314; [3] Gaddis, L.R. et al. (1985), Icarus, 61 (3), 461-489; [4] Head, J. W. and Wilson, L. (1979), LPSC, 10, 2861-2897; [5] Gaddis et al. (2003), Icarus, 161(2), 262-280; [6] Green et al. (2011), JGR Planets, 116 (E10); [7] Misra, D. et al. (2024), LPI Contributions, 3040, 2134; [8] Bhatt, M. et al. (2019). Astronomy & Astrophysics, 627, A155; [9] Sato, H. et al. (2017), Icarus, 296, 216-238; [10] Delano, J. W. (1986), JGR: Solid Earth, 91 (B4), 201-213; [11] Taylor, L.A., et al., 2001, JGR, 106 (E110, 27, 985-28, 000; [12] Wöhler C. et al. (2024), AJ, 167:187.
How to cite: Misra, D., Bhatt, M., Wöhler, C., Arnaut, M., Rai, N., Srivastava, N., Ganesh, S., and Bhardwaj, A.: Towards understanding spectral and physical characteristics of lunar pyroclastics, Europlanet Science Congress 2024, Berlin, Germany, 8–13 Sep 2024, EPSC2024-1085, https://doi.org/10.5194/epsc2024-1085, 2024.