Multiple terms: term1 term2
red apples
returns results with all terms like:
Fructose levels in red and green apples
Precise match in quotes: "term1 term2"
"red apples"
returns results matching exactly like:
Anthocyanin biosynthesis in red apples
Exclude a term with -: term1 -term2
apples -red
returns results containing apples but not red:
Malic acid in green apples
hits for "" in
Network problems
Server timeout
Invalid search term
Too many requests
TP12
Lunar science and exploration are developing further with new and exciting missions being developed by China, the US, Japan, India, Russia, Korea and Europe, and with new stakeholders. This session will address open lunar science and innovation:
- Celebrating the legacy of Apollo and Luna programmes after 50+ years
- Recent lunar results: geochemistry, geophysics in the context of open planetary science and exploration
- Synthesis of results from Clementine, Prospector, SMART-1, Kaguya, Chang’e 1, 2 and 3, Chandrayaan-1, LCROSS, LADEE, Lunar Reconnaissance Orbiter, Artemis and GRAIL
- First results from Chang'E 4, Chang'E 5 , Chandrayaan2,
- Goals and Status of missions under preparation: orbiters, CLPS, Luna25-27, SLIM, Commercial landers, Lunar sample return missions, Future cargo landers, EL3
- Precursor missions, instruments and investigations for landers, rovers, sample return, and human cis-lunar activities, Gateway, and human lunar surface sorties (Artemis and International Lunar Base)
- Next International Lunar Decade: databases, instruments, missions, terrestrial field campaigns, support studies
- ILEWG and Global Exploration roadmaps towards a global robotic/human Moon village
- Strategic Knowledge Gaps, and key science Goals relevant to Lunar Global Exploration
- The Moon for planetary science, life sciences, astronomy, fundamental research, resources utilisation, human spaceflight, peaceful cooperation, economical development, inspiration, training and capacity building.
- How a laboratory on the Moon should be equipped to be useful for a variety of disciplines, including geology, biology, and chemistry
- Historical, societal, humanistic aspects of lunar exploration
The EPSC 2024 TP12 Lunar Science and Exploration Open Session is co-sponsored by ILEWG, COSPAR, Moon Village Association, LUNEX EuroMoonMars, International Moonbase Alliance, EuroSpaceHub Academy, IAF committees (ITACCUS, Space Habitats, and Space Exploration), and contributes to ICEUM2024
Session assets
Introduction: Irregular Mare Patches (IMPs) [1] have a rough floor unit (FU) and meniscus-like mounds (MD). Initial Ina CSFD measurements produced ages of ~59 Ma; but Ina is closely associated with an ~3.5 Ga edifice [2]. Could IMP mounds be formed by extrusion of ancient highly vesicular magmatic foams causing impacts to be smaller by ~3X due to formation in compressible magmatic foam [2-3]. Our goal The goal is to distinguish among IMP formation theories [4] by assessing the nature, physical properties, stratigraphic relationships, and ages of Ina units (Fig. 1).
Major origin/age questions?: 1) Nature of superposed impact craters?: Formation mode, sampling depth, substrate effects on energy partitioning/subsequent degradation, influence on CSFD ages. 2) Predicted and observed regolith thicknesses?: ~59 Ma lava flows impact-generated regolith should be <1 m; MD thicknesses are ~3-5 m, but FL much less; an ~3.5 Ga basalt lava flow on the adjacent volcanic shield should be >5 m. We focus on an extremely fresh ~75m-diameter crater (Fig. 1) on the border between Ina floor and mound units.
Nature of Fresh Crater (FC): The 75 m crater rim crest outline is circular where it intersects the mound to the N-NW, slightly indented to the S-SW, and significantly indented to the SE (Fig. 1a). The crater is characterized by a central floor mound ~1-3 m high, and ranges from MD ~2-15 m deep (max d/D of 0.2, typical of small fresh mare craters) to SW FL, ~2 m deep (d/D 0.0266). The crater floor/lower walls/rim are littered with m-scale boulders.
Relative and Absolute: Boulders superposed on the main MD, the floor unit and the small SE MD indicates that the crater postdates formation of all these features and initial formation of Ina interior FL and MD units. The median survival time of lunar meter-scale ejecta boulders [5], is ~40-80 Ma, and ~150-300 Ma for ~99% of m-scale blocks. The crater absolute age is clearly in the younger range, placing one of the youngest craters in Ina close to, or greater than the ~59 Ma AMA [1].
Stratigraphy of Target Substrate: The main mound is ~10-13 m above the floor, sloping down to the E. An apparent boundary between the mound and underlying more coherent FL material is seen along the lower crater wall where boulders are exceptionally abundant. Extending adjacent floor unit topographic level laterally into the main mound, we interpret the FL unit to stratigraphically underlie the MD unit.
Characteristics of Ejecta Deposit of the Young Crater: Pre-impact target reconstruction suggests the impact point was centered on the NW MD-FL unit boundary; expanding transient cavity intersected the main MD to NW, the FL to SW and the small MD to SE, offering insights into substrate properties, regolith thicknesses/post-impact degradation. FC shows little evidence of typical fresh young maria craters ejecta deposits.
Physical Properties of Impacted Substrate: Abundance of crater rim/lower interior boulders, presence of central mound suggest that the crater excavated down into a coherent substrate [13] at 0-13 m depth across the sloping mound surface: this value exceeds both regolith thickness model estimates. The nature of the major mound surface and upper crater wall, particularly along the major mound (NNW) wall, suggest a much more incoherent, regolith-like substrate ranging up to ~13 m thick, but retarded excavation on SW FL unit (d/D = 0.0266).
Post-Formation Modification of Main Mound and Crater: A similar-sized degraded crater is observed on the main MD just W of the FC. Its shallow depth (~2 m) and lack of circum-rim boulders suggest that it is >several 100 Ma [5]. Initial analysis of the small SE MD (Fig 1a) appears to indicate that it embays the FC to its NW, indenting its rim circularity, making its formation stratigraphically younger than FC, despite its clearly higher crater density/scattered superposed surface FC boulders. Detailed examination of opposite-side imaging/DTMs, however, reveals a convex-outward topographic mound indentation consistent with FC circularity, exposed boulders along its base, and evidence for mass-wasting of SW mound material down into the FC.
Tentative Conclusions About Ina Age/Mode of Origin: There are multiple contradictions in implied ages of the FL/MD units/stratigraphic relationships: 1) FL regolith thickness (thin; <1 m), optical immaturity suggest very young age, while mound regolith thickness (>5 m) and optical maturity suggest very ancient age: yet the stratigraphic relationships indicate the MD overlie and are stratigraphically younger than the FL, and CSFD AMAs on both units indicate an extremely young age (~58 Ma). 2) MD appears composed of friable regolith-like material throughout its 0-13 m thickness. 3) Both unit fresh craters lack typical distinctive fresh mare crater ejecta. 4) Distribution of fresh crater boulders suggest a young age; possibly as old as several hundred Ma [5], clearly >58 Ma [1]. 5) Extremely degraded mound crater NW of FC much too degraded to have formed <58 Ma ago [5]; lack of surrounding boulders suggest more ancient age. 6) Extremely shallow d/D of crater SW FL part suggests very retarded excavation relative to MD material. 7) The SE DM misleading stratigraphic relationships suggests that craters at FL-MD boundaries are undercounted.
Fig. 1. (Left 3) a) (LROC M119815703); b) (LROC M113921307R); c) LROC M119815703+NAC DTM). Fig. 2. (Right 2) a) LROC M119815703 showing locations of NAC DTM profiles. b) NAC DTM profiles.
References: 1) Braden et al. (2014) Nat. Geosci. 7, 787. 2) Qiao et al (2017) Geology 45, 455. 3) Wilson & Head (2017) JVGR 335, 113. 4) Qiao et al (2017) MAPS 53, 455. 5) Basilevsky (1976) PLSC7, 1005. 6) Zhang et al, (2021) JGR-P 126, e2021JE006880.
How to cite: Head, J., Qiao, L., Ivanov, B., and Wilson, L.: Ina summit pit-crater: Geology and stratigraphy of a young impact crater and implications for unit substrate characteristics, emplacement sequence and age., Europlanet Science Congress 2024, Berlin, Germany, 8–13 Sep 2024, EPSC2024-1160, https://doi.org/10.5194/epsc2024-1160, 2024.
INTRODUCTION
A better understanding of lunar geology is critical both scientifically and practically for exploring and settling the Moon in the next decades. Improving our knowledge about the formation and evolution of the Moon helps us 1) to understand the geology of Earth and other terrestrial bodies in the Solar System, and 2) to prepare for in-situ utilisation of lunar resources. Irregular mare patches (IMPs), as well as lava tubes, pits and caves are such lunar geological phenomena that offer progress with both tasks. Even though multiple IMPs were found on the surface of the Moon, their age and formation processes remain enigmatic. Furthermore, many pits have been detected in various lunar geological settings, but it remains uncertain whether any of these openings could lead to extended cave conduits underground. The proposed Lunar Geology Orbiter LUGO aims primarily to reveal the formation ages and mechanisms of IMPs, and secondarily to identify the distribution and dimensions of lava tubes for future exploration.
WHY IRREGULAR MARE PATCHES?
Controversy surrounds the formation age of IMPs because very few impact craters are present at their surface. Whereas one scenario assumes that IMPs consist of compact igneous rocks and thus are relatively young (>100 My), another scenario assumes the existence of old (<3 Gy) but highly vesicular lava foams [1, 2]. The general shape of IMPs and their rugged landform characteristics are well known, but available Digital Terrain Models do not allow unambiguous determination of the properties of the material(s) in which the observed impact craters were formed. It is hence still impossible to distinguish between two possible scenarios for the formation of IMPs [1]. Recently, analysis of hyperspectral data revealed that darker deposits surrounding some IMPs as well as the IMP surfaces themselves contain little to no glassy material, and are barely distinguishable mineralogically from the surrounding mare material [3]. Despite these discoveries, it remains unclear how IMPs originated and what their actual age is, with far-reaching consequences for understanding the thermal evolution of small planetary bodies. For example, young age of IMPs might suggest that we could still expect volcanic eruptions on the Moon.
WHY LUNAR LAVA TUBES?
Lava tubes are underground voids that can be tens of kilometers long and tens of meters wide and are formed when the solidified roof of a lava flow remains after lava supply ends and the lava channel is drained out. Even if the detection of subsurface lava tunnels on the Moon is currently difficult [4], their existence is suggested by the presence of lunar pits, or skylights, which are collapsed features on the lunar surface with near-vertical walls. However, there is still no clear confirmation of continuations of lava tunnels from these potential entrances, and no map of their distribution exists yet. Detection of lava tubes by LUGO would enable us to evaluate their basic characteristics (size, length, depth) as well as the potential for subsurface habitat utilization in the future, where future crews would be shielded from micrometeorites and cosmic radiation [5]. The identification of lava tube dimensions and morphology together with surface observations and composition of the lava would enable estimating the effusion rate, viscosity and related temperature of lunar lava under lower specific gravity.
LUGO payloads
To achieve the objectives of LUGO, the orbiter would collect targeted imagery and topographic data of the lunar surface and subsurface at a very high resolution from a highly eccentric orbit by a quartet of payloads: a ground penetrating radar (GPR), a LiDAR, a hyperspectral camera, and a narrow-angle camera (NAC). Combining such measurements would allow to characterise: a) the regolith thickness over IMPs’ and surrounding units and hence reveal whether IMPs were formed recently or in the distant past, b) the properties of the material forming IMPs and hence to find out if they are formed by lava foams or lava flows, c) variations in their spectral compositions across the lunar surface, d) boulder density and distribution estimates as a proxy of regolith maturity, e) nature of the subsurface volcanic feeder system to IMPs. Furthermore, these payloads will allow to compare the subsurface detection of lava tubes as voids (with the GPR) with morphological indicators at the lunar surface (with the stereo-capability of the NAC). The proposed payloads could also allow unprecedented investigations of secondary geological targets such as floor-fractured craters and lunar domes. Future investigations could assess if an end-of-mission impact on an IMP target could provide critical information regarding the lithological properties of IMPs. The LUGO mission concept could provide a feasible way to explore these unknown aspects and could be adapted to fit funding and logistical restrictions. A LUGO mission would provide efficient synergies with already planned lunar missions, and will serve as a blueprint for future repeated observation missions that will help uncover the relation between the geological characteristics and structures at the lunar surface and the geological architecture of the shallow lunar crust.
ACKNOWLEDGEMENT
This study was financed in 2023 by ESA contract 4000141104 in the framework of the Open Space Innovation Platform (OSIP) obtained by TRL Space Systems s.r.o., Brno, Czech Republic.
REFERENCES
[1] Qiao, L., et al. (2021). Ina Lunar Irregular Mare Patch Mission Concepts: Distinguishing between Ancient and Modern Volcanism Models. The Planetary Science Journal, 2, 66.
[2] Wilson, L., & Head, J. W. (2017). Eruption of magmatic foams on the Moon: Formation in the waning stages of dike emplacement events as an explanation of “irregular mare patches”. Journal of Volcanology and Geothermal Research, 335, 113-127.
[3] Vannier, H., et al. (2024). Constraining formation hypotheses for irregular mare patches on the Moon with orbital reflectance spectra. Journal of Geophysical Research: Planets, 129, e2023JE008108.
[4] Wagner, R. V., and Robinson, M. S. (2022). Lunar pit morphology: implications for exploration. Journal of Geophysical Research: Planets, 127(8), e2022JE007328.
[5] Naito, M., et al. (2020). Radiation dose and its protection in the Moon from galactic cosmic rays and solar energetic particles: at the lunar surface and in a lava tube. Journal of Radiological Protection, 40(4), 947.
How to cite: Poppe, S., Broz, P., Sofge, K., Kereszturi, A., Losiak, A., Hauber, E., Divoký, M., Kohout, T., Hargitai, H., Bohovic, R., Viru, J., Pajusalu, M., Carrer, L., Bruzzone, L., Gomes, R., Peace, J., Saimoon Islam, Q., Sauro, F., and Fernando, B.: Studying lunar Irregular Mare Patches and lava tubes with the Lunar Geology Orbiter, Europlanet Science Congress 2024, Berlin, Germany, 8–13 Sep 2024, EPSC2024-1275, https://doi.org/10.5194/epsc2024-1275, 2024.
Introduction: Limited modern day laboratory far-ultraviolet (FUV) reflectance data of minerals, ices, and a near absence of Apollo soil measurements beyond those collected a few decades ago [1, 2], has hindered a more complete understanding of the lunar surface observations returned by the Lunar Reconnaissance Orbiter’s Lyman-Alpha Mapping Project (LRO-LAMP) relative to other instruments. Measurements in the FUV are demanding compared to measurements in the near-ultraviolet (NUV) through thermal infrared (TIR), due to vacuum requirements and far lower signal available. However, since LAMP and the LRO Camera Wide Angle Camera (WAC) have been returning observations, the researchers of the lunar FUV have begun collecting topics that necessitate further investigation in a laboratory to gather additional context.
Recent work at APL’s Laboratory for Spectroscopy under Planetary Environmental Conditions (LabSPEC) and SwRI’s Southwest-ultraviolet reflectance chamber (SwURC) facilities have been at the forefront to remedy this. Recent examinations of minerals, glasses, analogs, lunar soil simulants, and Apollo soils are under way or recently published [3-5]. Here, we examine the lunar highland Apollo soils 61220, 61141, and 62231. These lunar soils were selected to examine maturity in the FUV and in comparison with the MUV through the mid-infrared (MIR). They have similar low-iron and low-titanium chemistries, and a range of maturities with Is/FeO intensities of 9.2, 56, 91 for 61220, 61141, and 62231, respectively [6].
Methods: Spectra were collected in the APL LabSPEC facility under high vacuum conditions (10-6-10-7 Torr). FUV-NUV data were collected using a McPherson monochromator (130-570 nm) using MgF2 as the standard and a scintillating material in front of a photomultiplier tube attached to chamber. VIS-NIR data are collected using a Spectra Vista Corporation (SVC) HR-1024i point spectrometer (350-2500 nm) using MgF2 as the standard. MIR data are collected with a Bruker Vertex 70 lab FTIR (1.8-8 μm) using diffuse Au as the standard. Both use a halogen light source with beam splitters (Quartz, KBr) and both spectrometers are mounted outside the chamber at dedicated ports 60° from the light source (i=15°, e=45°). The SVC and FTIR detectors are mounted on a linear stage that allows toggling between the two spectrometers. A full UV to MIR (~0.13 to ~8 μm) spectrum is generated by combining 3 spectral ranges, scaled to the SVC VIS.
Results: Starting in the familiar NIR to MIR (Fig. 1a), samples 61220, 61141, and 62231 show what is expected of their maturities. Samples 61141 and 62231 show the darkened albedo and reddened spectral slopes recognized in maturing soil samples. The 3 μm water absorption feature may show slight attenuation, pending confirmation. In the VIS (Fig. 1b), these characteristics continue, but the differences in albedo between sample spectra decrease, particularly for the submature and mature samples (61141 & 62231). This gradual decrease in albedo difference continues in the NUV until there no longer appears to be a statistical difference between 61141 and 62231 in the MUV (~225 nm; Fig. 1c). In the FUV (Fig. 1d), any remaining differences between immature, submature, and mature Apollo soils samples is gone by ~160 nm. Measurements <150 nm can be collected (Fig. 1d), but signal is insufficient here.
Discussion: The potential implications of these measurements are consequential for our understanding of the lunar surface. The darkening and lessening of differences in albedo and slope between lunar soils of differing maturity levels moving from the MIR to the UV, particularly the dramatic changes in the transition from the VIS to NUV, is not new. However, these measurements do appear to confirm that the UV, and the MUV to FUV in particular, are more sensitive to the effects of space weathering on airless body soils [7]. In fact, conditions and samples measured here present an inability to differentiate submature from mature soils. However, these measurements do potentially explain differences between LRO’s LAMP and LROC WAC. For example, on the global Moon only younger craters, like Copernican and younger (Tycho, Jackson, etc.), are observable. More specifically, Reiner Gamma shows differences in a swirl, or albedo difference, between LAMP FUV and the WAC NUV. In particular, where magnetic intensity lessens in the southern and northern ‘limbs’ of Reiner Gamma (Fig. 2), it is more difficult to definitively detect these regions of the swirl with LAMP [8]. Waller et al. [8] suggest this may be due to lessened solar wind stand-off as a result of solar wind variability, where submature and mature sample trends are indistinguishable in the FUV (Fig. 1). However, these surface regions still possess “swirl-like” patterns detectable by WAC NUV because of ongoing solar wind standoff reducing weathering, where submature and mature sample trends become more discernable in the NUV-MIR (Fig. 1). However, this stands in contrast to reports by [9, 10] of photometric anomalies and swirls being detected by LAMP but not necessarily by the LROC WAC. In fact, the laboratory measurements collected here initially suggest the opposite effect. In this context, it is important to note those observations were made during a different nighttime context, under hemispheric (interplanetary medium + starlight) rather than point illumination conditions, and deeper in the FUV at Lyman-a (121.6 nm). The Apollo laboratory spectra collected here demonstrate that at those low wavelengths, below ~150 nm, a different scattering regime is dominating. Additional FUV laboratory measurements are necessary.
On-Going Work: Further TEM and EELS examination of grains of each lunar sample is underway at the JHU Materials Characterization and Processing (MCP; https://engineering.jhu.edu/MCP/) facility.
References: [1] Lucke (1976) AJ, 81, 1162 [2] Wagner (1987) Icarus, 69, 14. [3] Hibbitts & Stockstill (2018) AAS/DPS, 50, 504-2, [4] Raut (2018), JGR. [5] Gimar (2022) JGR, 127, (11). [6] Morris (1978) LPSC, 2287. [7] Hendrix & Vilas (2006) AJ, 132, [8] Waller (2022) FASS., 9, fspas.2022.926018. [9] Cahill (2019) JGR, 2018JE005754, [10] Cahill (2017) LPSC, 48, 2947.
Figure 1: Immature (black), sub-mature (green), and mature (red) Apollo 16 lunar highlands soils.
Figure 2: Observations of Reiner Gamma lunar swirl in LROC WAC NUV and LAMP FUV off/on band ratio.
How to cite: Cahill, J., Cahill, K., Hibbitts, K., Livi, K., Ramprasad, T., Waller, D., and Retherford, K.: Implications for interpreting LRO LAMP observations from an examination of Apollo lunar soils spectroscopically and microscopically, Europlanet Science Congress 2024, Berlin, Germany, 8–13 Sep 2024, EPSC2024-1337, https://doi.org/10.5194/epsc2024-1337, 2024.
Introduction: The composition and provenance of the materials in South Pole - Aitken Basin (SPA) on southern farside is essential to a number of unresolved science questions relevant to lunar and solar system evolution. The Chang’E-4 mission is the first landed mission to this unexplored region, which provide a unique chance to further constrain the composition and provenance of the lunar interior [1].
There is still controversy about the composition and provenance of materials in Chang 'e-4 landing site [1-7]. The first spectral interpretation results based on the Modified Gaussian Model (MGM) indicate that the landing site is dominated by Low-Ca Pyroxene (LCP) and olivine, which may represent deep-seated materials potentially from the lunar mantle, delivered to the Chang’E-4 landing site by ejecta from the Finsen crater [1-3]. The Hapke model was also used to infer the minerals and glasses’ abundances, which indicated that the landing site is dominated by plagioclase and lesser amount of mafic minerals [4-6]. Other study suggests that the composition of the landing site is still dominated by mare materials, which may be excavated and delivered by Zhinyu Crater [7].
The Yutu-2 rover has been exploring on the lunar surface for more than 60 lunar days, lots of in-situ spectra have been obtained, we will use these in-situ spectral data, orbiting spectral data (M3) and Apollo lunar soils' spectral data in the laboratory to perform a detailed survey on the composition and provenance of materials on the Yutu-2 rover tranverse.
Data and methods: Over 60 lunar days’ data of the Visible and Near-Infrared Imaging Spectrometer (VNIS) on the Yutu-2 lunar rover and the orbiting spectral data of the Moon Mineralogical Mapper (M3) are used. The VNIS data have been processed by dark current subtraction, flat field and instrument temperature correction, radiometric correction, reflectance calculation and spectral smoothing [1], etc. After deducting some data affected by terrain shadows and scattered light, a total of 131 spectral data of lunar soils were selected. For M3 data, the spectral data of some fresh impact craters in the ejecta area of Finsen impact crater and the inner area of Zhinyu impact crater are selected. The location and spectral curves of M3 data are shown in Figure 1. Besides, the spectral data of lunar soils (mare and highland) obtained by Relab are also used.
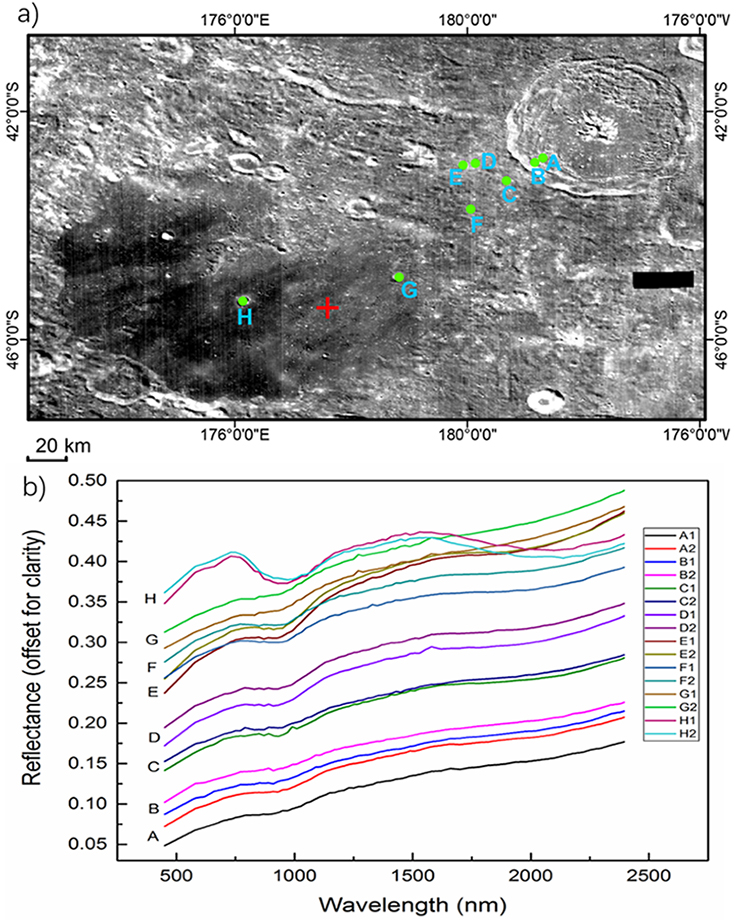
Figure 1: The location of typical spectra of the selected M3 data. a) the spectral data locations of the fresh impact craters selected along the wall of Finsen impact crater (points A and B) and along the direction of ejecta (points C-G), H point located in side of Zhinyu impact crater. b) Typical spectral curves of the selected M3.
Results and discussion: We firstly calculated the absorption bands of VNIS, M3 and Relab data at ~1μm and ~2μm, the results show that the absorption bands of VNIS at ~1μm and ~2μm are different from M3 and RELAB data (Figure 2). The absorption bands of VNIS at ~1μm are mainly concentrated in the range of 0.95~1.0μm, while the absorption bands at ~2μm are mainly concentrated in the range of 1.95~2.1μm. The absorption bands of VNIS at 2μm is lower than that of the M3’s H point in the Zhiyu impact crater, and is closer or even shorter than that of M3’s A~G points in the Finsen impact ejecta. However, the absorption bands of VNIS at ~1μm is significantly higher than that of Finsen impact ejecta (A~G points) and Zhinyu impact crater (H points). The ~2μm absorption bands results indicate that the composition of the Chang 'e-4 landing site may be closer to the impact ejecta of Finsen crater, but the ~1μm absorption bands results are different from that of the impact ejecta of Finsen crater. In order to further constrain the composition, the ~1μm asymmetry parameters are also calculated [8], and the results indicate that the Chang 'e-4 landing site may be rich in olivine or glass components (Figure 3).
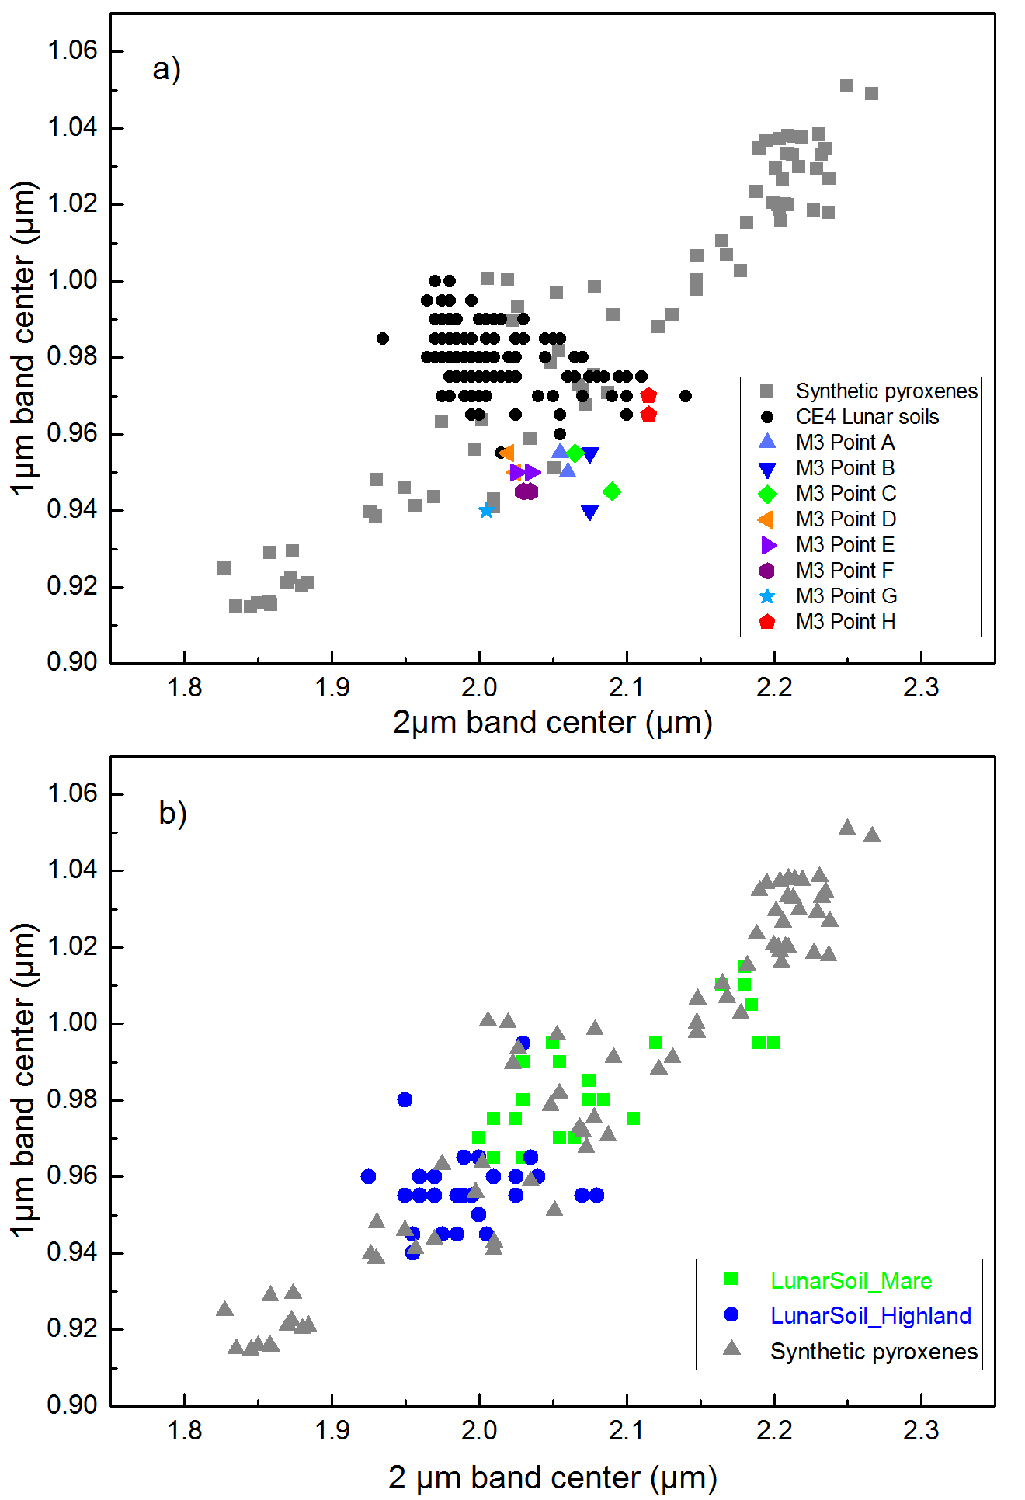
Figure2: Plot of the absorption bands of VNIS, M3 and Relab spectral data at ~1μm and ~2μm. a) The black data points are VNIS spectral data, and the color data points are M3 spectral data selected in the ejecta direction of Finsen impact crater and Bajie / Zhinyu impact crater.
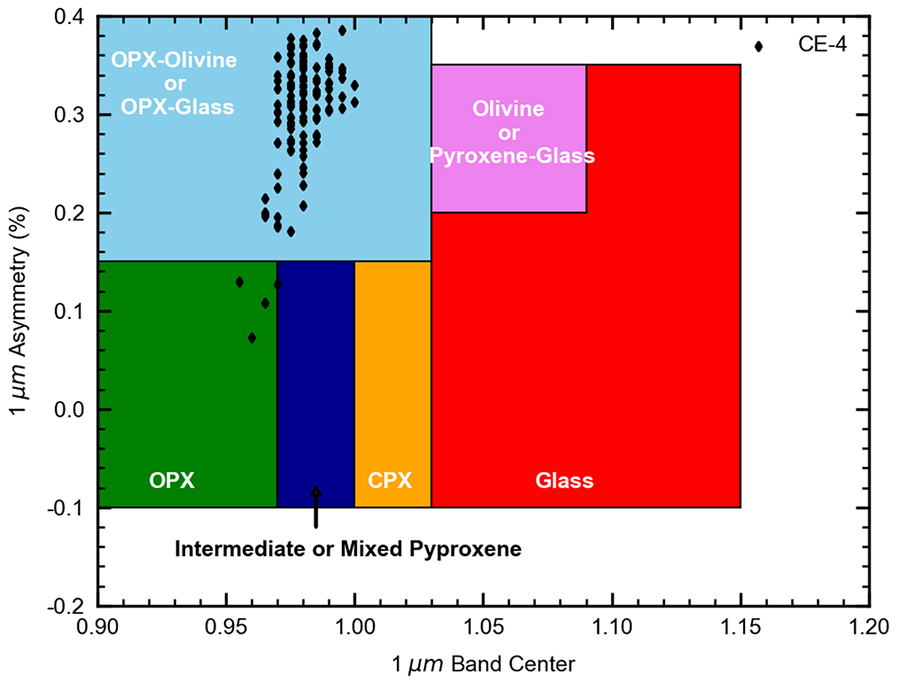
Figure 3: Plot of the ~1μm asymmetry of VNIS. The black data points are VNIS spectral data.
References: [1] Li.C. et al., (2019) Nature, 569. [2] Gou S. et al., (2019) EPSL, 528, 115829. [3] Gou S. et al., (2020) Icarus, 345, 113776. [4] Lin H.L. et al., (2020) NSR, 7, 913-920. [5] Hu X.Y. et al., (2019) GRL, 46, 9439-9447. [6] Ma P. et al., (2020) Icarus, 350, 113901. [7] Moriarty D. P. et al., (2020) LPSC, #2660. [8] Horgan B.H.N. et al., (2014) Icarus, 234, 132-154.
How to cite: Liu, B., Liu, D., Liu, J., Li, C., Su, Y., Zhu, X., and Zhang, H.: The composition and provenance analysis of materials on Chang’E-4 Yutu-2 rover traverse, Europlanet Science Congress 2024, Berlin, Germany, 8–13 Sep 2024, EPSC2024-491, https://doi.org/10.5194/epsc2024-491, 2024.
Energy circulation in geospace lies at the heart of space weather research. Establishing global mass and energy transportation image in the solar wind-magnetosphere coupling system is critical for space physics and space weather research. Remote sensing overcomes the difficulties of capturing global views and distinguishing spatiotemporal variations in in-situ particle and field detections. The moon is an idea platform for imaging the global magnetosphere. An extreme ultraviolet camera operating at 30.4 nm has successfully captured the global plasmaspheric images with the Chang’e-3 lunar landing mission. A new double-wavelength extreme ultraviolet camera and an energetic neutral atomic (ENA) imager have been carried by the Queqiao-2 satellite to image the magnetosheath at 30.4 nm, the plasmasphere at 30.4 nm, the ionospheric oxygen ion outflow and oxygen ion in the magnetosphere at 83.4 nm, and the ring current ENA. The two imagers will significantly benefit the investigations in solar wind-magnetosphere coupling.
How to cite: Zhang, X.-X., He, F., Liu, W., Sun, T., Zhang, X., He, L., Chen, B., and Yu, Q.: The extreme ultraviolet camera and energetic neutral atomic imager onboard the Queqiao-2 satellite, Europlanet Science Congress 2024, Berlin, Germany, 8–13 Sep 2024, EPSC2024-478, https://doi.org/10.5194/epsc2024-478, 2024.
Radiometric measurements of the (sub-)surface thermal emission allow determination of the microphysical structure (e.g. porosity and particle size) and thermophysical properties of the regolith. In our previous study (Bürger et al., 2024), we derived regolith grain size and regolith stratification from LRO/Diviner data (Paige et al., 2010) and a microphysical thermal model, but the derived parameter sets were non-unique. While radiometric observations in the infrared (e.g., LRO/Diviner) are sensitive to surface temperatures, microwave radiometric measurements are also sensitive to the thermal emission from the subsurface. Therefore, we will investigate whether the microwave data can be used to apply constraints on the sub-surface regolith properties (grain size, stratification) and the non-unique parameter sets derived in Bürger et al. (2024).
The microwave radiometer (MRM) on board the Chang'E-2 mission measured the brightness temperature of the lunar surface in four different frequency channels: 3, 7.8, 19.35 and 37 GHz (Feng et al., 2013; Zheng et al., 2019). It was in operation from October 2010 to May 2011 and the resolution of the instrument on the lunar surface was about two pixels per degree.
We filtered the Chang’E-2/MRM data to achieve the best quality by selecting only those pixels with low rock abundance, small local slope angle and within a narrow range of albedo values. The albedo filter also allowed us to separate measurements in the highlands and in the maria, as each has a characteristic difference in albedo. The measurements obtained in the maria were additionally filtered according to their TiO2 abundance, which has a pronounced influence on the optical properties of the regolith (Feng et al., 2020; Siegler et al., 2020; Sohn et al., 1994). The filtered data are sampled for every latitude in steps of 1° and the data points in the northern and southern hemisphere are combined under the assumption that the regolith properties are the same in both hemispheres. Figure 1 shows the filtered CE-2/MRM brightness temperatures measured at 37 GHz together with their mean values as a function of latitude for the highlands.
For the interpretation of the microwave measurements, a radiative transfer model is required in addition to a thermal model to generate synthetic brightness temperatures. In this project, we apply the radiative transfer model presented in Feng et al. (2020) and Siegler et al. (2020). First, physical temperatures in each layer are modelled using the microphysical thermal model introduced in Bürger et al. (2024), which describes the regolith in terms of grain size and volume filling factor. Second, a synthetic brightness temperature is obtained by multiplying the simulated physical temperature of each regolith layer with a weighting factor that depends on the frequency of the measurement and the relative dielectric constant, the loss tangent and the bulk density of the regolith layer, and then taking the sum of all weighted temperatures.
At the conference we will present and discuss the regolith properties derived from the CE-2/MRM data. In more detail, we will investigate the regolith properties for maria and highlands separately and revisit the latitudinal dependence of regolith properties. In Bürger et al. (2024) we found a latitudinal gradient between LRO/Diviner data and the microphysical thermal model, which could be reduced by a variation of the albedo as a function of solar incidence angle or a decrease in bulk density with increasing latitude. Figure 1 illustrates an initial comparison between model and Chang’E-2/MRM measurements and shows that, in contrast, the nighttime microwave data do not exhibit a pronounced latitudinal gradient. However, during the day and at the highest latitudes daytime shadowing effects are present. The brightness temperatures were modeled assuming constant regolith properties derived from a fit at 0° latitude and no albedo or bulk density variation with latitude was applied. These findings will be further investigated and discussed.
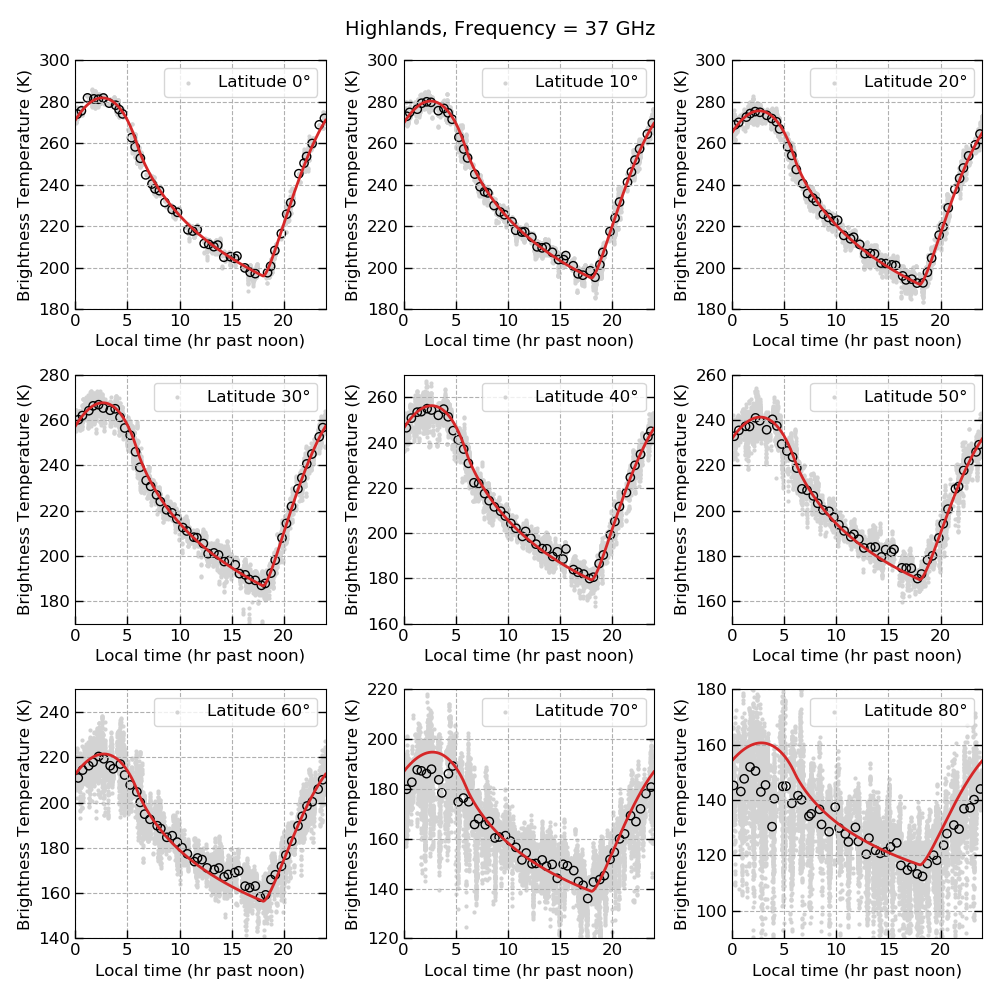
Figure 1: Filtered Chang’E-2/MRM measurements obtained at a frequency of 37 GHz as a function of local time and their corresponding mean values (black circles) for highlands. The measurements are collected in latitude bins with a bin size of 1°. The red solid line represents the modeled brightness temperature assuming constant regolith properties derived from a fit at 0° latitude for all latitudes.
References
Bürger, J. et al. (2024), JGR, 129(3). Feng, J. et al. (2020), JGR, 125(1). Paige et al. (2010), Space Sci. Rev., 150(1–4), 125–160. Siegler, M. A. et al. (2020), JGR, 125(9). Sohn et al. (1994), Jpn. J. Appl. Phys., 33, 5466-5470. Zheng et al. (2019), Icarus, 319, 627-644.
How to cite: Buerger, J., Feng, J., Siegler, M., and Blum, J.: Lunar regolith properties derived from Chang’E-2/MRM data: What can the microwave tell us?, Europlanet Science Congress 2024, Berlin, Germany, 8–13 Sep 2024, EPSC2024-83, https://doi.org/10.5194/epsc2024-83, 2024.
1. Introduction
Although the Moon lacks a global magnetic field, its crust features small-scale (smaller than a typical proton gyroradius) magnetized regions known as lunar magnetic anomalies [1] (Figure 1a). Their interaction with the solar wind gives rise to unique structures called lunar mini-magnetospheres [2]. These structures are characterized by a partial solar wind cavity surrounded by a region of enhanced precipitating proton flux [3] resulting from the deflection and reflection of protons above the anomaly [4]. As a significant fraction of the solar wind protons which interact with the lunar surface are backscattered as hydrogen ENAs [5], instruments measuring ENA and protons can be used to remotely observe lunar mini-magnetospheres and investigate their effect on the solar wind flow in-situ [6]. This study uses ENA and proton measurements from the Sub-KeV Atom Reflecting Analyzer (SARA) onboard Chandrayaan-1 [7] to examine the structure and dynamics of the magnetosphere-like object formed by the South Pole-Aitken (SPA) magnetic anomaly cluster.
2. Dataset and methods
We produced hydrogen ENA and proton emission maps of the lunar far-side using orbital measurements from the Chandraayan-1 Energetic Neutrals Analyzer (CENA) and Solar Wind Monitor (SWIM) from the SARA instrument. To understand the surface-solar wind interaction, we limited our dataset to CENA/SWIM measurements acquired when Chandraayan-1 was on the lunar day-side and when the Moon was in the solar wind. All measurements contaminated by UV radiations and obtained for off-nadir pointing spacecraft operation modes (>15 deg) were removed. To quantitatively compare emission maps obtained under varying observation geometries and upstream solar wind conditions, the measured hydrogen ENA flux was normalized by the modeled ENA flux that would be observed in the absence of magnetic anomalies. This modeled flux was calculated using the empirical hydrogen ENA scattering function and energy spectra derived previously [8, 9], along with the upstream solar wind parameters measured by the ACE and WIND spacecraft. Similarly, the measured reflected proton flux was normalized by the solar wind proton flux impinging the surface. The obtained normalized emission maps were then classified into high (> 0.6 nPa) and low (< 0.6 nPa) solar wind dynamic pressures (nmu2/2) to examine the influence of this parameter on the structure of the SPA magnetic anomaly cluster.
3. Results
A region of reduced ENA flux is observed above the SPA magnetic anomaly cluster (Figure 1b), suggesting that a large-scale magnetosphere-like object forms above the SPA cluster under all solar wind conditions available in the dataset. Figure 1b also reveals a large ENA-enhanced flux region surrounding the SPA cluster. This feature could result from the deflection of solar wind protons above this object. We also confirm significant proton reflection above the SPA magnetic anomaly cluster (Figure 1c). Local proton reflection rates appear to be correlated with surface magnetic field strengths and ENA flux reduction rates (Figures 1a, b, and c).
Figure 2 shows the proton and ENA emission maps under the high and low solar wind dynamic pressure cases. Figures 2e and 2f suggest that proton reflection rates above magnetic anomalies are anti-correlated with the solar wind dynamic pressure. A comparison of ENA emission maps between the two dynamic pressure cases (Figures 2b and 2c) reveals that the small-scale structures of the SPA magnetic anomaly cluster, as well as its ring-shaped enhanced ENA flux region, are more prominent under low dynamic pressures. However, the size and peak shielding efficiency of the SPA magnetic anomaly cluster do not appear to differ significantly between the high and low dynamic pressure cases. These results suggest that under low solar wind dynamic pressures, the structure of the SPA magnetic anomaly cluster is mainly driven by small-scale crustal field variations. However, under higher dynamic pressures, the magnetic fields of the SPA cluster could be compressed and behave as a coherent obstacle to the solar wind flow.
4. Concluding remarks
ENA and proton observations of the lunar far side reveal that the SPA magnetic anomaly cluster causes large-scale (>1000 km) effects to the solar wind flow. The characteristics of these disturbances imply that the SPA magnetic anomaly cluster forms a large magnetosphere-like object which responds differently to varying upstream solar wind conditions compared to mini-magnetospheres formed by smaller isolated magnetic anomalies. These results suggest that the global effects of the SPA cluster on the solar wind proton precipitation patterns and local characteristics have been underestimated. These findings are critically important for interpreting plasma measurements on lunar landers on the far side, for example, Chang’E-4. How anomalies of small (< 100 km) vertical extent create large (> 1000 km) horizontal structures remains to be explained. Possible mechanisms to be examined involve the setup of large-scale Hall electric fields and the resulting horizontal proton drift.
5. References
[1] Tsunakawa, H. et al. (2015), Journal of Geophysical Research: Planets 120,1160-1185.
[2] Lin, R.P. et al. (1998), Science 281, 1480-1484.
[3] Wieser, M. et al. (2010), Geophysical Research Letters 37.
[4] Lue, C. et al. (2011), Geophysical Research Letters 38.
[5] Wieser, M. et al. (2009), Planetary and Space Science 57, 2132-4.
[6] Vorburger, A. et al. (2013), Journal of Geophysical Research: Space Physics 118, 3937-45.
[7] Barabash, S. et al. (2009), Current Science 96, 526-532.
[8] Vorburger, A. et al. (2012), Journal of Geophysical Research: Space Physics 117.
[9] Futaana, Y. et al. (2012), Journal of Geophysical Research: Space Physics 117, 432-45.
6. Figures
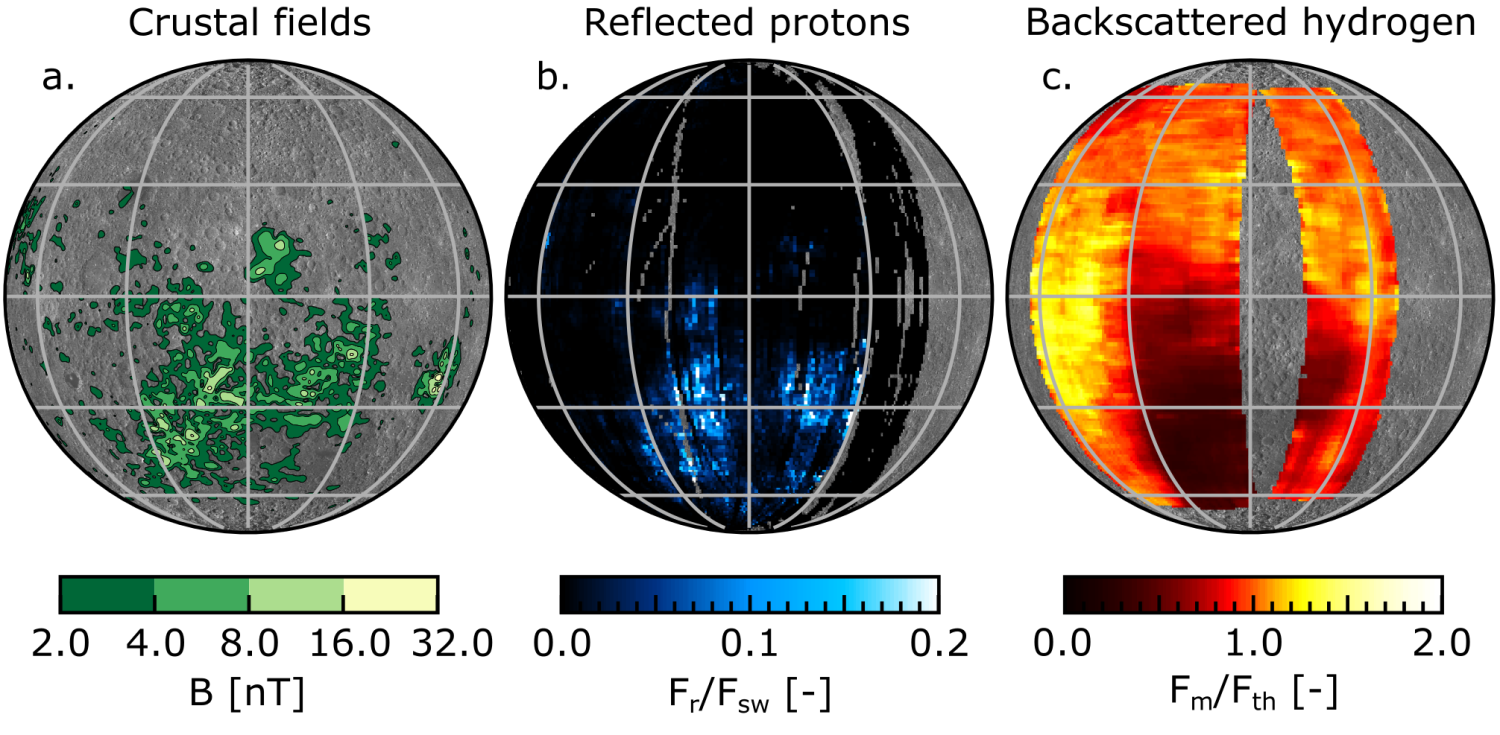
Figure 1: Lunar far-side maps for a) crustal magnetic fields at 30 km altitude from Tsunakawa et al. (2015), b) reflected proton produced by SWIM measurements, and c) ENA emissions produced by CENA measurements. The reflected proton flux is normalized by the incident solar wind proton flux, and the ENA flux by the empirically modelled undisturbed backscattered flux (see text).
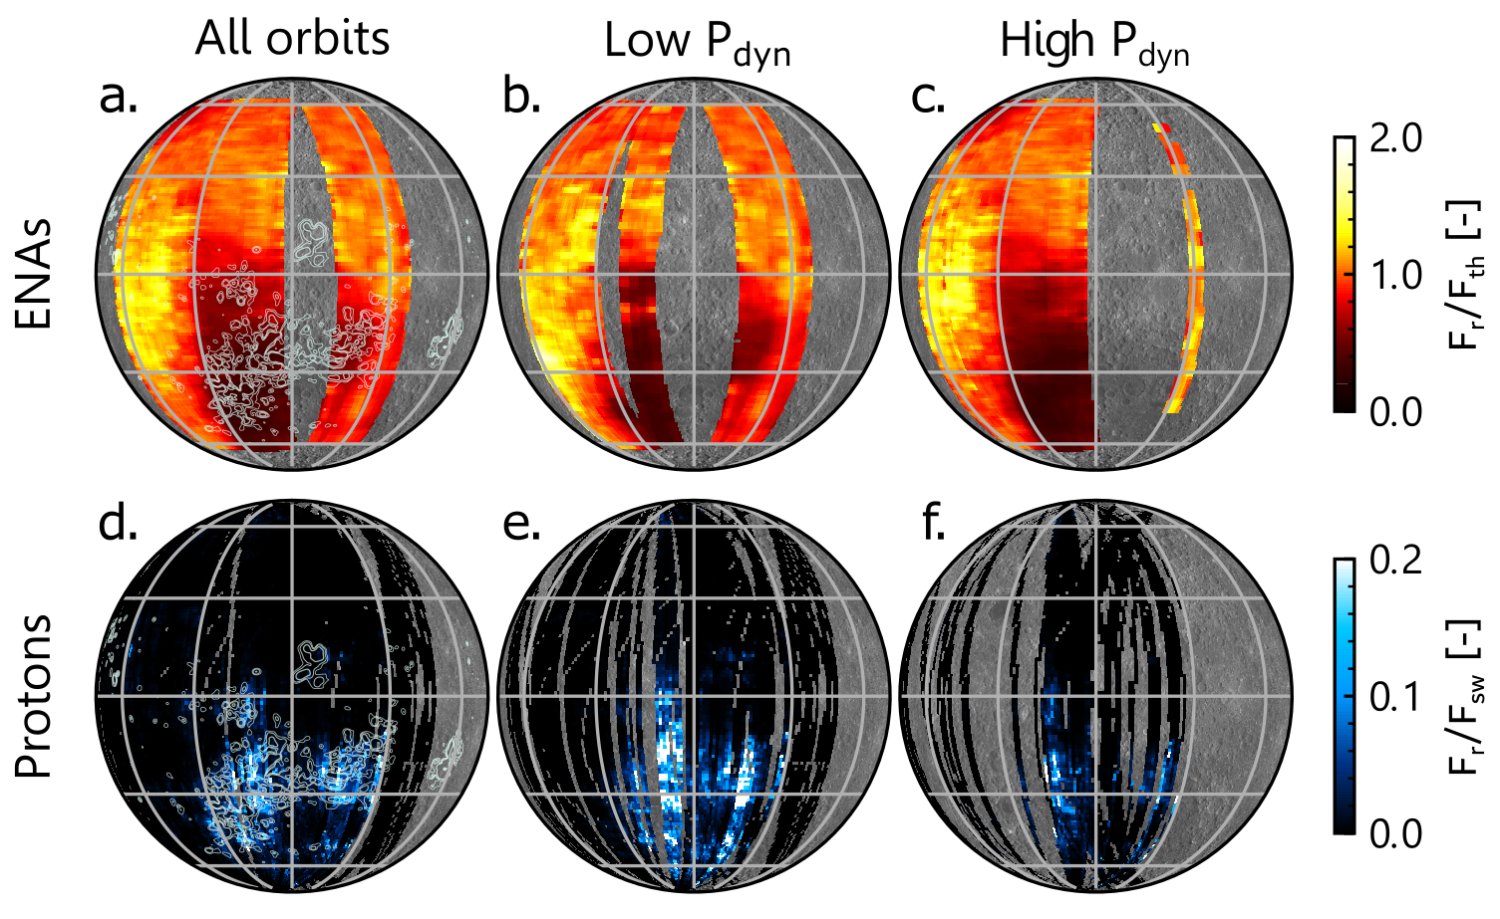
Figure 2: Lunar far side maps of a-c) the backscattered ENA and d-f) reflected protons. The map was produced under different solar wind conditions: using (a, d) all the data and (b, e) the low (<0.6 nPa) and (c, f) high (>0.6 nPa) solar wind dynamic pressure cases.
How to cite: Maynadié, T., Futaana, Y., Barabash, S., Fatemi, S., Wieser, M., Vorburger, A., Bhardwaj, A., Wurz, P., and Asamura, K.: Dynamics and Structure of the South Pole-Aitken Mini-Magnetosphere from Proton and ENA measurements from the SARA Instrument on-board Chandraayan-1, Europlanet Science Congress 2024, Berlin, Germany, 8–13 Sep 2024, EPSC2024-79, https://doi.org/10.5194/epsc2024-79, 2024.
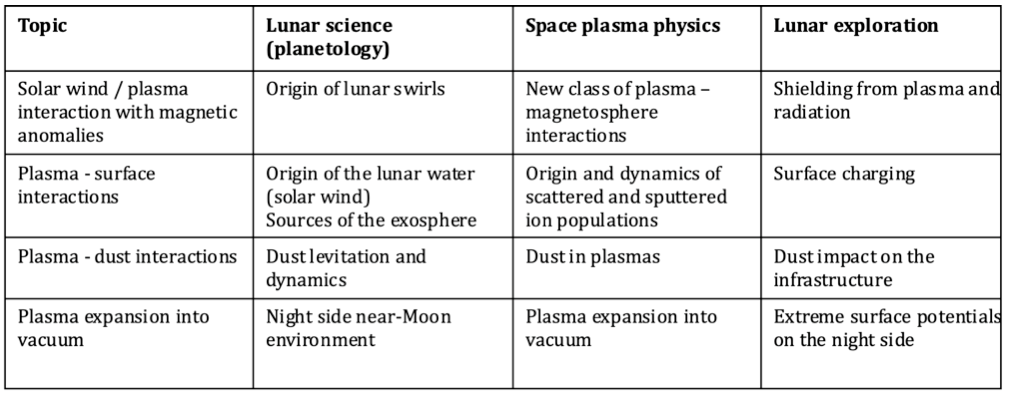
Traditionally the Moon is considered “boring” by space plasma physicists. Indeed, no dense atmosphere/ionosphere, no large scale magnetic field, and the solar wind absorption by non-conductive surface make this body an outcast among “exciting” objects being the primary interest for space plasma physics. However, lunar exploration for the last 20 – 25 years revealed a completely different picture of our only satellite. The Moon is non-magnetized body but possesses magnetic anomalies, localized (mostly on the far side) magnetic field structures of <300 nT with a a size of 100 km, smaller than a proton gyroradius but larger than an electron one, perfect hybrid objects! The Moon is an airless body but has a tenuous exosphere with densities up to 105 cm-3 that are a source of heavy pick-up ions. The lunar surface covered by non-conductive regolith is rough and absorbing but significant particle reflection occurs both as ions and neutrals. The Moon is a large body of 1740 km radius but a zoo of kinetic effects was identified, in particular, when plasma expands into vacuum, e. g., the wake or voids related to local topography such as permanently shadowed regions. The Moon spends 75% of the orbital period in the solar wind but experiences highly variable plasma environments inside the magnetosphere. At the surface dust particles interact strongly with near-surface plasma that defines their dynamics.
We formulate four main unique overarching science questions for space plasma physics at the Moon (“the main four”):
- How do the solar wind and magnetospheric plasmas interact with magnetic anomalies?
- How does near-Moon plasma expand into vacuum?
- How does plasma interact with dust at the surface?
- How does the plasma - surface interactions? How does the lunar surface charge?
Research on these topics not only advance fundamental lunar science and space plasma physics but are also critical for exploration as outlined in the table below. The Moon is not “boring”! We need dedicated space plasma missions to the Moon.
How to cite: Barabash, S.: The Moon is an exciting object for space plasma physics: the main science questions, Europlanet Science Congress 2024, Berlin, Germany, 8–13 Sep 2024, EPSC2024-279, https://doi.org/10.5194/epsc2024-279, 2024.
The Advanced Small Analyzer for Neutrals (ASAN) instrument [1] is the first instrument to measure energetic neutral atoms directly on the lunar surface. Installed onboard of the Yutu-2 rover of the Chinese Chang’E-4, mission it started operations in January 2019. The landing site in the Karman crater on lunar far side is at the edge of the large magnetic anomaly in the South Pole-Aitken basin. The ASAN instrument has been operated periodically since, making use of the mobility of the rover to get different observation geometries.
When the solar wind interacts with the lunar surface, a portion of it is reflected back as energetic netural atoms. Previous studies have provided evidence of neutral hydrogen atoms [2] and solar wind protons being reflected from the surface. However, prior to ASAN, all these measurements were performed form orbit and no direct measurements on the surface had been conducted. ASAN’s observation location directly at the surface allows to investigate the microphysics of the solar wind-surface interaction process and to study the effects of local magnetic anomalies on the emitted energetic neutral particle flux.
The ASAN instrument is an 8th generation instrument of the SWIM family [3]. ASAN uses a charge conversion surface to convert energetic neutral atoms to positive ions and analyzed them with s surface-interaction based time-of-flight system combined with an electrostatic analyzer and an electrostatic elevation scanning system. This enables ASAN to to measure the direction-, energy-, and mass-resolved energetic neutral atom flux on the surface.
We report on the instrument status and present a review of energetic neutral atoms observations done by ASAN on the lunar surface and discuss possible implications for the near-surface plasma environment.
[1] M. Wieser, S. Barabash, X.-D. Wang, A. Grigoriev, A. Zhang, C. Wang, and W. Wang. The Advanced Small Analyzer for Neutrals (ASAN) on the Chang’E-4 Rover Yutu-2. Space Science Reviews, 216(4):73, 2020.
[2] M. Wieser, S. Barabash, Y. Futaana, M. Holmström, A. Bhardwaj, R. Sridharan, M. B. Dhanya, A. Schaufelberger, P. Wurz, and K. Asamura. First observation of a mini-magnetosphere above a lunar magnetic anomaly using energetic neutral atoms. Geophys. Res. Lett., 37(5), 03 2010.
[3] M. Wieser and S. Barabash. A family for miniature, easily reconfigurable particle sensors for space plasma measurements. Journal of Geophysical Research: Space Physics, 2016
How to cite: Wieser, M., Barabash, S., Wang, X.-D., Williamson, H., and Stenberg-Wieser, G.: The Advanced Small Analyzer for Neutrals (ASAN) instrument on Chang’E-4: A review of five years on the lunar surface, Europlanet Science Congress 2024, Berlin, Germany, 8–13 Sep 2024, EPSC2024-238, https://doi.org/10.5194/epsc2024-238, 2024.
Several lunar samples collected during the Apollo missions were kept sealed and stored in controlled conditions in order to be studied decades later exploiting future, more advanced capabilities. Two of the preserved samples are Apollo 17 double drive tube 73002/73001. The double drive tube extracted a core sample of the Light Mantle deposit at Station 3 in the Taurus-Littrow Valley (Figure 1). As part of the NASA Apollo Next Generation Sample Analysis (ANGSA) program, samples 73002 and 73001 became available to study in 2019 and 2022, respectively [1][2]. The Apollo 17 double drive tube sampled the Light Mantle deposit material down to a depth of 70.6 cm; the effective material length of each tube is 21.3 cm for 73002 and 34.9 cm for 73001 (some material was lost during sampling). This represents an unprecedented opportunity to study the Light Mantle deposit to previously unsampled depths.
The Light Mantle deposit represents the only extraterrestrial landslide to have ever been studied in-situ. The Light Mantle is a 5-km-long deposit that formed from debris mobilised from the South Massif, a 2.2-km-high mountain in Taurus-Littrow Valley [3][4]][5]. The origin and hypermobility of the Light Mantle remain debated. The recently opened Apollo 17 double drive tube 73002/73001 provides a new set of samples to investigate the origin and the emplacement mechanisms of the Light Mantle.
Prior to dissection and opening of the sample containers, the double drive tube was scanned using X-ray computed tomography (XCT) [6] so that a digital, high-resolution 3D dataset of the whole core sample is available and represents one of the ‘next generation’ capabilities now available to researchers to interrogate the data using novel approaches and obtain new insights into lunar material and processes. Additionally, the 3D dataset preserves the 3D context of all the subsamples extracted from the original core sample.
In this work, we used high-resolution X-ray computed tomography (XCT) scans and high-resolution scans of thin sections of the upper 20 cm of the core, sample 73002, and conduct 3D clast-size analysis and investigation of clast morphological fabric. The aims of this work are to:
- Present a 3D data processing workflow that can be used as a basis for future investigations of lunar core samples.
- Demonstrate potential scientific information that can be extracted from 3D analysis of lunar core samples.
Within this framework, we conduct: (1) 3D grain size analysis and compare the results with grain size analyses conducted on the grains extracted during the dissection of the core sample; (2) 3D analysis of clast size distribution. Additionally, as part of our investigation of the emplacement mechanism of the Light Mantle, we use 2D continuous thin sections (backscattered electron maps) of sample 73002 to search for diagnostic clast fabric similar to those generated during the friction experiments conducted in simulated lunar landslides [7]. The clast fabric is called Clast Cortex Aggregate (CCA) and it’s constituted by a central clast surrounded by nano-scale fine material (Figure 2).
The data analysis and visualization of the XCT dataset of core sample 73002 were performed using 3D visualization software Avizo 2022.2 by ThermoFisher. We customized our workflow and established a best-practice protocol so that they can be used as reference for future analysis of 73001. We used backscattered electron (BSE) maps of the sample’s thin sections (73002,6011; 73002,6012; 73002,6013; 73002,6014) [8] to search for (CCAs).
The results of clast-size distribution show that the sample is characterised by lack of the largest clast-size fraction in the top 4-5 cm, which we attribute to the fragmentation of larger regolith-hosted clasts and bedrock by space weathering and meteoroid bombardment. The observation of an uppermost layer presenting characteristics of reworked regolith is consistent with results from previous studies of lunar regolith and from other works conducted on 73002 as part of the ANGSA program [8][9]. Moreover, we found extensive presence of CCAs. The formation of CCAs in natural and lab-simulated landslides is attributed to granular flow dynamics, presence of nanoparticles, and adhering forces between such particles. Therefore, we concluded that the presence of CCAs in sample 73002 represents the first evidence that the Light Mantle was emplaced as a granular flow. This work shows that valuable information can be extracted from the 3D analysis of lunar core samples and, more generally, it shows the potential of morphometric and morphological clast analysis using high resolution XCT dataset and thin sections combined.
Our work represents the first study to conduct a 3D clast analysis of a lunar regolith core sample. As such, it constitutes an important step in showing the novel information that can be extracted, and presenting a potential workflow for studying lunar regolith core samples that will be collected during future missions to the Moon.
REFERENCES. [1] Shearer et al. (2020). AGU Fall Meeting. Abstract V013-0001. [2] Shearer et al. (2022). 53rd LPSC. Abstract 2546. [3] Schmitt (1973). Science, 182(4113), 681–690. [4] Lucchitta (1977). Icarus, 30(1), 80–96. [5] Kokelaar et al. (2017). JGR:Planets, 122(9), 1893-925. [6] Gross et al. (2023). https://curator.jsc.nasa.gov/lunar/angsa_attachments/aapreliminary_20catalog/preliminary_73001-73002_catalog.pdf. [7] Magnarini et al. (2023). JGR:Planets, 128(6), e2022JE007520. [8] Bell et al. (2024). Submitted to JGR:Planets – In review. [9] Neuman et al. (2024). Submitted to Science – In review.
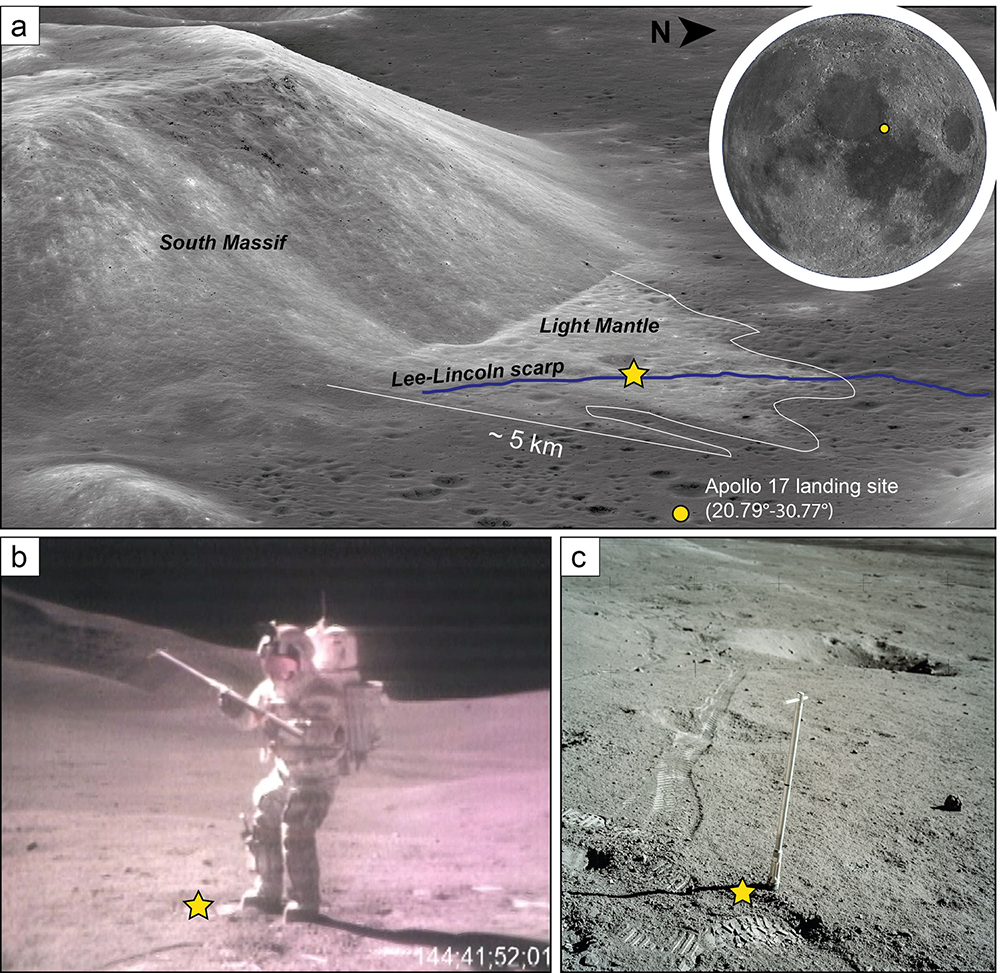
Figure 1 – a) Oblique view of Taurus-Littrow Valley; the yellow dot shows the location of the Apollo 17 landing site (LROC/NAC image M1266925685L. Image credit: NASA/GSFC/ASU); b) A frame from the original footage recorded from the Lunar Rover Vehicle onboard camera the showing astronaut Gene Cernan extracting the double drive tube containing material from the Light Mantle deposit. c) Double drive tube in the ground prior extraction (AS17-137-20981. Image credit: NASA). The yellow star in the three panel shows the location where the double drive tube core sample 73002/73001 was collected.
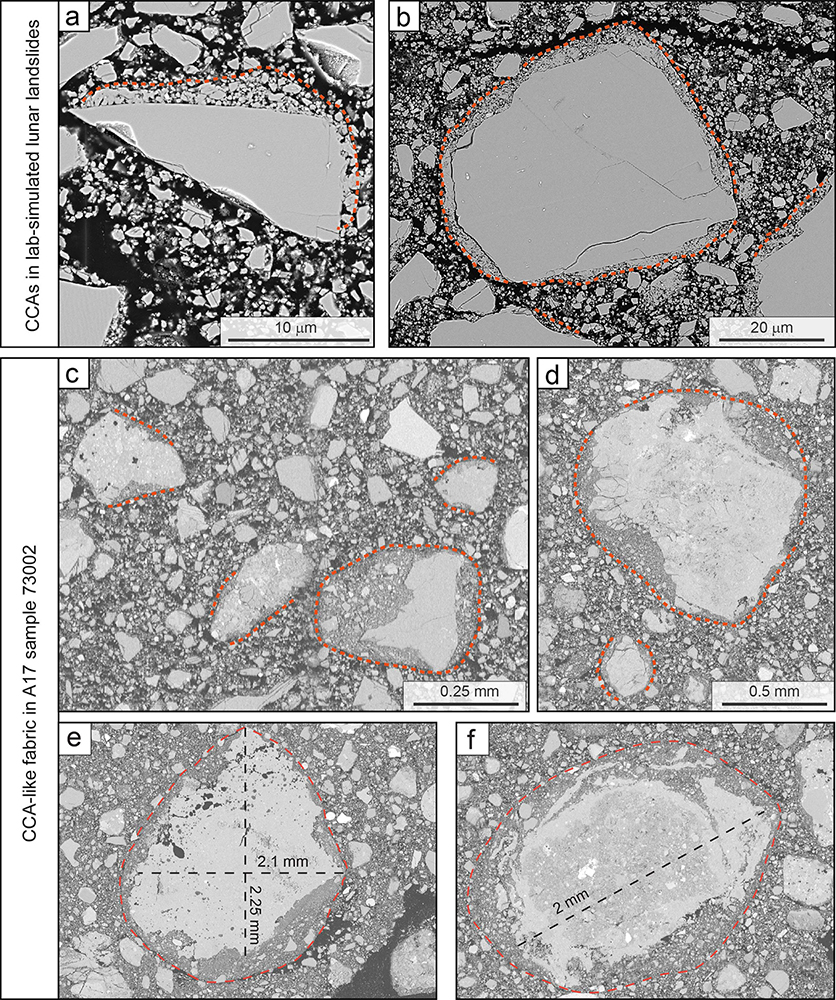
Figure 2 – Comparison of Clast Cortex Aggregates (CCAs). (a-b) CCAs generated during the friction experiments conducted on anorthosite-bearing gouges by [7]; (c-f) CCAs found in the Apollo 17 core sample 73002. The red dotted lines and the white dotted line in (d) show the corona of finer fragments found around clasts.
How to cite: Magnarini, G., Mitchell, T. M., Grindrod, P. M., Bell, S. K., Joy, K. H., Eckley, S. A., Zeigler, R. A., Schmitt, H. H., and Shearer, C. and the ANGSA Science Team: 3D and 2D clast analysis of Apollo 17 core sample 73002: insights into the Light Mantle dynamics and regolith reworking., Europlanet Science Congress 2024, Berlin, Germany, 8–13 Sep 2024, EPSC2024-329, https://doi.org/10.5194/epsc2024-329, 2024.
The surface heat flux provides important constraints on the present-day thermal state of the lunar interior. In situ surface heat flux measurements, performed during the Apollo program, obtained surface heat flux values of 21±3 and 14±2 mW/m2 at the landing sites of Apollo 15 and 17, respectively [1]. Recently, a peak heat flux of ~180 mW/m2 was inferred by [2] from the Chang’E 1 and 2 data at the Compton-Belkovich location. A lower bound for global lunar heat flux of ~6 mW/m2, based on measurements of the Diviner Lunar Radiometer Experiment onboard LRO, has been suggested for Region 5, a location at the eastern edge of Haworth crater [3]. In addition to heat flux measurements, global thermal expansion/contraction estimates can be used to constrain the thermal state of the interior throughout lunar history [4].
Differences between the surface heat flux measurements, even for geographically close regions, indicate a high heat flux variability on the Moon. Previous work investigated regional combinations of crustal thermophysical properties (thickness, density, thermal conductivity), distribution of heat producing elements (HPEs), and heat flux coming from the mantle to explain the differences between the two Apollo measurements [5,6]. The results of these regional-scale models suggested heat-flux values of 7-13 mW/m2 and 12-14 mW/m2 at the crust-mantle interface and for the global average, respectively. These studies also highlighted the need to include regional-scale scenarios within global thermal evolution models and investigate key aspects (e.g., the geographical extent of a subsurface KREEP layer), in order to relate local heat flux measurements and regional-scale estimates to the global properties of the Moon.
Here, we construct 3D thermal evolution models using the fluid solver GAIA [7]. The interior dynamics of the Moon are simulated over 4.5 billion years, by solving the conservation equations of mass, linear momentum and thermal energy. Similar to [8], we account for spatially variable crustal thickness, derived from gravity and topography data [9] (Fig. 1a). We consider higher HPEs abundances in the PKT and crust compared to the mantle, and compute the interior dynamics (Fig. 1b) using an Arrhenius viscosity for diffusion creep similar to [11]. This setup is designed to allow for an extensive investigation of lunar crustal properties and their spatial variability.
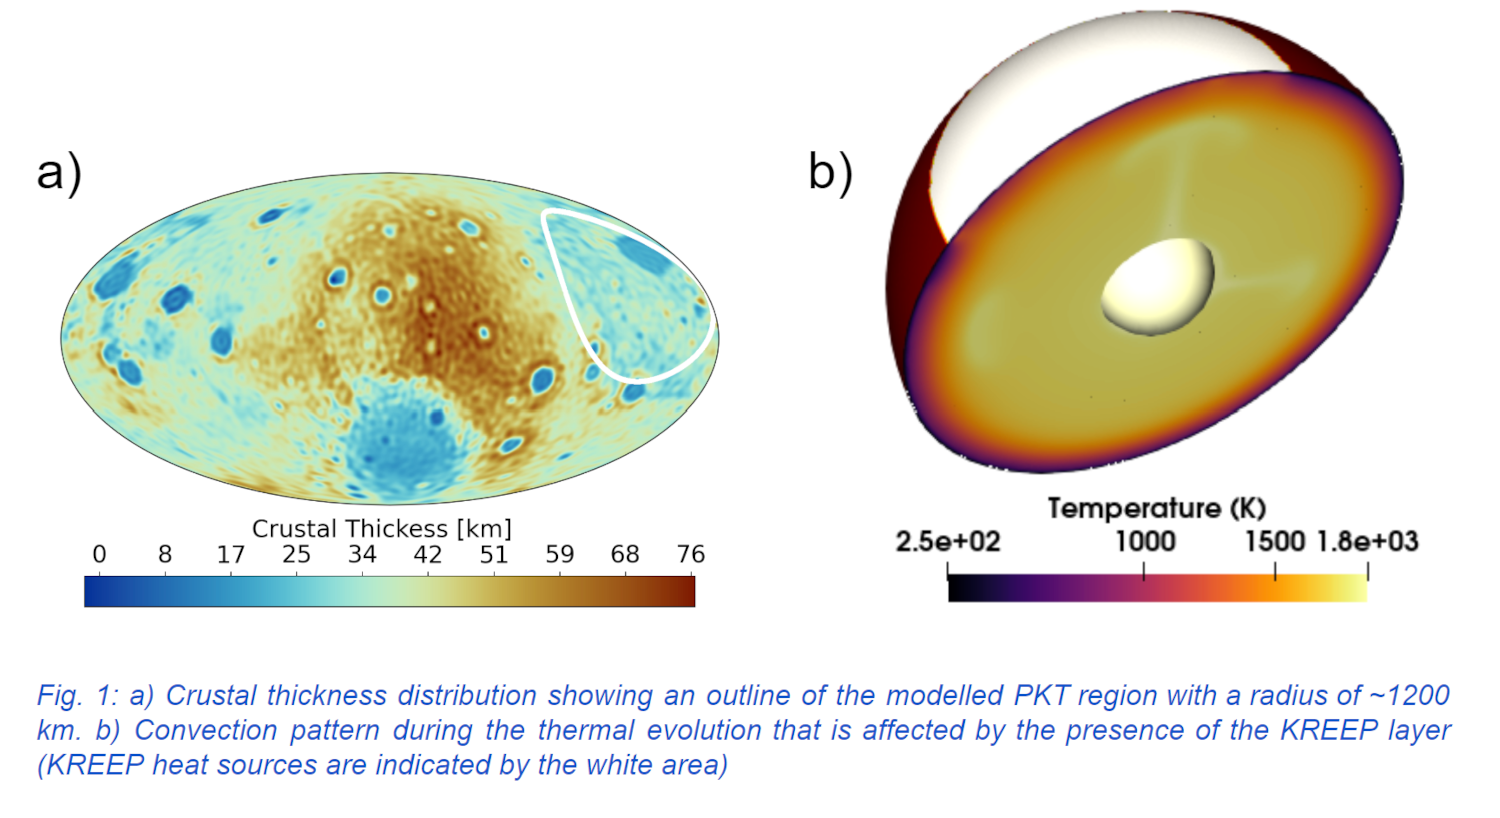
In our models we vary critical parameters such as the location, size, thermal conductivity, and HPE enrichment of the PKT region, but also the location of a putative KREEP layer (i.e., within or below the crust). Finally, we consider various thermal conductivity values and HPE enrichment of the anorthositic crust, and initial temperature profile of the interior. In addition to present-day surface heat flux, we compute the heat flux at the crust-mantle interface and also estimate the time-variable thermal expansion/contraction during lunar evolution. These values are compared to all available constraints [1-6] to select best-fit models.
Our models that are best compatible with the Apollo measurements are in agreement with [5] and [6]. These models have a bulk uranium content of 25 ppb [11], and show average and standard deviation surface and crust-mantle interface heat flux values of ~14±5 and ~8±1 mW/m2, respectively (Fig. 2a and b). For the Compton-Belkovich anomaly, none of our models can reproduce the high heat flux value proposed by [2]. Therefore, we conclude that the inferred heat flux value of ~180 mW/m2 indicates either very specific local processes (e.g., overly high radiogenic enrichment) [2] or large measurement uncertainties.
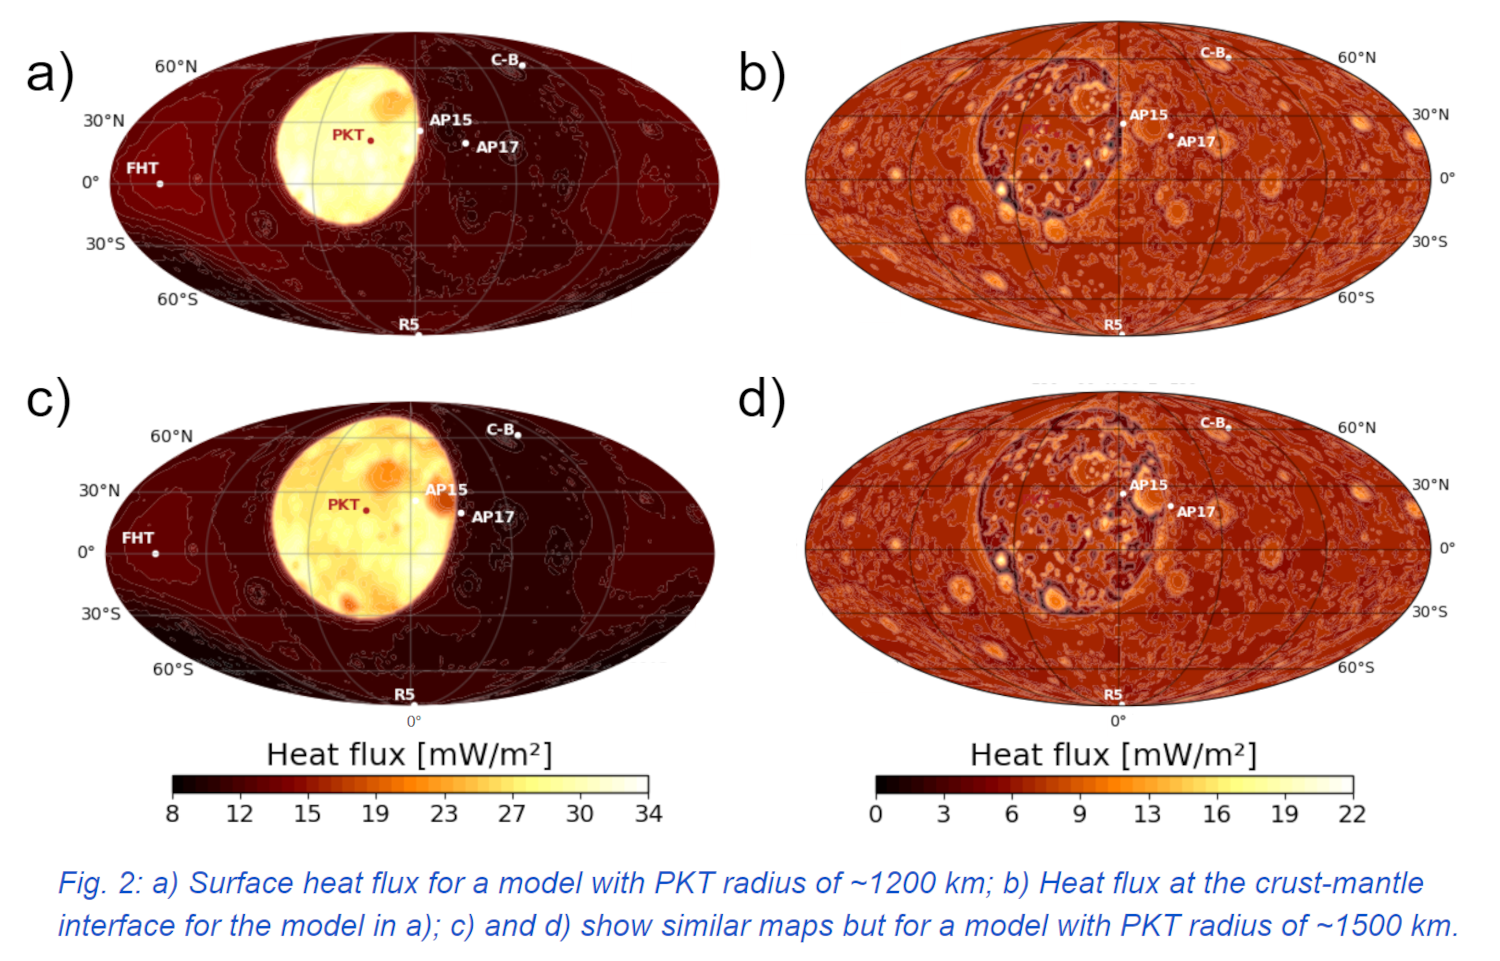
We find that, without considering 3D lateral variability in thermal conductivity across the lunar surface, measurably lower heat flux values at Region 5 [3] with respect to Apollo 15 & 17 require for KREEP material to extend at least partly beneath mare Serenitatis. In this case, the Apollo 15 measurement would be representative of the PKT average heat flux, while Apollo 17 would lie on its edge (Fig. 2c). On the other hand, a smaller PKT could imply that the low heat flux at Region 5 is caused by different phenomena, for instance a laterally variable thermal conductivity. Heat flux measurements that will be performed by the Farside Seismic Suite [12] at Schrödinger crater, if successful, will provide key information that would help to exclude one of these two scenarios, and thus potentially constrain the extent on the KREEP layer underneath PKT region.
The full spatial variations of the surface heat flux on the Moon obtained by our models are an important step forward towards understanding the thermal history and present-day state of the lunar interior. Such models can help to put current and future heat flux measurements into a global context and to constrain the distribution of the KREEP layer beneath the PKT region. Future work will include a laterally variable thermal conductivity of the crust to test the effects of the spatial distribution of lunar regolith on the surface heat flow and subsurface temperature variations.
References:
[1] Langseth et al., 1976; [2] Siegler et al., 2023; [3] Paige & Siegler, 2016; [4] Andrews-Hanna et al. 2013; [5] Siegler and Smrekar, 2013; [6] Warren and Rasmussen, 1987; [7] Hüttig et al., 2013; [8] Plesa et al., 2016; [9] Broquet & Andrews-Hanna, 2023; [11] Laneuville et al., 2013 [12] Panning et al., LPSC 2024.
How to cite: Santangelo, S., Plesa, A.-C., Broquet, A., Breuer, D., and Root, B. C.: The present-day surface heat flux of the Moon from global geodynamic and crustal thickness models., Europlanet Science Congress 2024, Berlin, Germany, 8–13 Sep 2024, EPSC2024-959, https://doi.org/10.5194/epsc2024-959, 2024.
Introduction
The Moon has many permanently shadowed regions (PSRs) inside of craters at the poles, which are only illuminated by indirect (reflected) sunlight and thermal radiation because of the small solar incidence angle and obliquity. That is why the terrain of the poles strongly influences the temperature profile of the regolith. These exceptionally cold PSRs are areas that are most likely to harbor water ice (Vasavada 1999; Watson et al. 1961) and are therefore of interest to future landing missions. One example is the NASA CLPS-10, which carries ESA’s PROSPECT instrument, which, using the Drill, will sample the lunar surface up to 1 m depth with the aim to detect volatiles including water ice if present (Boazman et al. 2023).
The temperature of the regolith can be described as a function of depth using a one-dimensional thermal model. In craters, it is necessary that the incident radiation on each surface element is accurately considered as a boundary condition, as this depends strongly on the surrounding topography. The crater walls can block radiation, but they can also reflect it.
Coupling the surface boundary condition determined in this model with a thermal model from Bürger et al. (2024) for the regolith layers allows conclusions to be drawn about the depth and position of water ice in such craters and surface temperatures measured remotely by instruments such as Diviner (Paige et al. 2010).
Method
In our model, the topography of the region of interest is then transformed into a mesh of triangles using Delaunay triangulation. For each facet, the conservation of energy applies, which states that the radiated heat must be equal to the direct absorbed solar radiation, plus the direct absorbed IR radiation emitted by all other facets, plus the absorbed radiation (solar and IR) reflected by all other facets, plus the heat flux from the sub-surface. Reflections in the visible and IR range are taken into account for all orders. The sun is approximated as a point source and its position is calculated using SPICE. Whether a facet is seen by the sun is determined using ray tracing. The proportion of radiation transmitted from one facet to another is proportional to the view factor, also known as the form factor, and the associated albedos and emissivities. Previous similar models, e.g. Potter et al. (2023), Vasavada (1999) or Gläser et al. (2019), usually use only angle-independent albedos. However, laboratory measurements (Foote et al. 2020), thermal models for the lunar surface (e.g. Keihm 1984; Vasavada et al. 2012; Hayne et al. 2017; Bürger et al. 2024) and a model that estimates the albedo from the lunar noontime surface temperatures as a function of latitude (Feng et al. 2020) show that the albedo is indeed angle-dependent, which is why this effect is also taken into account, as some other models already do (King et al. 2020).
Initial Results
As a first step and as a verification method, we neglect the sub-surface heat flow, i.e. the thermal model, and compare the numerical raytracing model for a constant solar incidence angle (equilibrium case), constant albedo and a perfectly bowl-shaped crater (see fig. 1) with the analytical solution of Ingersoll et al. (1992). We find a good agreement between these two models.
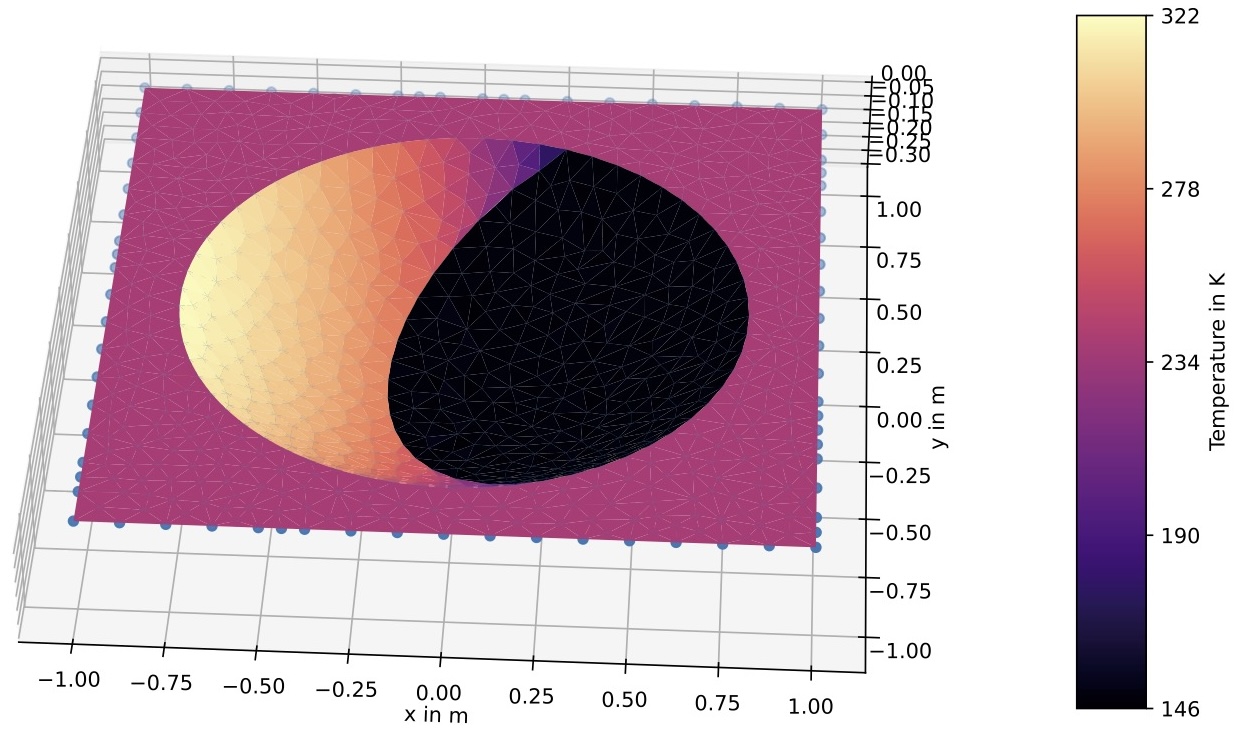
Figure 1: Equilibrium surface temperature distribution of a perfectly bowl-shaped crater for a solar incidence angle of e⊙ = 15° (emissivity = 0.99, albedo = 0.3).
In the next step, the model was equipped with an angle-dependent albedo. As expected, the albedo models used always cause the temperature in the crater to drop, as less radiation is absorbed at higher angles of incidence. The extent to which the temperature drops depends heavily on the albedo model and can be up to 30 K.
Applying the model to real craters with realistic topography produces surface temperature maps for a specific position of the sun (again in the equilibrium case, see fig. 2) or over the course of a lunar day (e.g. for maximum temperatures) while also neglecting sub-surface heat flow.
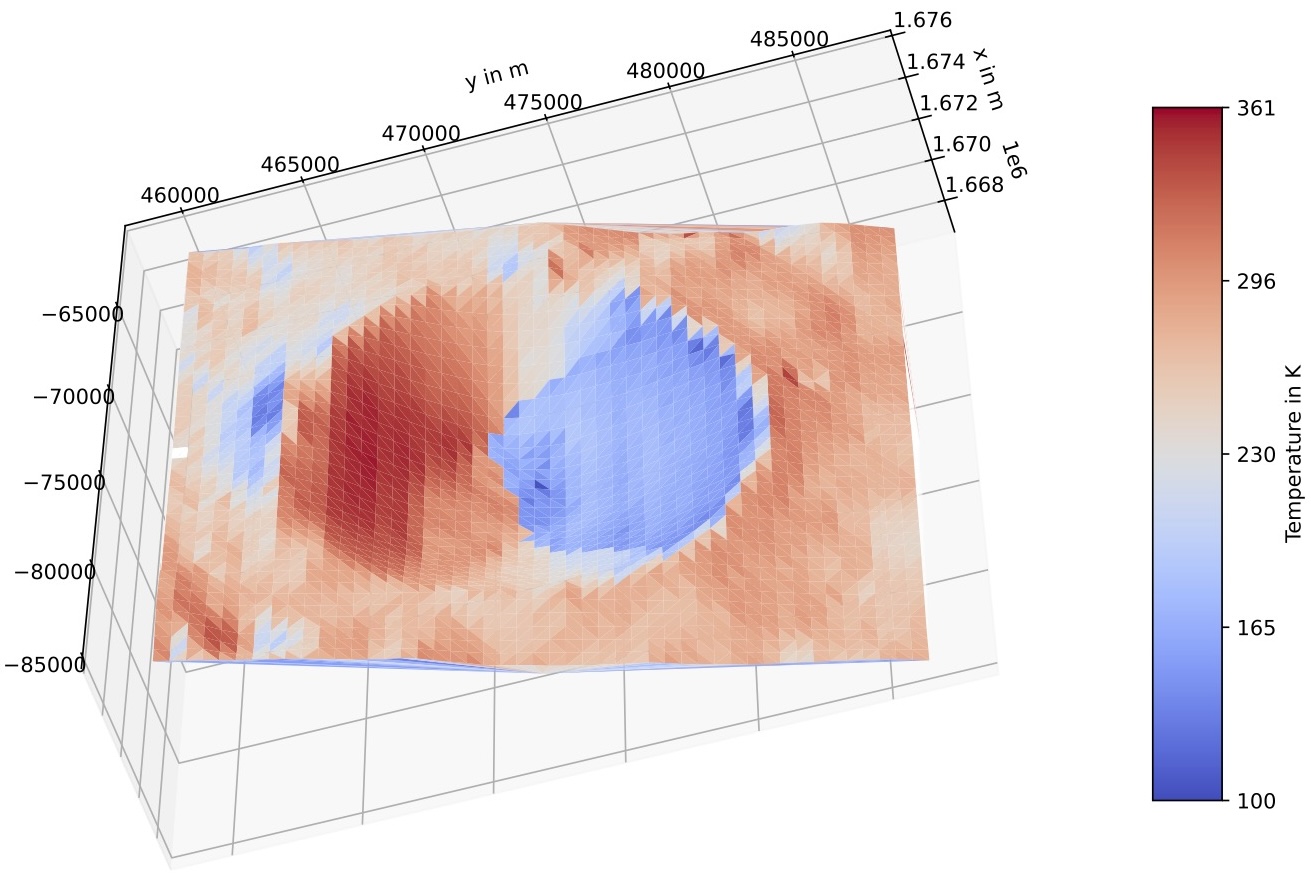
Figure 2: Equilibrium surface temperature distribution for solar incidence angle of e⊙ = 20.07° with angle-dependent albedo (Feng et al. 2020) for the Theon Junior crater.
Outlook
In the future, the sub-surface heat flow will be taken into account by coupling the thermal model of Bürger et al. (2024) with the surface boundary condition determined here to obtain more accurate surface temperatures and temperatures of the deeper layers of the regolith.
The primary objective is then to determine the water ice stability as a function of location and depth. This will provide us with valuable constraints for upcoming missions and instruments searching for water ice at the lunar South pole, such as the Prospect drill, in order to identify suitable drilling targets.
References
Boazman, S. J. et al. (2023). 54th LPSC. Vol. 2806. LPI Contributions, 2019. Bürger, J. et al. (2024). JGR Planets 129.3. Feng, J. et al. (2020). JGR Planets 125.1, e2019JE006130. Foote, E. J. et al. (2020). Icarus 336, 113456. Gläser, P. et al. (2019). A&A 627, A129. Hayne, P. O. et al. (2017). JGR Planets 122.12, 2371–2400. Ingersoll, A. P. et al. (1992). Icarus 100.1, 40–47. Keihm, S. J. (1984). Icarus 60.3, 568–589. King, O. et al. (2020). P&SS, 182, 104790. Paige, D. A. et al. (2010). Science, 330.6003, 479–482. Potter, S. F. et al. (2023). J. Comput. Phys., X 17, 100130. Vasavada, A. (1999). Icarus 141.2, 179–193. Vasavada, A. R. et al. (2012). JGR Planets 117.E12.
How to cite: Volkhardt, E., Bürger, J., and Blum, J.: 3D Surface Radiative Transfer Model via Raytracing for Airless Bodies with the Application to Lunar Craters and Possible Ice-Stability, Europlanet Science Congress 2024, Berlin, Germany, 8–13 Sep 2024, EPSC2024-84, https://doi.org/10.5194/epsc2024-84, 2024.
Introduction: Dark mantle deposits (DMDs) are one of the lunar lithological units commonly composed of mafic minerals mixed with pyroclasts [1,2]. Lunar pyroclasts in the form of partially crystallized Fe-Ti bearing volcanic glasses provide records of the early history of lunar volcanism [3]. DMDs of diverse nature in terms of their mineralogy and physical characteristics indicate complex nature of lunar explosive volcanism which is not yet fully understood.
This study focuses on regional (>1000 km2) pyroclastic deposits around Sinus Aestuum (12.1˚ N, 8.3˚ W) and Aristarchus (23.7˚ N, 47.5˚ W) regions and local deposits (<1000 km2) at Atlas (46.3˚ N, 44.9˚ E) and Alphonsus (13.4˚ S, 2.8˚ W) craters.
Data and methods: We constructed reflectance mosaics of the study regions using level-2 spectral reflectance data of the Moon Mineralogical Mapper (M3) onboard Chandrayaan-1 [6] for carrying out the mineralogical analysis. We prepared false color composite (FCC) (Fig. 1) images of these region following the methodology described in [7]. We used the Fe and TiO2 maps of [8] and [9], respectively, to assess the compositional variation over these studied regions in comparison with lunar volcanic glasses [10], mare and highland soil samples [LSCC] [11]. We acquired multiband polarimetric images of pyroclastic deposits using a monochrome industrial camera DZK 33GX250 of The Image Source company mounted on the 43 cm telescope of the Physical Research Laboratory observatory, situated at Mount Abu, India. We followed the data processing steps mentioned in [12].
Results and Discussion: Lunar volcanic glasses have overlapping spectral characteristics in the visible to near-infrared (VIS-NIR) wavelength range with other common mafic minerals (e.g., Olivine, Pyroxene) [2]. Hence, its remote detection is feasible only if more than 70 wt.% volcanic glass present in the mafic mixture [1]. Fig. 1 shows that the FCC scheme used here can identify pyroclastics successfully. DMDs are showing distinct color variation from the surroundings, presumably due to presence of volcanic glasses in the crystalline matter. Olivine-enriched mafic mixture is represented by the yellowish trend, whereas cyan color corresponds to the fresh craters with spectral signature of pyroxene. Based on the amount of pyroxene present on the surface, the shades of green are changing from one rock unit to other. Anorthositic rock type is characterized by red pixels, whereas blue pixels represent pyroxene-bearing and highly weathered mafic compositions. Though using uniform methodology over different regions, DMDs (outlined by white dashed line in Fig. 1) are reflecting variation in color, which indicates that DMDs have heterogeneous mineralogical and compositional association.
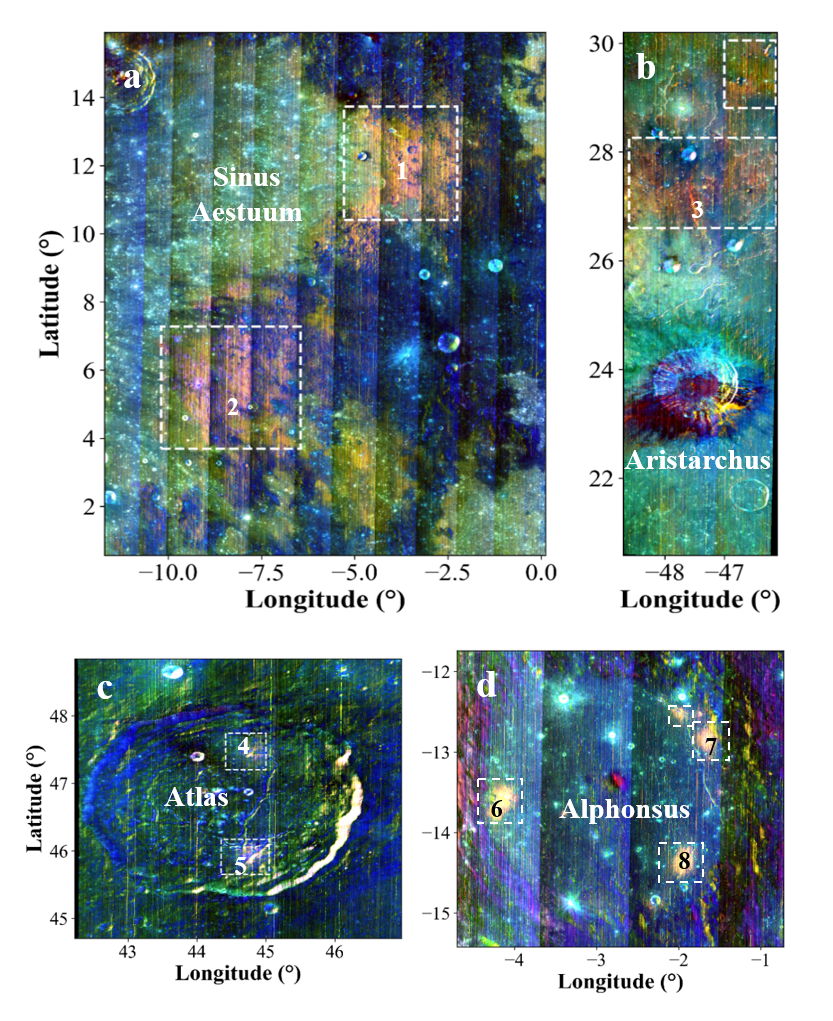
Figure 1: FCC of the M3 based mosaic around the study regions. (a) Sinus Aestuum, (b) Aristarchus, (c) Atlas, and (d) Alphonsus, respectively. The FCC color scheme is: avg. glass BD [red], avg. BD I [green], avg. BD II [blue]. The regions outlined by white dashed lines represent the DMDs.
To understand the compositional variations within DMDs exposed at different locations, we plot FeO vs. TiO2 in Fig. 2. The compositional variations of Apollo sample glasses [10] area also plotted along with lunar highland and mare soil samples in the background for a reference.
Figure 2: Average FeO variation with respect to mean TiO2 concentration around the study regions. Lunar sample data from different Apollo missions are denoted through distinct shape of legend. Highland and mare soil sample data are plotted in gray and brown color, respectively. Volcanic glasses are represented in their true color (e.g., green, yellow, orange, black, and red) except very-low Ti (VLT) glasses (marked in blue). The error bars correspond to one standard deviation.
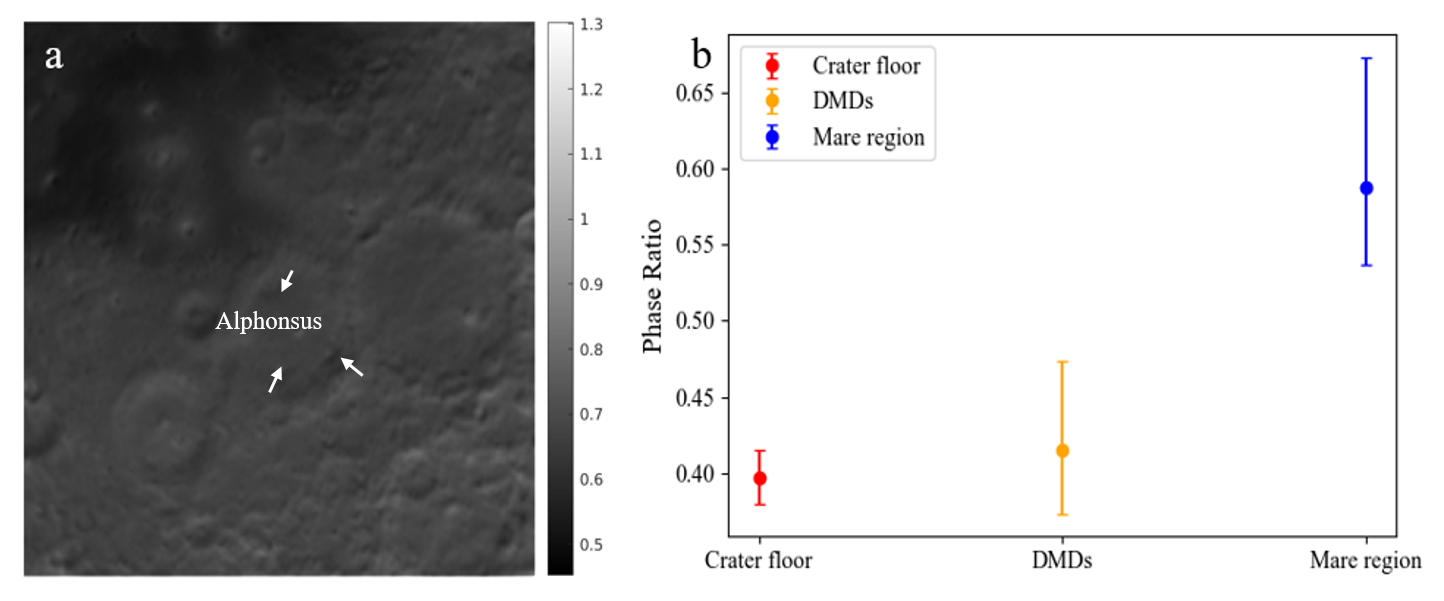
Figure 3: (a) Phase ratio intensity (19/4) image of crater Alphonsus and its surroundings in I filter. (b) Variation in average phase ratio in DMDs, crater floor, and mare region.
The regional DMDs around Aristarchus and the local deposits in Alphonsus crater have relatively high Fe and very-low to low Ti concentration, similar to the composition of reported green and VLT lunar volcanic glasses. In the case of Atlas crater, the northern deposit has very low Fe and Ti similar to Apollo 14 highland soil, whereas the southern deposit has intermediate Fe and Ti concentration, similar to the Apollo 17 mare soil. Possibly the northern deposit is more strongly contaminated by highland crater ejecta, corresponding to a heterogeneity on the surface that leads to compositional variations within DMDs across the small areal extent of Atlas crater. On the other hand, both regional deposits in the Sinus Aestuum region have high Fe and Ti concentrations. It can be inferred that the northern deposit of this region has a higher glass content, similar to the composition of orange glass, whereas in the southern deposit pyroclastic materials are less and mixed with surrounding mare composition.
Phase ratio images (Fig. 3) are a proxy to understand variation of surface roughness and porosity. As the variation range is small, we extracted average phase ratio values from the Alphonsus crater floor, nearby mare region and from DMDs (Fig. 3b). We observed that the phase ratio values of DMDs are intermediate to mare and highland regions. Further, we will be deriving polarimetric properties of Pyroclastics in the negative branch of polarization as part of the integrating framework for analyzing DMDs. The work will be extended to all DMD locations considered from nearside of the Moon.
References: [1] Horgan, B.H. et al. (2014), Icarus, 234, 132-154; [2] Bennet, K.A. et al. (2016) Icarus, 273, 296-314; [3] Gaddis, L.R. et al. (1985), Icarus, 61 (3), 461-489; [4] Head, J. W. and Wilson, L. (1979), LPSC, 10, 2861-2897; [5] Gaddis et al. (2003), Icarus, 161(2), 262-280; [6] Green et al. (2011), JGR Planets, 116 (E10); [7] Misra, D. et al. (2024), LPI Contributions, 3040, 2134; [8] Bhatt, M. et al. (2019). Astronomy & Astrophysics, 627, A155; [9] Sato, H. et al. (2017), Icarus, 296, 216-238; [10] Delano, J. W. (1986), JGR: Solid Earth, 91 (B4), 201-213; [11] Taylor, L.A., et al., 2001, JGR, 106 (E110, 27, 985-28, 000; [12] Wöhler C. et al. (2024), AJ, 167:187.
How to cite: Misra, D., Bhatt, M., Wöhler, C., Arnaut, M., Rai, N., Srivastava, N., Ganesh, S., and Bhardwaj, A.: Towards understanding spectral and physical characteristics of lunar pyroclastics, Europlanet Science Congress 2024, Berlin, Germany, 8–13 Sep 2024, EPSC2024-1085, https://doi.org/10.5194/epsc2024-1085, 2024.
Motivation
Solar wind ion precipitation on airless rocky bodies like the Moon has been linked to a variety of processes summarised by the term space weathering, including darkening and a red shift in optical reflectance spectra, the formation of vesicles and implantation of ions in mineral grains and the formation of an amorphised rim therein [1]. Solar wind irradiation additionally leads to the release of surface material via the kinetic sputtering process. These ejecta undergo ballistic trajectories and take part in the formation of the Lunar exosphere, which is well documented by space missions and ground-based observations. To properly gauge the importance of the sputtering contribution, however, a more detailed physical implementation of the sputtering process is necessary than used so far in, e.g., [2]. Prior, this has typically been approximated by simulation codes using the binary collision approximation (BCA) like SRIM [3], see also the review in [4]. On the other hand, more recent literature suggests significant limitations of this software [5,6] – especially related to real-life surfaces like lunar regolith. We present a combined experimental and numerical work on the sputtering yields of lunar regolith and discuss the validity of popular BCA codes.
Methods
Experimental data on sputtering yields, i.e., the amount of material released normalised per number of incidence ions, were obtained using a quarz crystal microblance (QCM) setup [7]. To overcome limitations on the sample configuration that come with this approach, an additional QCM served as a catcher for the sputtered material [8]. This allowed us to conduct experiments on rough bulk samples and additionally probe the ejecta angular distribution. We perform such experiments with lunar regolith (from Apollo 16 sample #68501) and helium and hydrogen ions at solar wind energies of 1 keV/nucleon. Numerical investigations were carried out both using SRIM and variants of SDTrimSP in its 1D and 3D version [9]. The latter in particular enables systematic investigations with varying surface roughness comparable to the experiments, as well as surface porosity resembling the regolith structures observed on the Moon [10].
Results
In line with previous studies, a comparison for flat samples reveals that the BCA approach consistently overestimates sputtering yields, with SRIM deviating the most [6]. By introducing surface roughness through consideration of regolith grains, the sputtering yield as a function of incidence angle is both flattened and reduced. Both effects become even more pronounced when surface porosity is included in the description. Three-dimensional simulations match these results qualitatively and, when the initial offset is factored out, also quantitatively. We will present these findings in greater detail and discuss possible implications in the context of the lunar exosphere.
[1] B. Hapke, J. Geophys. Res. Planets 106 (2001) 10039–10073.
[2] P. Wurz, U. Rohner, J.A. Whitby, C. Kolb, et al., Icarus 191 (2007) 486–496.
[3] J.F. Ziegler, M.D. Ziegler, J.P. Biersack, Nucl. Instrum. Methods. Phys. Res. B 268 (2010) 1818–1823.
[4] P. Wurz, S. Fatemi, A. Galli, J. Halekas, et al., Space. Sci. Rev. 218 (2022) 10.
[5] K. Wittmaack, Nucl. Instrum. Methods Phys. Res. B 380 (2016) 57–70.
[6] P.S. Szabo, H. Biber, N. Jäggi, M. Brenner, et al., ApJ 891 (2020) 100.
[7] G. Hayderer, M. Schmid, P. Varga, HP. Winter, et al., Rev. Sci. Instrum. 70 (1999) 3696–3700.
[8] H. Biber, J. Brötzner, N. Jäggi, P.S. Szabo, et al., Planet. Sci. J. 3 (2022) 271.
[9] U. von Toussaint, A. Mutzke, A. Manhard, Phys. Scr. 2017 (2017) 014056.
[10] P.S. Szabo, A.R. Poppe, H. Biber, A. Mutzke, et al., Geophys. Res. Lett. 49 (2022) e2022GL101232
How to cite: Brötzner, J., Biber, H., Szabo, P. S., Jäggi, N., Nenning, A., Fuchs, L., Mutzke, A., Galli, A., Wurz, P., and Aumayr, F.: Roughness and porosity significantly reduce the sputtering yield of solar wind ions on the lunar surface, Europlanet Science Congress 2024, Berlin, Germany, 8–13 Sep 2024, EPSC2024-243, https://doi.org/10.5194/epsc2024-243, 2024.
-
Mission description
The Negative Ions at the Lunar Surface (NILS) instrument (Fig. 1) is the first instrument to measure negative ions directly on the lunar surface. Launched aboard the Chinese Chang’E-6 sample-return mission on May 3, 2024, the instrument will land on the lunar far-side (South Pole-Aitken basin) in early June 2024. During the surface phase of the lander, the NILS instrument will be active, measuring negative ion and electron fluxes from the lunar surface.
-
Scientific objectives
When the solar wind interacts with the lunar surface, a portion of it is reflected back instead of being absorbed. Previous studies have provided evidence of neutral hydrogen atoms [1] and solar wind protons [2] being reflected from the surface. However, to date, no measurements of negative ions have been conducted. It remains unclear whether a significant population of negative ions exists near the lunar surface. The NILS instrument, the first-ever dedicated negative ion instrument flown beyond the Earth, will address this gap by performing in-situ measurements directly on the lunar surface.
-
Instrument description
The NILS instrument is a 9th generation instrument of the SWIM family [3]. NILS uses a surface-interaction based time-of-flight system combined with an electrostatic analyzer and an electrostatic elevation scanning system to measure the direction-, energy-, and mass-resolved negative ion flux on the surface. A electromagnetic electron suppression system allows to switch between negative ion and electron measurements. NILS can separate the main solar wind components as well as negative sputtered oxygen ions and heavier species. Key performance parameters are shown in Table 1.
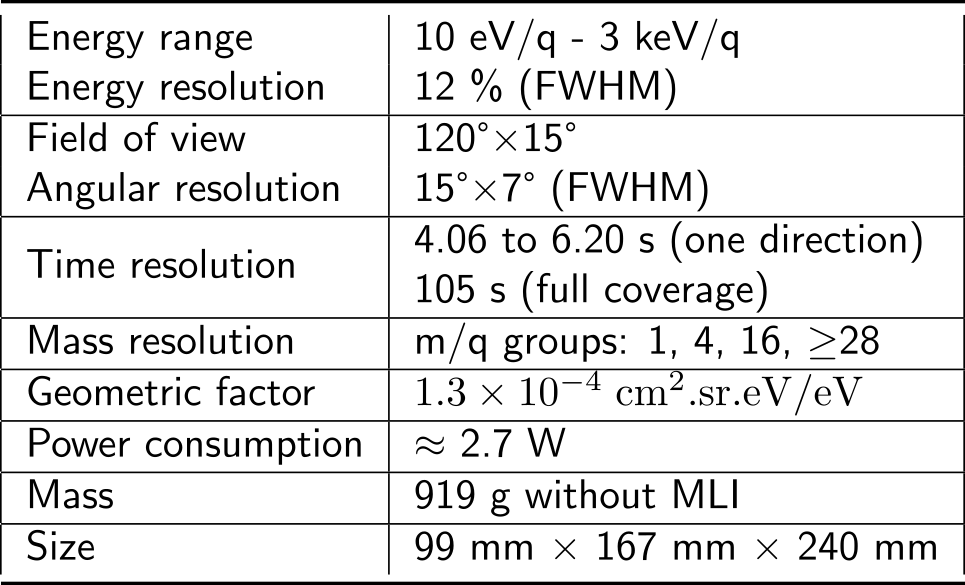
Table 1: Instrument performances
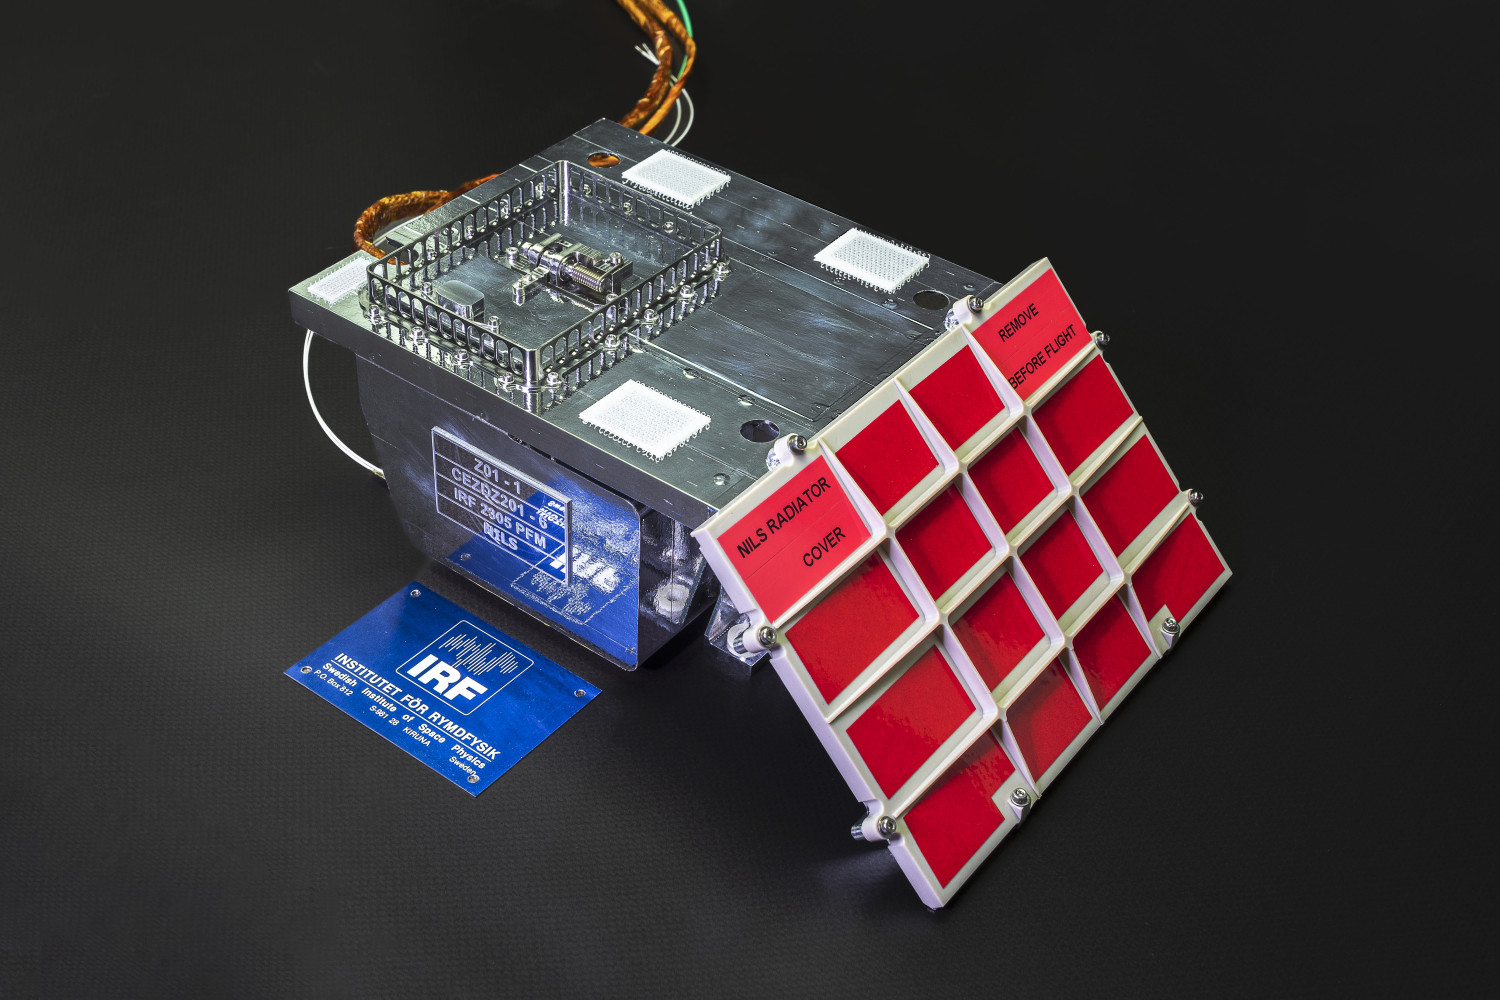
Figure 1: NILS flight model
At the Europlanet Science Congress 2024, we present and interpret the first data obtained and discuss the implications of the observed negative ion flux on the lunar near-surface plasma environment.
-
References
[1] M. Wieser, S. Barabash, Y. Futaana, M. Holmström, A. Bhardwaj, R. Sridharan, M. B. Dhanya, A. Schaufelberger, P. Wurz, and K. Asamura. First observation of a mini-magnetosphere above a lunar magnetic anomaly using energetic neutral atoms. Geophys. Res. Lett., 37(5), 03 2010.
[2] Y. Saito, S. Yokota, T. Tanaka, K. Asamura, M. N. Nishino, M. Fujimoto, H. Tsunakawa, H. Shibuya, M. Matsushima, H. Shimizu, F. Takahashi, T. Mukai, and T. Terasawa. Solar wind proton reflection at the lunar surface: Low energy ion measurement by map-pace onboard selene (kaguya). Geophys. Res. Lett., 35, 12 2008.
[3] M. Wieser and S. Barabash. A family for miniature, easily reconfigurable particle sensors for space plasma measurements. Journal of Geophysical Research: Space Physics, 2016
How to cite: Canu-Blot, R., Wieser, M., Barabash, S., Kérényi, M., Xiao-Dong, W., and Melville, N.: The Negative Ions at the Lunar Surface (NILS) instrument on Chang’E-6: the instrument, objectives and first results, Europlanet Science Congress 2024, Berlin, Germany, 8–13 Sep 2024, EPSC2024-308, https://doi.org/10.5194/epsc2024-308, 2024.
1. The LUMIO mission
The Lunar Meteoroid Impacts Observer (LUMIO) mission represents a critical step in advancing our understanding of the meteoroid population nearby the Earth-Moon system [1]. This 12U CubeSat, coordinated by the European Space Agency (ESA) and supported by the Italian Space Agency (ASI) and the Norwegian Space Agency (NOSA), is designed to observe and characterize meteoroid impact on the lunar far side. Utilizing the LUMIO-Cam, an optical instrument sensitive to the visible and near-infrared spectrum (450-950 nm), the mission aims to detect impact flashes from a quasi-halo orbit at Earth-Moon L2 [2], enhancing the global knowledge base beyond the capabilities of Earth-based observations (Figure 2).
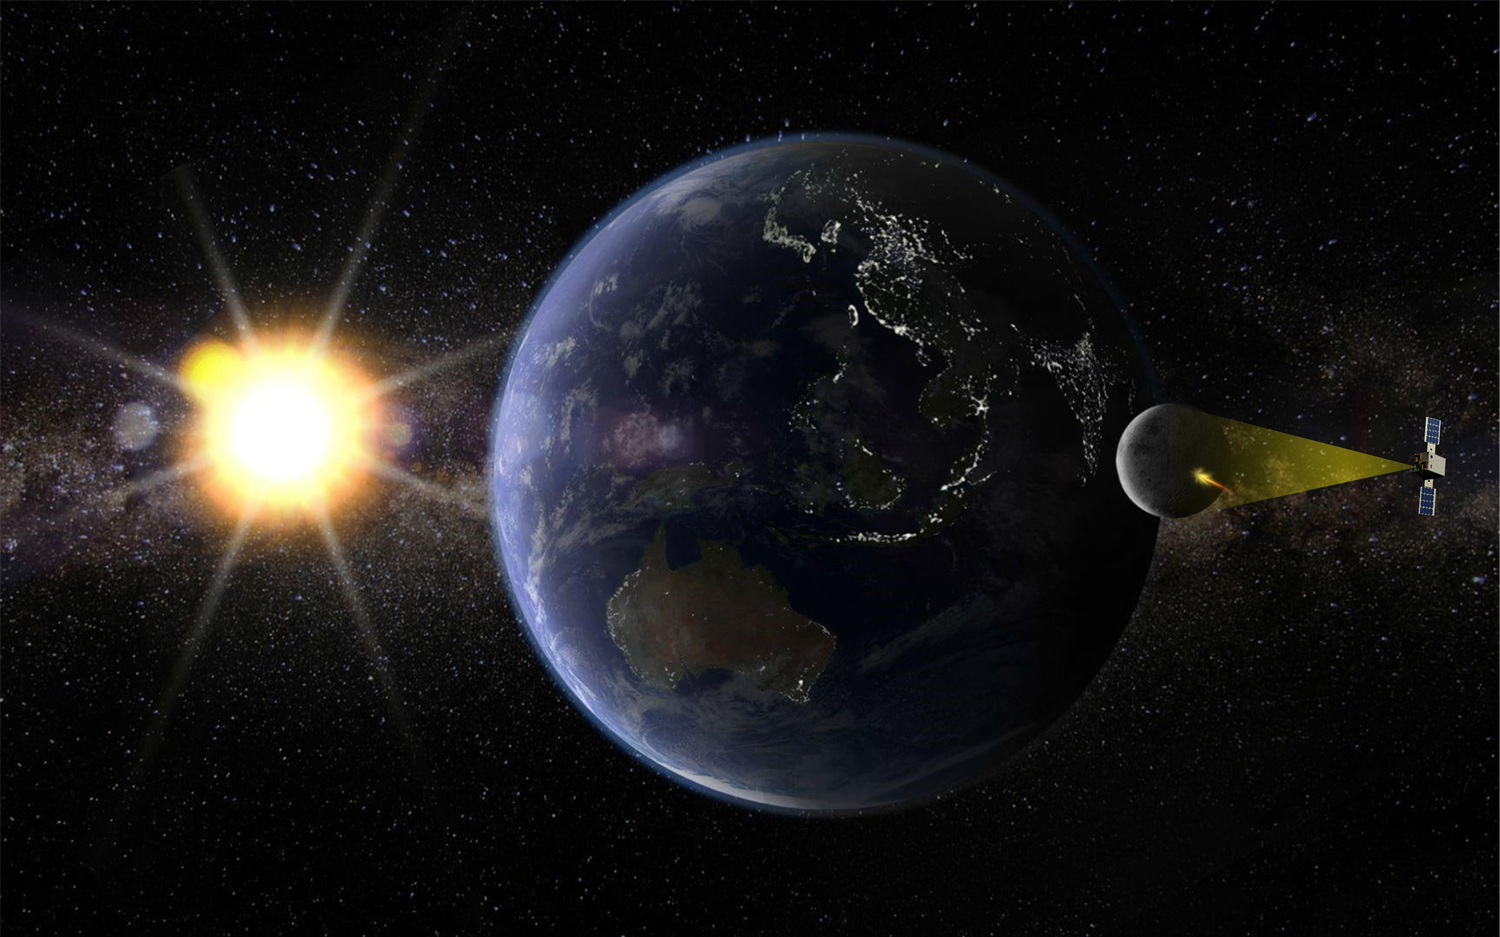
Figure 1. Schematic representation of an impact flash detected by LUMIO on the lunar farside.
The continuous influx of meteoroids into the Earth-Moon system poses a not well characterized risk to space assets. The Moon, devoid of an atmospheric shield, faces direct impacts from these space rocks, which alter its surface and could potentially jeopardize human and robotic missions aimed at prolonged lunar habitation [3]. As plans for lunar colonization advance, a comprehensive characterization of the meteoroid environment becomes paramount to ensure the safety and success of these endeavors. Furthermore, LUMIO seeks to resolve existing discrepancies within meteoroid bombardment models concerning the impact ratio at the poles compared to equatorial regions: current models show variance in predicting meteoroid impacts across different latitude [4].
LUMIO will employ a vision-based navigation algorithm that utilizes a limb-based approach to accurately determine the spacecraft's position relative to the Moon [5]. This algorithm achieves sub-pixel accuracy of less than 0.2 pixels in numerical simulations. Such positioning will directly influence the correct localization of lunar impact flashes.
2. Scientific challenges of LUMIO
Although LUMIO could precisely pinpoint the impact location of a meteoroid, the spacecraft would primarily capture the kinetic energy. This limitation presents a challenge in deriving detailed information about the characteristics of the impactor. To gain insights into the meteoroid's composition and velocity, LUMIO's observations will be correlated with known meteoroid streams. However, in the absence of velocity vector measurements, this analysis will depend on statistical models, specifically, machine learning algorithms are well-suited for this task. These models will facilitate the estimation of the meteoroid's properties and impact conditions, which will be relatively straightforward during the peaks of the most active meteor showers and increasingly complex with the minor ones.
Thanks to observing campaigns coordinated concurrently with ground-based networks, well-characterized meteors will facilitate the establishment of the size distribution of meteoroid streams for specific time periods. This information can then be extrapolated to LUMIO detections on the lunar far side during the same times. Additionally, this approach will enable the analysis of potential substructures or components within the meteoroid stream, which may lead to variations in meteoric activity between the Moon and Earth.
The inferred meteoroid parameters and impact conditions will be further utilized to enhance scientific investigation such as impact modeling.
3. Refining prediction models
Recent advancements in the predictive models for meteoroid impact observations, spearheaded by the Department of Aerospace Science and Technology (DART) at the Polytechnic University of Milan (PoliMi), have introduced the Payload, Orbit, and Environment (POE) and the Meteoroid Gun (MeGun) models [6]. These models now incorporate over 50 meteoroid streams and a comprehensive meteoroid background, with efforts underway to expand to more than 500 streams [7]. Such enhancements are anticipated to increase the expected observations of impact flashes by approximately 10% [6]. Moreover, these models will account for lunar surface obstructions by local topography, which vary based on the impact location. This data is derived from a global digital elevation model of the Moon [8], utilizing Monte Carlo ray tracing techniques (Figure 2).
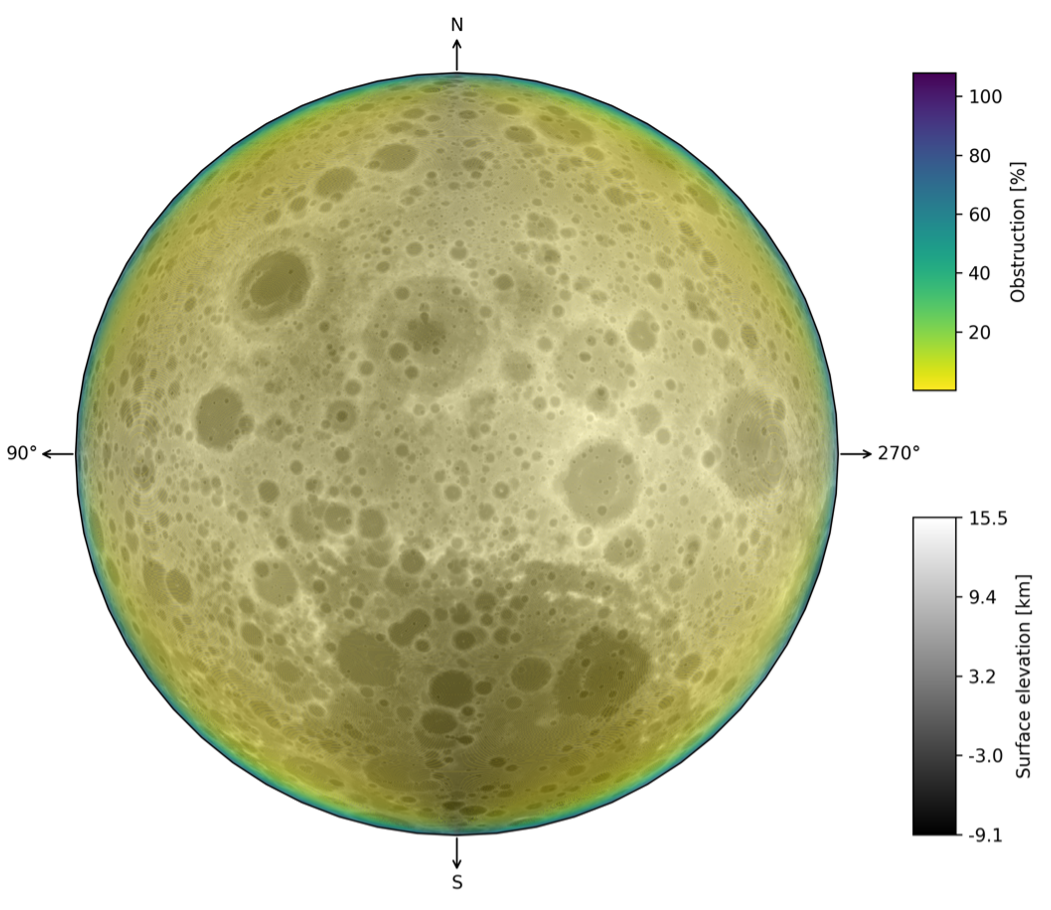
Figure 2. Surface obstruction of the lunar farside from 36000 km of altitude.
Furthermore, LUMIO's approach to image generation, which considers relevant detector noises and optical head effects, aims to produce radiometrically consistent images that reflect the observational geometry between LUMIO, the Moon, and the Sun. These efforts will be combined for software and hardware-in-the-loop (HIL) testing, with future developments planned to incorporate synthetic impact flashes.
4. Conclusions
In conclusion, LUMIO stands as a fundamental mission in the cislunar space exploration endeavor, poised to significantly enhance the fidelity of meteoroid models and thus support both scientific research and planetary defense mechanisms. The integration of advanced algorithms, enhanced modeling capacities, and innovative imaging techniques marks a significant progression in our capabilities to predict and understand the phenomena occurring within our near-Earth environment.
Acknowledgements
The scientific activities of LUMIO are supported by the Italian Space Agency (ASI), whereas the Phase B engineering work has been conducted under ESA Contract No. 4000139301/22/NL/AS within the General Support Technology Programme (GSTP) through the support of the national delegations of Italy (ASI) and Norway (NOSA).
References
[1] Topputo, F., Merisio, G., Franzese, V., Giordano, C., Massari, M., Pilato, G., ... & Koschny, D. (2023). Meteoroids detection with the LUMIO lunar CubeSat. Icarus, 389, 115213.
[2] Cipriano, A. M., Dei Tos, D. A., & Topputo, F. (2018). Orbit design for LUMIO: The lunar meteoroid impacts observer. Frontiers in Astronomy and Space Sciences, 5, 29.
[3] Robertson, D., Pokorný, P., Granvik, M., Wheeler, L., & Rumpf, C. (2021). Latitude variation of flux and impact angle of asteroid collisions with Earth and the Moon. The Planetary Science Journal, 2(3), 88.
[4] Drolshagen, G. (2008). Impact effects from small size meteoroids and space debris. Advances in space Research, 41(7), 1123-1131.
[5] Panicucci, P., Piccolo, F., Rizza, A., Merisio, G., Topputo, F., & Walker, R. (2024). Vision-Based Navigation for the LUMIO CubeSat Mission. In 46th AAS Guidance, Navigation and Control Conference (pp. 1-20).
[6] Merisio, G., & Topputo, F. (2023). Present-day model of lunar meteoroids and their impact flashes for LUMIO mission. Icarus, 389, 115180.
[7] Jenniskens, P. (2023). Atlas of Earth's Meteor Showers. Elsevier.
[8] Smith, D. E., Zuber, M. T., Neumann, G. A., Lemoine, F. G., Torrence, M. H., McGarry, J. F., Rowlands, D. D., et al. (2010). Initial observations from the Lunar Orbiter Laser Altimeter (LOLA). Geophysical Research Letters, 37(18).
How to cite: Peña-Asensio, E., Ferrari, F., Topputo, F., Koschny, D., Ammannito, E., and Moissl, R.: The LUMIO mission: refining prediction models for meteoroid impact observation on the lunar farside, Europlanet Science Congress 2024, Berlin, Germany, 8–13 Sep 2024, EPSC2024-471, https://doi.org/10.5194/epsc2024-471, 2024.
The lunar environment is known to be characterized by complex interactions between plasma, the exosphere, dust, and the surface. However, our understanding of the environment is limited due to the lack of experimental evidence. Here we propose a small, low-cost mission to characterize the dust and exosphere environment of the Moon. Named the Limb Pathfinder (LimPa), this is a proof-of-concept mission aimed toward understanding the coupling between plasma, dust, and tenuous neutral atmosphere. The LimPa mission was proposed to a call for the Small Mission to the Moon issued by European Space Agency in 2023. LimPa is designed to examine the dust exosphere above the lunar polar regions by using an utterly novel remote-sensing technique to measure the solar wind hydrogen atoms—the solar wind protons that are neutralized to hydrogen atoms (Figure 1). Its goals are 1) to detect for the first time the neutralized solar wind hydrogen produced by exospheric gas and levitated dust; 2) to measure the height profiles of the levitated dust and exospheric gas densities; and 3) to determine the emission mechanism of the horizon glow. Our baseline design of the LimPa mission is a 12U CubeSat (Figure 2). Three highly matured instruments are used: an energetic neutral atom camera, a proton sensor, and a camera system. The LimPa CubeSat is proposed to be inserted into a circular lunar polar orbit, with an altitude of 100 km as a baseline. The Sun-pointing attitude will allow measurements of neutralized solar wind that are produced by the exosphere and dust grains above the polar regions. The nominal lifetime is for three months as a pathfinder mission. The LimPa mission will open a new window to remote characterization of the lunar dust exosphere environment above the poles, and will demonstrate that this monitoring can be achieved with a simple and low-cost instrument system and spacecraft operation. The concept to be proven by the LimPa mission will enable long-term monitoring of the fragile dust exosphere environment, which substantially impacts on lunar exploration and will be significantly altered by human activities.

Figure 1: A conceptual illustration of the LimPa mission. The solar wind protons (pink trajectories) are neutralized by the exospheric gas or by the dust grains (green trajectories). By measuring these neutrals by LimPa Cubesat, we can retrieve the exosphere and dust information near the Moon.
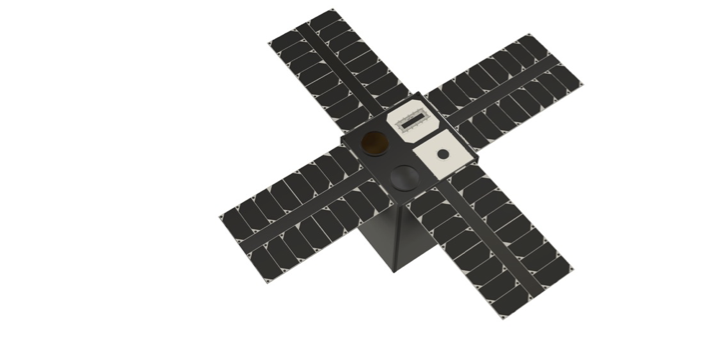
Figure 2: A conceptual design of the LimPa Cubesat (12U).
How to cite: Futaana, Y., Kallio, E., Knuuttila, O., Nyman, L., Shimoyama, M., and Barabash, S.: LimPa mission: A small mission proposal to characterize the enigmatic lunar dust exosphere, Europlanet Science Congress 2024, Berlin, Germany, 8–13 Sep 2024, EPSC2024-515, https://doi.org/10.5194/epsc2024-515, 2024.
Lunar lava tubes are of significant interest for potential human exploration of the Moon, therefore it is important to study their subsurface extent and physical properties in detail. The underground existence of the lava tubes in the mare regions due to past volcanic activity has been predicted in the past (e.g. [1,2]) and orbiting missions for gravity surveys (GRAIL) and radar investigations (Lunar Radar Sounder onboard SELENE) have identified candidate locations of these subsurface structures (e.g. [3-5]). But only global constraints could be inferred, because the spatial resolution achievable from orbit is not sufficient compared to the estimated extents of the lava caves. To better understand the real extent and depth of the lava tubes, measurements on the lunar surface have to be performed. In this study we propose surface microgravity survey techniques to measure gravitational anomalies. A gravimeter experiment on a lunar rover would map out the spatial variation of the surface gravity and constrain subsurface voids shown as mass deficits accurately when traversing a lava tube. Microgravity survey yield very high spatially resolved gravity mapping. Microgravity surveys is a geophysical mapping technique commonly used on Erath to aid the location of buried features such as faults, sinkholes, tunnels and voids associated with mines, quarries as well as lava tubes [6]. The Traverse Gravimeter Experiment (TGE) on the Apollo 17 Lunar mission, allowed to determine presence and properties of a higher density lava flow [7,8]. Microgravimeter measurements can be made across linear profiles and/or equally spaced grids at survey stations in varying increments dependent on the depth of investigation.
Here, we will present the lunar microgravimetric survey concept to explore subsurface extent and physical properties of lunar lava caves. For different scenarios consisting of different depth size etc. of subsurface lava tubes, the gravitational anomalies will be calculated and the traverse gravity survey will be simulated [9]. The measurements concepts and instrument requirements will be presented. A possible application of this study is the robotic explorer concept LunarLeaper [10], recently selected from the ESA 2023 Small Missions for Exploration call for a Pre-Phase A study.
These measurements are ideally supported by ground penetrating radar (GPR) measurements, a technique commonly used on Earth to map shallow subsurface structures using electromagnetic reflection waves. GPR has been successfully applied to various problems in the geological, archaeological, and engineering fields as well as on mapping of lava tubes [11-14]. This combined, non-intrusive method, can help to characterize the physical properties of the lava tubes, as for example their stability and the composition of the surrounding material. These are important considerations for future human exploration of the Moon.
References: [1] Murase and McBirney, 1970, Science 167, 1491. [2] Greeley, 1971, The moon, 3, doi:10.1007/BF00561842. [3] Chappaz et al., 2017, Geophysical Research Letters, 44, doi :10.1002/2016GL071588. [4] Kaku et al., 2017, Geophysical Research Letters, 44, doi.org/10.1002/2017GL074998. [5] Zhu et al., 2024, Icarus, doi :10.1016/j.icarus.2023.115814. [6] Deroussi et al., 2009, Journal of Volcanology and Geothermal Research, 184, doi:10.1016/j.jvolgeores.2008.10.002. [7] Talwani and Kahle, 1976, NASA STIRecon Tech. Rep. A, vol. 77. [8] Urbancic et al., 2017, Journal of Geophysical Research: Planets, 122, doi:10.1002/2017JE005296. [9] Noeker and Karatekin, 2022, EPSC2022-361, Europlanet Science Congress. [10] Mittelholz et al., 2024, EGU General Assembly, doi:10.5194/egusphere-egu24-21578 [11] Esmaeili et al., 2020, Journal of Geophysical Research: Planets, 125, doi:10.1029/2019JE006138. [12] Miyamoto et al., 2005, Geophysical Research Letters, 32, doi:10.1029/2005GL024159. [13] Rowell et al., 2010 CREWES Research Report, 22. [14] Gómez-Ortiz, 2014, Journal of Applied Geophysics, 109, doi:10.1016/j.jappgeo.2014.07.009.
How to cite: Ritter, B., Karatekin, Ö., Mittelholz, A., and Stähler, S. C.: Exploring subsurface extent and physical properties of lunar lava tubes using surface microgravity survey, Europlanet Science Congress 2024, Berlin, Germany, 8–13 Sep 2024, EPSC2024-904, https://doi.org/10.5194/epsc2024-904, 2024.
Introduction
The polarisation of the sunlight reflected by the surface of the Moon contains information about the structural properties of the surficial regolith layer, such as the grain size and the microscale roughness [1, 2]. The internal structure or layering of regolith grains can be assessed using wavelength-dependent polarisation data [3]. Most of the existing lunar polarisation data were acquired at large phase angles exceeding approximately 23° in the visible wavelength range and were in part linked quantitatively to structural regolith properties based on laboratory experiments [e.g., 1, 2, 3, 4, 5]. At smaller phase angles, in the so-called ``negative polarisation branch'', the lunar polarisation is less well understood, and especially polarisation imaging data of high spatial resolution are scarce [e.g., 6, 7]. In this work, we present first results of a telescopic observation campaign aiming at the acquisition of multispectral (Johnson-Cousins UBVRI) imaging polarimetric data at small phase angles of a variety of typical lunar terrain types, including maria, highlands, pyroclastic deposits and fresh crater materials.
Data and Methods
The dataset analysed in this study was acquired during five nights between February 21st and 26th, 2024, at phase angles between 4° and 30° with a reflector telescope of 430 mm aperture and 3000 mm focal length at Mount Abu Observatory in Rajasthan, India. We used a monochrome the Imaging Source DZK 33UX250 industrial polarisation camera, which is constructed such that the individual sensor pixels are equipped with polarization filters rotated by 0°, 45°, 90° and 135°. In that way, for each 2 by 2 pixels neighbourhood of sensor pixels values for the intensity, degree of polarisation (DoLP) and angle of polarisation (AoLP) can be obtained [8]. The image scale is 0.9 km per pixel, the spectral filter set is Johnson-Cousins UBVRI ranging from the near-ultraviolet throughout the visible range into the near-infrared domain. To obtain a polarisation image, a set of 3500 individual camera frames was acquired, the individual sub-frames corresponding to the four polarization directions were extracted, and the sharpest 10% of the sub-frames were selected and stacked with the software Autostakkert3 [9].
So far, our analysis is restricted to the DoLP inferred from the stacked images. The telescopic data were georeferenced to the Lunar Reconnaissance Orbiter (LRO) Wide Angle Camera (WAC) mosaic as described in [4, 5], resulting in one image cube per wavelength channel containing the pixel-wise DoLP in dependence on the phase angle. To each pixel of each image cube, a third-degree polynomial with zero intercept was fitted [7], allowing for a computation of the absolute value Pmin of the minimal DoLP, the phase angle αmin at which the minimum occurs, the phase angle of inversion αinv of zero DoLP, and the slope h of the DoLP vs. phase angle curve at αinv [7]. The resulting 20 polarisation features were transformed to zero mean and unit standard deviation, and a Principal Component Analysis (PCA) [10] was applied. The small DoLP values in the negative polarisation branch have the effect that only the scores on the first 2-3 principal components are not dominated by noise.
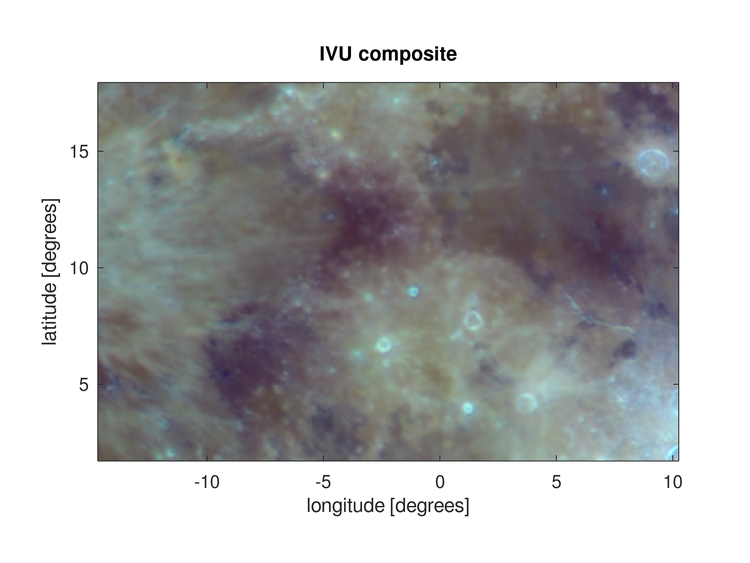
Fig. 1: IVU composite of the study area. Colour saturation has been enhanced.
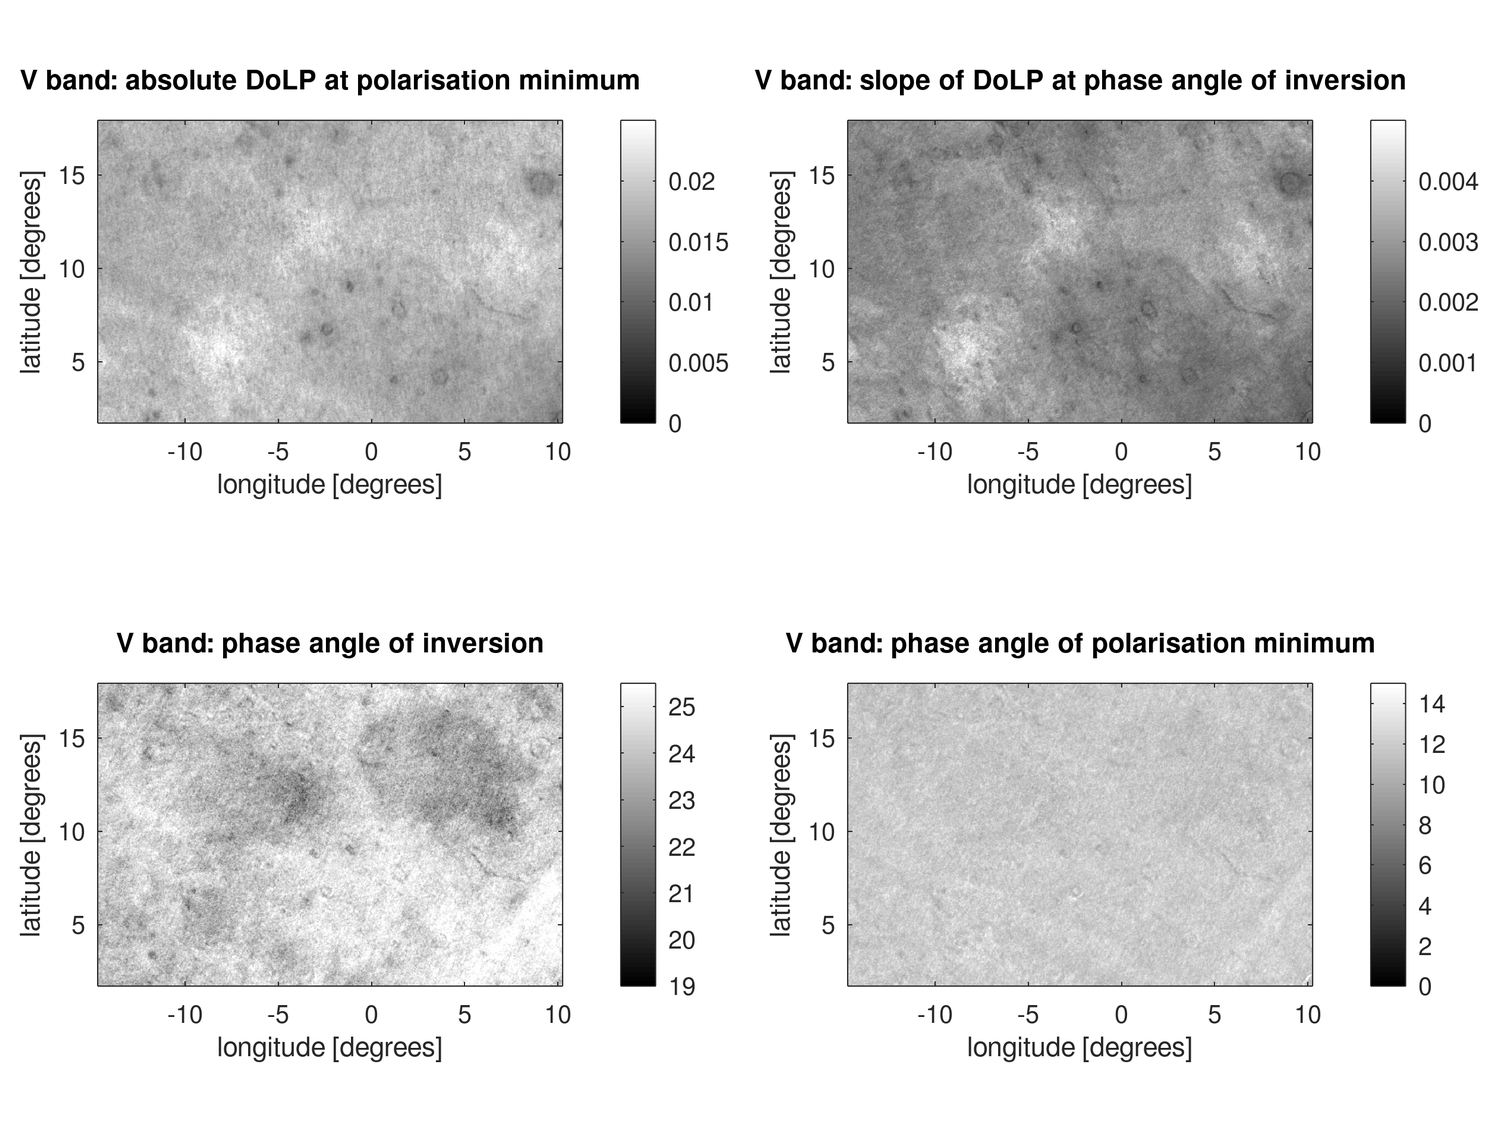
Fig. 2: Derived polarisation parameters in the V band.
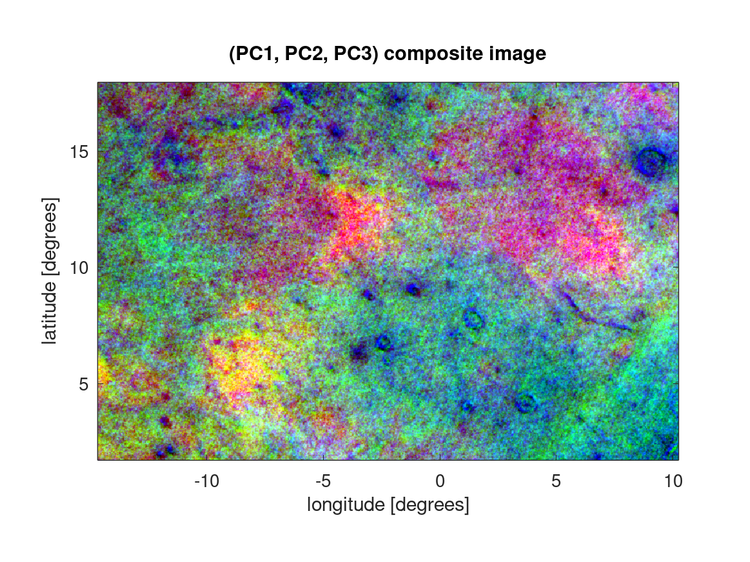
Fig. 3: PCA composite image of the study area.
Results and Discussion
Our study area is located between the lunar craters Copernicus and Manilius and comprises the mare regions of Sinus Aestuum and Mare Vaporum, the neighbouring highland terrain, and the well-known regional pyroclastic deposits near Rima Bode, in Sinus Aestuum and in Mare Vaporum [e.g., 11]. For orientation, Fig. 1 depicts an RGB composite consisting of the I, V and U channels. Maps of the polarisation parameters Pmin, αmin, αinv and h in the V band are shown in Fig. 2 and the scores on the first three principal components in Fig. 3.
Fig. 2 shows that Pmin and h hardly differ between dark mature maria and brighter neighbouring highlands, but pyroclastic deposits stand out as positive anomalies and fresh craters as negative anomalies. Both parameters are correlated with the grain size inferred in [5] from the DoLP at large phase angles. The value of αinv is generally different for maria than for highlands, whereas αmin shows a weak dependence on the terrain. The PCA of the polarisation parameters indicates that each terrain type, in particular pyroclastic deposit terrain, is represented by a specific signature, corresponding to variations in the behaviour of the polarisation parameters. The peculiar behaviour exhibited by pyroclastic deposits in the negative polarisation branch, which is different from that of normal mature mare surfaces, may be due to unusual structural regolith properties as a consequence of their formation by explosive volcanism. Laboratory analyses and physical modelling studies are needed to quantitatively link the observed polarisation parameters in the negative branch to specific structural regolith parameters.
References
[1] Shkuratov, Y. and Opanasenko, N. (1992) Icarus 99(2), 468-484.
[2] Dollfus, A. (1998) Icarus 136(1), 69-103.
[3] Shkuratov, Y. et al. (2007) Icarus 187(2), 406-416.
[4] Bhatt, M. et al. (2023) A&A 674, A82.
[5] Wöhler, C. et al. (2024) AJ 167:187.
[6] Shkuratov, Y. et al. (1992) Icarus 95, 283-299.
[7] Opanasenko, N. et al. (2022) LPSC LIII, 1194.
[8] The Imaging Source (2019) https://www.theimagingsource.com/de-de/product/unique/33u-polarsens/?resolution=5013504&fps=75&mono_color=monochrome
[9] Kraaikamp, E. (2023) https://www.autostakkert.com
[10] Marsland, S. (2015) Machine Learning: An Algorithmic Perspective. 2nd ed., CRC Press.
[11] Gaddis, L. et al. (2003) Icarus 161(2), 262-280.
How to cite: Wöhler, C., Bhatt, M., Arnaut, M., Misra, D., Ganesh, S., and Bhardwaj, A.: Terrain-dependent spectral properties of lunar polarisation at small phase angles, Europlanet Science Congress 2024, Berlin, Germany, 8–13 Sep 2024, EPSC2024-995, https://doi.org/10.5194/epsc2024-995, 2024.
The chronology function and production function have been widely used to derive the model ages of lunar mare regions from crater size-frequency distributions (CSFDs). Challenges remain in homogenous counting area selection, crater saturation and crater rim identification. Geological unit-based ages are also difficult to study the continuous surface evolution among adjacent areas. Using regression-learning models, we have tried a new method on the Em4 unit of the Chang’e 5 landing area to explore a quantitative relationship between ages and surface morphometric expressions by using texture features. Four features (Contrast, Energy, Entropy and Homogeneity), together with a stepwise linear model (SL) and a linear support-vector-machine model (LS) are well selected to produce a pixel-level continuous age map of the Em4 unit. Mean age values of 1.75 ±0.26 Ga and 1.69 ±0.22 Ga obtained respectively from the two models are consistent with the ages of Chang’e 5 samples returned from this area. Both texture features and age maps are separated along the NW-SE sinuous rilles (Rima Sharp and Rima Mairan). Comprehensively considering geology, geomorphology, and newly retrieved ages of the study region, we have proposed a three-stage evolution process for the Em4 unit. Our new age-retrieving method is useful to obtain a pixel-level high-resolution age map in the study region and has the potential to be widely used in other lunar mare areas.
How to cite: Chen, Y. and Huang, Q.: Surface geological evolution in the Chang’e 5 landing area (Em4 unit) revealed by a new age-retrieving method from regression learning, Europlanet Science Congress 2024, Berlin, Germany, 8–13 Sep 2024, EPSC2024-1003, https://doi.org/10.5194/epsc2024-1003, 2024.
Introduction: LUNINA is an in-situ navigation and communication node. Proposed LUNINA platform is designed to be a compact, independent, cost effective, robust, and location independent navigation beacon and communication relay on the Moon that can operate 24/7.
The proposed concept is based on the ESA funded MiniPINS [1] project LINS platform capable of withstanding extended time periods on the lunar surface. The LINS was developed for the Schrödinger crater, but it can be deployed in any location on the Moon where there is at least some sunlight available. Each unit has been equipped with a RHU that keeps it warm and together with using solar panels and a battery is able to operate continuously.
The LUNINA node can be utilized in two main use cases, reliable navigation and communication on and around the moon. Each LUNINA unit provides the signal for navigation purposes. At an elevated location the unit helps with ground navigation for line-of-sight users as well as lunar orbit spacecraft. Accurate navigation is provided for applications such as spacecraft landing and launch from the lunar surface.
LUNINA node can work as a communication and data transfer relay for both ground and in-orbit users. At elevated location the node can cover a large surface area in line-of-sight and through a network of nodes relay messages. Around a base or other infrastructure, it can cover its vicinity and provide a communication link for the various applications.
Application: The LUNINA concept is a durable and relatively affordable navigation and communication node designed for lunar environment.
The MiniPINS developed the LINS capable of withstanding extended time periods on the lunar surface. An LTE system is used as a default communication and navigation payload for LUNINA platform.
The concept will work as a communication network and navigation aid for lunar missions, both on-ground and orbiting. The idea is to develop a 'drop and forget' long-term reliable element of a lunar infrastructure that will enable safe, reliable and flexible exploration of the lunar environment.
The LUNINA node can be deployed anywhere on the Moon where there is at least some sunlight present. The LINS platform was developed to operate on the Schrödinger crater (see Figure 1). Platform design has been equipped with a radioactive heating unit (RHU) that keeps the payload compartment warm and together with using solar panels and a battery the unit is able to operate continuously.
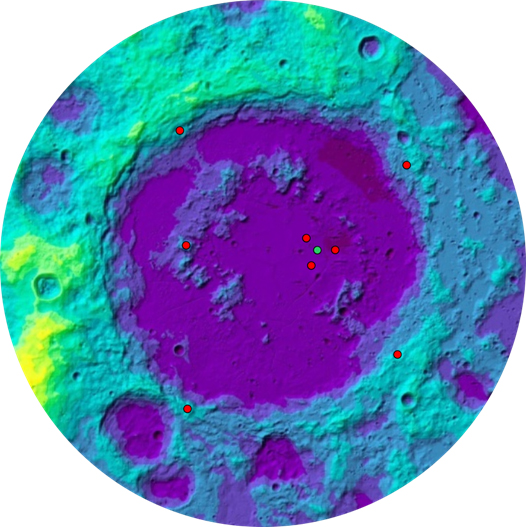
Figure 1: LUNINA nodes (in red dots) in Schrödinger crater around the Lunar Base (green dot).
The ESA MiniPINS LINS platform, as well as LUNINA, is designed to be deployed from a rover but can be modified to be deployable with other means such as from commercial lander missions.
The inclusion of an RHU would allow the thermalization of the in-situ LUNINA unit during the Lunar night, where energy storage need may lead to unaffordable battery volumes. Radioisotope power systems utilising americium-241 as a heat source fuel have been under development in Europe since 2009 as part of a European Space Agency funded programme led by the University of Leicester [2].
Use Case: The LUNINA node can be utilized in two main use cases - reliable navigation and communication on and around the Moon.
LUNINA can provide the signal with which different navigation methods can be used, such as ranging and range-rate. At an elevated location the node could help with ground navigation for line-of-sight users as well as lunar orbit spacecraft.
More accurate navigation could be provided for applications such as spacecraft landing and launch from the lunar surface with for example using the signal of more than one node around the surface launch site.
With respect to the communication, the node can work as a communication and data transfer relay for both ground and in-orbit users. At elevated location the node can cover a large surface area in line-of-sight and through a network of nodes relay messages. Around a base or other infrastructure, it can cover its vicinity and provide a reliable communication link for the various applications there, such as an ubiquitous safety and emergency link (see Figure 2).
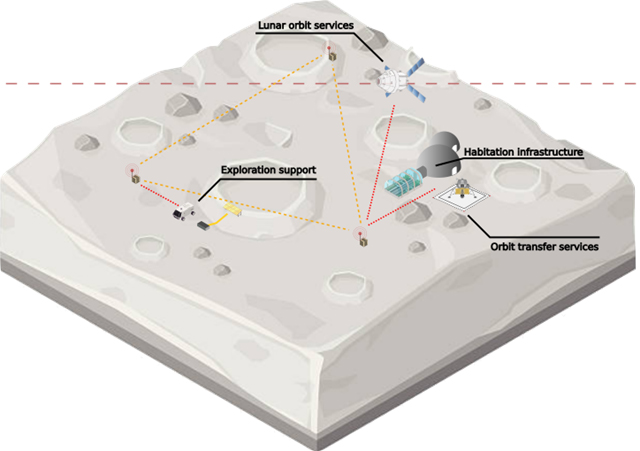
Figure 2: Different applications of the LUNINA node.
Once the LCNS (Lunar Communications and Navigation Services) space segment is available the node is modular and can be updated to continue as a supporting infrastructure. The node signal can be used as one more source to provide an even more accurate navigation solution. Its drop locations can be chosen such that it helps with any location or temporal blind spots for the LCNS satellite signals (such as for example near crater edges).
Innovation: LUNINA is designed to be a compact, independent, cost effective, robust, and location independent navigation beacon and communication relay on the Moon that can operate 24/7 in any location. It's designed to be 'invisible' infrastructure. The platform is modular, the payload is easily updatable as long as the new payload meets the platform's requirements. The innovative features of the LUNINA node are:
- Compactness. The platform is based on the MiniPINS LINS
- Independency. The LINS his designed to operate 24/7 on Lunar environment. The same approach is used in the LUNINA platform.
- Cost-effectiveness. Using the heritage LINS, standardized parts and systems and existing payloads, the costs of development is minimized. Once node is developed, the node can be mass produced, bringing down its cost.
- Robustness and modularity. The node will use standardized interfaces and form factors both for its payload as well as its software will also be updateable.
- Durability. The node will have a long lifetime. All the node components will be designed and tested with durability in mind, the software will be upgradeable, and the node functionality and interfacing follow standards.
- Location-independency. The node will be a small and independent system deployable anywhere on the Moon.
References:
[1] Genzer M., et. al. "MiniPINS - Miniature Planetary In-situ Sensors", EGU21-11282, EGU General Assembly 2021 (2021), https://doi.org/10.5194/egusphere-egu21-11282. Contract is carried out and funded by the European Space Agency activity no. 1000025265 in the “ESA-Star” System.
[2] Ambrosi, et al., "European Radioisotope Thermoelectric Generators (RTGs) and Radioisotope Heater Units (RHUs) for Space Science and Exploration.", Space Sci Rev 215, 55 (2019), https://doi.org/10.1007/s11214-019-0623-9
How to cite: Haukka, H., Kestilä, A., Arruego, I., Harri, A.-M., Genzer, M., Apéstigue, V., Hieta, M., Camañes, C., Ortega, C., Kivekäs, J., and Koskimaa, P.: Lunar In-situ Navigation and Communication Node - LUNINA, Europlanet Science Congress 2024, Berlin, Germany, 8–13 Sep 2024, EPSC2024-43, https://doi.org/10.5194/epsc2024-43, 2024.
1. The importance of studying lunar dust particles
International scientific and commercial interests in exploration missions to solar system bodies such as the Moon, asteroids and comets have increased significantly during the last two decades and will continue to increase in the future. One major environmental constraint during exploration missions is the presence of charged dust-like particles. They can be a threat for both human and robotic exploration missions.
The effects of lunar dust on Extra-Vehicular Activity systems can take many forms such as external vision obscuration, false instrument readings, dust coating and contamination, loss of traction, clogging of mechanisms, abrasion, thermal control problems and seal failures. One of the most serious effects is the compromising of astronaut health by irritation and inhalation of lunar dust.
Therefore, it is of utmost importance to characterise the properties of the dust particles present on the exploration sites and their transportation mechanisms to enable efficient mitigation techniques to be put in place. The main objective of DUSTER (Dust Study, Transport, and Electrostatic Removal for Exploration Missions) is to investigate in detail the charging and cohesion of the dust grain in the regolith. The project addresses key questions about the surfacing of airless bodies as observed by telescopes and scientific probes, such as the formation of dust ponds and the dust haze at the limb of the moon observed by the astronaut during the Apollo missions. It also addresses more engineering-oriented concerns regarding the adhesion of dust particles to man-made surfaces (spacecraft, instruments, spacesuits, solar panels, etc.).
The goal of DUSTER is to develop the instrumentation and technologies for in situ analysis of the electrical charging and transport of those dust particles. In addition, the project aims at developing a ground based test facility to validate the instrument in representative conditions and improve dust charging and transportation models.
2. The DUSTER instrument
Given that the surface gravity as well as the UV and soft X-ray fluxes, which are drivers for the electrical charging of the dust, can be obtained by existing measurement data or reliable modelling, those two physical quantities do not need to be measured by the instrument. The remaining parameters that are needed to quantify dust charging and electrostatic transportation are the level of charging, the ambient plasma and the current resulting from the displacement of the dust particles.
The level of charging is assessed by measuring the electric field above the dust layer with a DC E-Field probe and using the Gauss theorem. The ambient plasma parameters (electron density and temperature) are measured with a Langmuir probe. To study the dust particles displacement, a Faraday cup (FC) is placed above the dust layer. When a voltage is applied to the FC (up to several kV), this creates an E-field that applies a force on the charged particles. When the voltage is high enough, the charged particles are attracted inside the FC. By measuring the resulting current from the FC the amount of charged dust that has been moved can be quantified.
The block diagram of the multi-sensor instrument is depicted in Fig. 1. It includes three front ends with specific probes/electrodes.
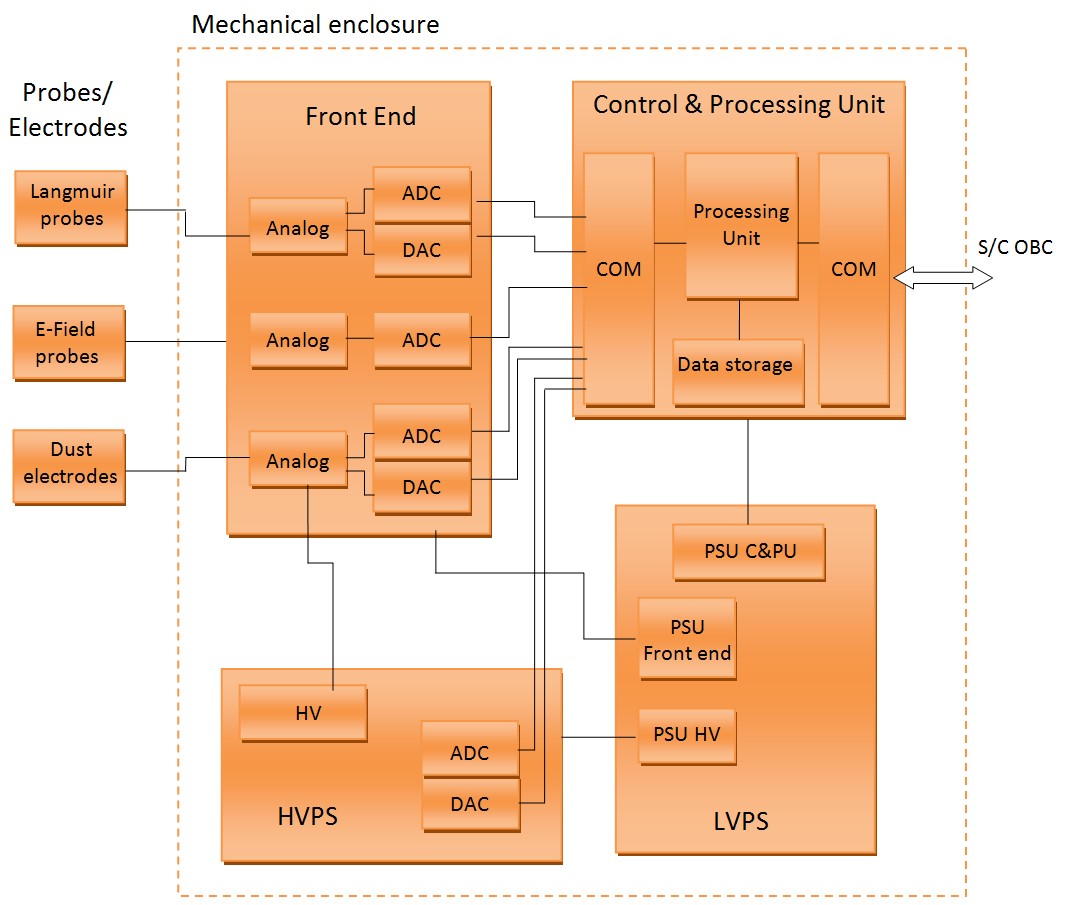
Fig. 1. Block diagram of the instrument.
The instrument prototype will be entirely designed by the members of the consortium. The electronics will include a Data Processing Unit (DPU), based on a FPGA design running a Leon3 microprocessor, and a Low Voltage Power Supply (LVPS) as main power interface for the instrument, both designed and built at IAA-CSIC. The very sensitive front ends which will acquire the readings and the High Voltage Power Supply (HVPS) are designed and built at BIRA-IASB. The probes/electrodes are designed and built at ONERA and BIRA-IASB.
The application software to control the instrument, implement the science sequences, acquire the data obtained from the probes, process it and send it through the spacecraft interface is developed at IAA-CSIC. The EMC tests will be carried out by TAS-E.
3. Preliminary results obtained with a dedicated laboratory test setup
The laboratory test setup is built on the existing DROP chamber at ONERA Toulouse, France (see Fig. 2). It is a vacuum chamber that allows irradiating the dust particles with a VUV lamp, includes a Kelvin probe to infer the charging level of the dust layer and accommodates an FC that is used to attract the dust particles and measure the current resulting from the displacement of the charges.
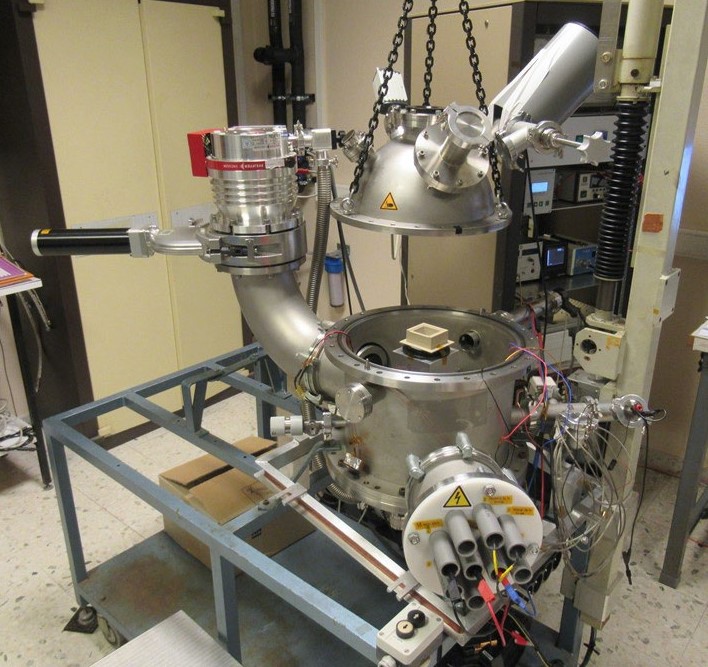
Fig. 2. DROP chamber at ONERA Toulouse, France.
An example of the measured signal from the FC when biased at 3 kV is depicted in Fig. 3. It shows that several charged dust grains (or aggregates of grains) are mobilised.
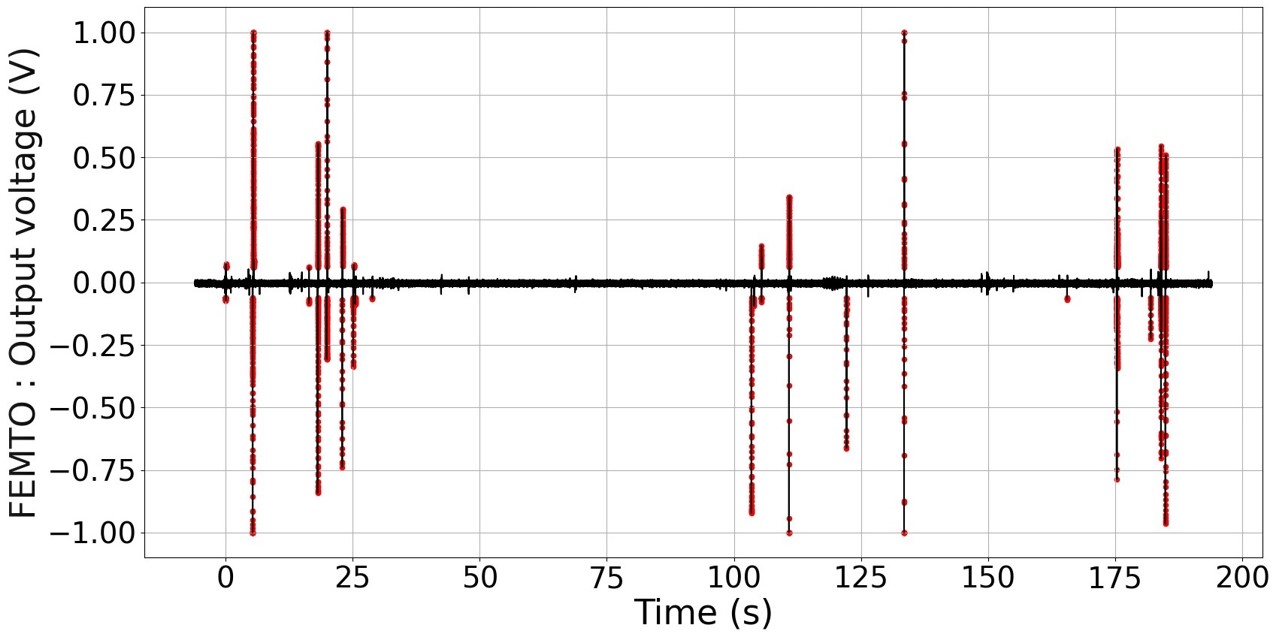
Fig. 3. Output voltage of the transimpedance amplifier as a function of the polarization time of the detector. The background noise is depicted in dark and the dust grain detection is highlighted in red. The detector is polarized at +3 kV after 5 minutes of VUV irradiation.
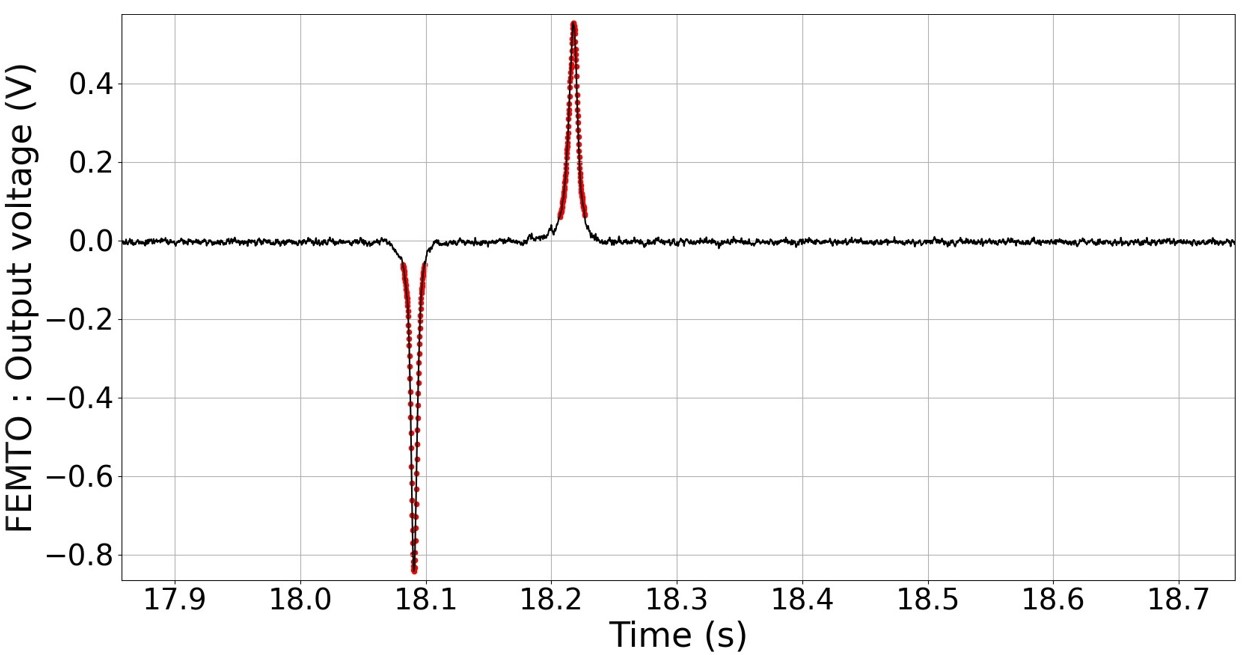
Fig. 4. Zoom in of the peaks at 18 seconds in Fig. 3. It shows a clear pair of two consecutive peaks of opposite polarity, indicating that the dust grain entered into the FC and then fell back onto the sample holder.
This project is funded by the European Union’s HORIZON Research and Innovation programme under grant agreement No 101082466. Views and opinions expressed are however those of the author(s) only and do not necessarily reflect those of the European Union or the granting authority. Neither the European Union nor the granting authority can be held responsible for them.
How to cite: Ranvier, S., Lefever, K., Matéo Vélez, J.-C., Candini, G. P., Anciaux, M., Pacaud, R., Pastor Morales, C., Sanz Mesa, R., Berkenbosch, S., Hess, S., Gómez Lopez, J. M., Sanchez Carrasco, M. A., Lobón Villanueva, F., Muñoz, O., Rodriguez Gomez, J., del Estal Fernández, V., and De Keyser, J.: DUSTER: Dust Study, Transport, and Electrostatic Removal for Exploration Missions, Europlanet Science Congress 2024, Berlin, Germany, 8–13 Sep 2024, EPSC2024-923, https://doi.org/10.5194/epsc2024-923, 2024.
Introduction: The depth to diameter ratio (d/D) of a crater is an important morphological parameter that represents the extent of crater degradation. Recently several studies utilized d/D of craters at Moon and Mercury’s poles as a possible indicator of water ice deposition [1, 2, 3]. The study conducted by [2] revealed a poleward decrease in d/D for both Mercury and the Moon for a diameter range of 2-15km. The gradual shallowing of craters towards the poles is particularly observed at the lunar south pole compared to the north pole which was attributed to the potential infilling by water ice. Also the craters with permanently shadowed regions (PSRs) on Moon was found to be shallower (lower d/D) as compared to the illuminated craters at lunar south pole.
Interestingly, the lunar north pole does not show similar d/D trend as the south pole [2]. However, several other measurements including neutron spectrometer, radar, illumination and temperature variations [4, 5, 6] suggest ice containing north polar region albeit with a lower ice concentration compared to the south pole. This observed discrepancy is the motivation of this work where we used an existing d/D catalogue and integrated the outcomes with several other parameters like temperature, radar based circular polarisation ratio (CPR) and NIR based water detections.
Methods: About 9100 simple craters spanning both the poles within a latitudinal range of 65° N/S to 90° N/S, with crater diameter range between 5-20 km were analyzed to understand if d/D can be used as a proxy to water ice filling. We considered already available illumination, temperature [6], CPR [7] and NIR [5] based water ice detection maps in order to establish the correlation if any with d/D parameter.
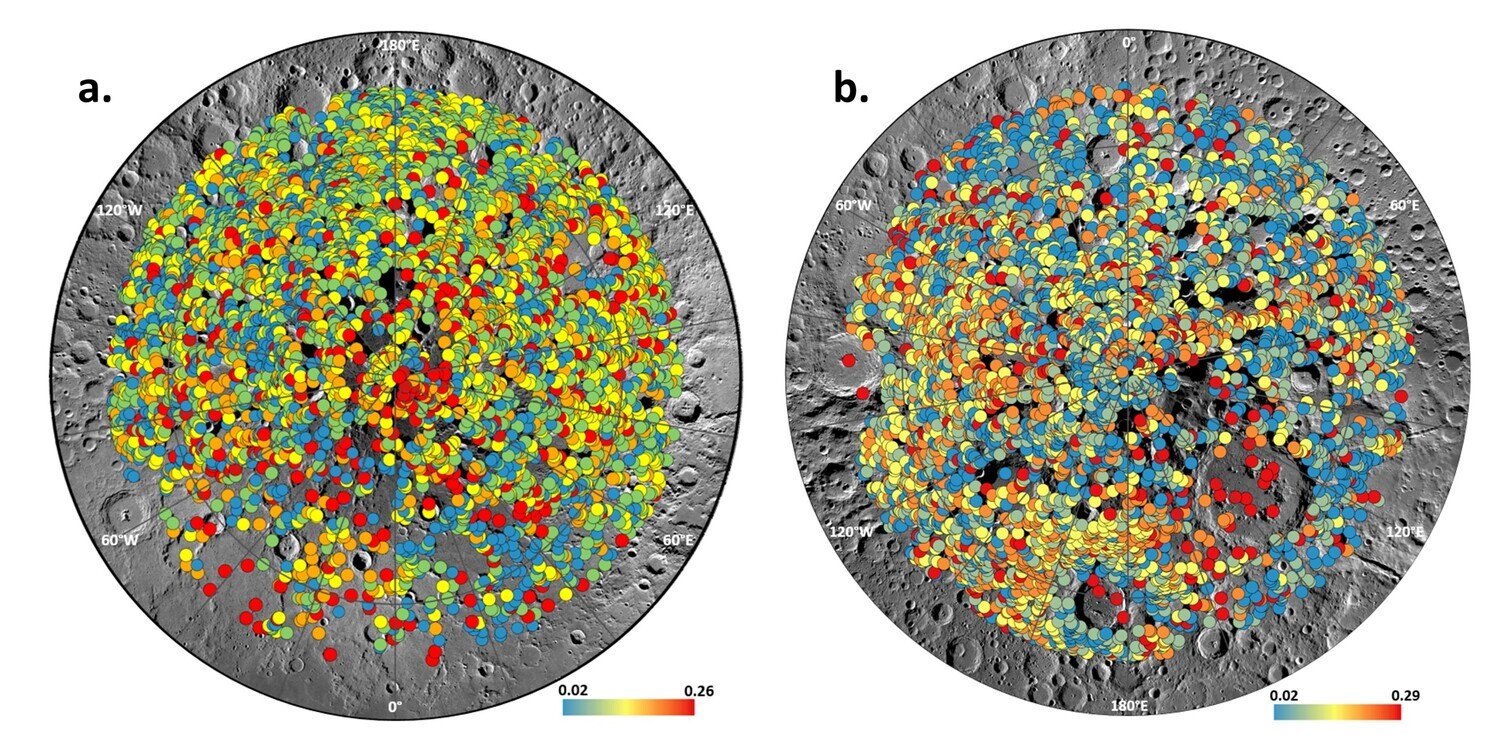
Fig 1. Depth to diameter (d/D) ratio distribution for craters of north (a) and south (b) poles. Base image LROC WAC mosaic.
Results: A gradual decrease in d/D ratio is observed at latitudes 80 ̊-90 ̊ for south pole (Fig 2) while an opposite trend is visible for North pole with increasing mean d/D with increasing latitude towards North. In order to correlate whether the observed trend especially for south pole is corresponding to water ice deposits, locations of craters with specific temperature conditions (below 110 K) [6], those confirmed to have water- ice deposits based on M3 observations [5], and those exhibiting anomalous behaviour according to circular polarization ratio (CPR) derived from Chandrayaan-2 Dual Frequency Synthetic Aperture Radar (DFSAR) [7] were incorporated to the plot (Fig 2).

Fig 2. The depth-to-diameter ratio (d/D) for craters at lunar poles: (a) north (65-90 ̊N) and (b) south (65-90 ̊S), integrated with temperature, DFSAR, and M3 observations. Black markers depict mean d/D in 3 ̊ bins. Dark grey markers signify non-PSR craters. The horizontal dashed line serves as a reference based on average d/D values at 65 ̊N/S.
As per the results from [2] it is anticipated that craters identified as water ice-rich using radar and NIR techniques would exhibit lower d/D values. However, contrary to expectations, Fig. 2 illustrates no clear correlation between d/D values and confirmed water ice detections. These findings highlight that the lower d/D of craters towards the poles might be influenced by additional factors and should not be singularly relied upon for estimating water ice filling. Also it is expected to have a lower d/D for craters with PSRs as compared to illuminated craters of the same diameter range due to water ice infilling in PSRs. Comparing the d/D of PSRs and non PSRs (illuminated craters) at both the poles, we found that the mean d/D value of PSRs and non-PSR craters differed, with the non-PSR craters having a significantly lower d/D. In case of the North Pole, this effect is particularly noticeable.
Conclusion: We found that the analysis of d/D ratio of craters is shown to have a latitudinal dependence in case of the south pole as observed by [2] but the obvious correlations with other measurement techniques are missing. The result so far is not supporting the decrease in d/D ratio and its linkage to water ice deposition. Also the contribution of sub surface ice deposits to the observed d/D trend cannot be ignored as the datasets used in the study have a detection limit of water ice only at surface level. Analysis involving changes in the slope of the crater due to water ice deposition is under progress which will further help in understanding clear trends if any on the topographic modification of craters due to water ice infilling.
References: Kokhanov et al., (2015) Sol. Sys. Res., 49, pp.295-302 [2] Rubanenko L. et al., (2019) Nat. Geosci., 12(8), 597-601. [3] Marco Figuera R. et al., (2022) Remote Sensing, 14(3), 450. [4] Lawrence D. J. (2006) JGR Planets, 111(E8). [5] Williams J. P. et al., (2019) JGR: Planets, 24, 2505–2521. [6] Li S. (2018) PNAS 115(36), 8907-8912. [7] Putrevu D. et al., (2023) JGR Planets, 128(12), e2023JE00774
How to cite: Sathyan, S., Bhatt, M., Kumar, S., Srivastava, N., and Bharadwaj, A.: Depth to diameter ratio of lunar craters and its possible correlation to the water ice deposits, Europlanet Science Congress 2024, Berlin, Germany, 8–13 Sep 2024, EPSC2024-1086, https://doi.org/10.5194/epsc2024-1086, 2024.
Please decide on your access
Please use the buttons below to download the supplementary material or to visit the external website where the presentation is linked. Regarding the external link, please note that Copernicus Meetings cannot accept any liability for the content and the website you will visit.
Forward to presentation link
You are going to open an external link to the presentation as indicated by the authors. Copernicus Meetings cannot accept any liability for the content and the website you will visit.
We are sorry, but presentations are only available for users who registered for the conference. Thank you.
For the future of sustainable space exploration, In-Situ Resource Utilization (ISRU) plays a key role. Thus, the investigation and development of new technologies focusing on utilizing local resources is crucial to cost-effective robotic and human space missions with less logistical effort. Water does not only serve as consumable for astronauts and plants but also as rocket propellant by electrolysing it into hydrogen and oxygen.
Therefore, the LUWEX (Validation of Lunar Water Extraction and Purification Technologies for In-Situ Propellant and Consumables Production) project aims to develop and validate a technology demonstrator for the extraction of water from icy-lunar-regolith simulant, the following purification and quality monitoring. Several experiments with different mixing ratios and material compositions will be conducted. The Technology Readiness Level (TRL) is increased for the whole process chain from TRL 2 and 3 to TRL 4 based on the planned experiments. The extraction, capturing and liquefaction subsystems are placed inside the thermal-vacuum chamber (TVAC) of the Comet Physics Laboratory (CoPhyLab) at TU Braunschweig, detailed in Kreuzig et al. 2021, to simulate the relevant lunar environment. The TVAC, including the extraction, capturing and liquefaction subsystems inside it, is shown in Fig.1. This image also shows the purification and quality monitoring subsystems placed on the tray on the right side of the chamber. Two liquid nitrogen cooling systems are utilized to cool the TVAC to an ambient temperature of around 100 K. The working pressure inside the TVAC is around 10-5 mbar. To realize the control of all subsystems inside the TVAC, a complex valve system, including 20 electric-pneumatic valves, is installed around it. Further, an electric-pneumatic slider is mounted between the capturing and liquefaction subsystems inside the TVAC (see Fig.1c). This is necessary as a cold trap consisting of two 3D-printed, actively cooled copper-cones is utilized to capture water vapour extracted from the regolith by heating with the liquefaction chamber mounted below it. Once water ice has deposited onto the cold trap, it is heated to release the ice into the liquefaction chamber. There, the ice is liquefied by heating the liquefaction chamber. To liquefy the ice, the pressure inside the liquefaction subsystem needs to increase to the vapour saturation pressure of water. The chamber is, therefore, separated from the cold trap utilizing the above-mentioned slider.
Besides providing an artificial lunar environment, the CoPhyLab is responsible for the production of icy simulant. Therefore, granular water ice with a mean grain size of 2.4 microns, which is produced with the ice machine outlined in Kreuzig et al. 2021, is mixed with lunar Highland simulant by Lunex Technologies. To prevent any thermal evolution of the water ice, the mixing is performed by adding liquid nitrogen to the materials. In the resulting mixture, the water ice particles are expected to be evenly distributed in the regolith. During the water ice production, impurities such as CO2 or methanol can be added.
The experiments with the LUWEX system will be performed in Summer 2024, and the first results will be presented in September. Firstly, an experiment run with an icy-lunar-regolith sample with around 50% water ice in mass is planned to characterize and test the sample preparation, infilling and the extraction, capturing and liquefaction subsystems. Then, icy-regolith samples with 5%, 10% and 15% water ice in mass will be realised, and the complete process chain, including purification and water quality monitoring, will be tested.
More information on the LUWEX project is available at https://luwex.space.
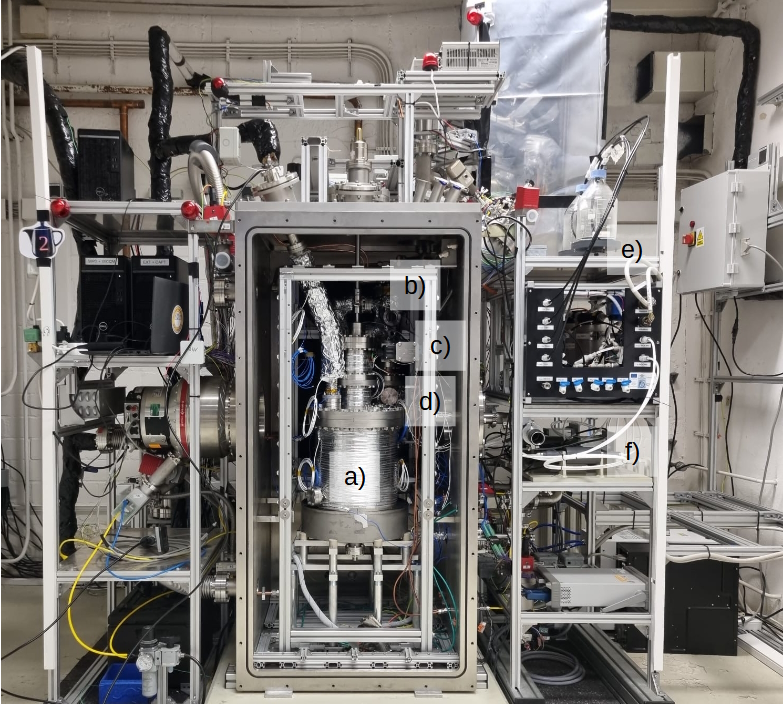
Figure 1: The CoPhyLab TVAC with the extraction (a), capturing (b) and liquefaction (d) subsystems mounted inside. A slider is installed between the capturing subsystem and the liquefaction (c). On the right side of the TVAC, the purification subsystem is placed with two storage tanks (e). Below the purification sits the quality monitoring subsystem (f). Image credit: Luca Kiewiet
References:
Kreuzig, C. et al. (2021). “The CoPhyLab comet-simulation chamber”. Review of Scientific Instruments 92.11, S.115102.
How to cite: Brecher, N., Kreuzig, C., Meier, G., Schuckart, C., and Blum, J.: In-situ extraction and purification of water on the moon – the LUWEX project, Europlanet Science Congress 2024, Berlin, Germany, 8–13 Sep 2024, EPSC2024-87, https://doi.org/10.5194/epsc2024-87, 2024.
Introduction and the map
Since the overview of Shackleton Crater by Zuber et al. (2012), geomorphologic structures on its floor have not been seriously considered. It was due to problems of visual observations in permanent darkness, and the limited number of morphometric variables used for the altimetry data analysis. Based on solution of these problems we built the objective borders of major landforms in Shackleton Crater (Fig. 1) and reconstructed their formation histories.
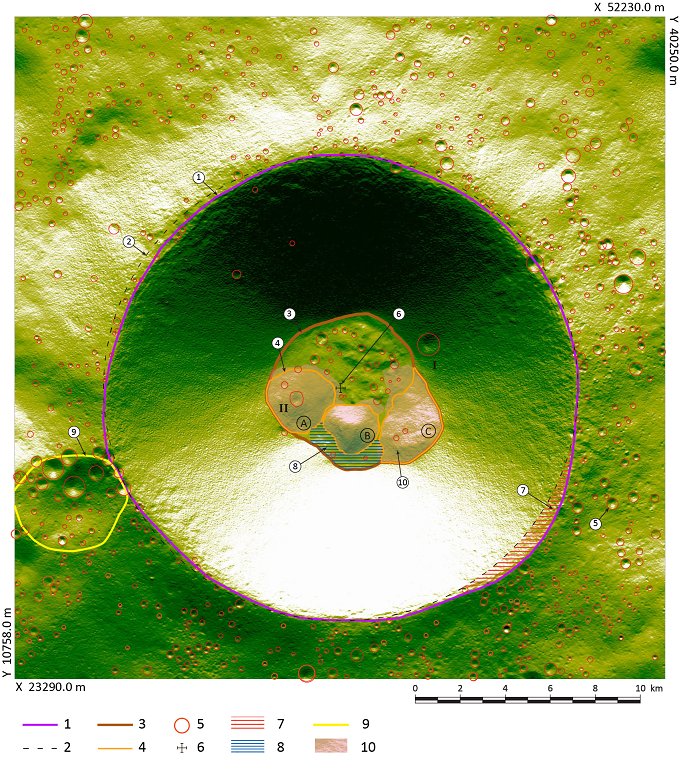
Figure 1. Map of major landforms in Shackleton Crater. “A”, “B” and “C” – main elevated structures on the crater floor. 1 – real top of Shackleton Crater rim. 2 – ideal circle approximated the top of Shackleton Crater rim. 3 – border of Shackleton Crater floor. 4 – border of the elevated structures “A”, “B” and “C”. 5 – clearly visible small impact craters with the size between 0.01 and 1.2 km2. 6 – geometric centre of Shackleton Crater: this centre was used for the polygons 1 and 2. 7 – area of possible landslide source above the elevated structure “C”. 8 – relatively flat field between the elevated structure “B” and the slope of Shackleton Crater. 9 – largest crater (in this article: “Shackleton-A”) located on exterior slope of Shackleton Crater rim above the structure “A”. 10 – area of the tree-like pattern detected by the map of kh on and around the elevated structures “A”, “B” and “C”. 11 – area of Shackleton’s foot slope deposits characterised by the linear pattern on the map of kh. I – remnants of the largest impact crater on the interior wall of Shackleton Crater. II – impact crater on the top of the elevated structure “A”. The background map shows artificial insolation. The lateral grid spacing is 20 m.
Methods
A Digital Elevation Model (DEM) with 20 m grid was constructed based on Lunar Orbiter Laser Altimeter (LOLA) data. To accurate description of the topography we performed a co-registration of the profiles (Stark et al. 2017). A video (Fig. 2) of the artificial insolation of this DEM from different angles is available at the YouTube channel "Land and Water CA" (Mitusov et al., 2022).
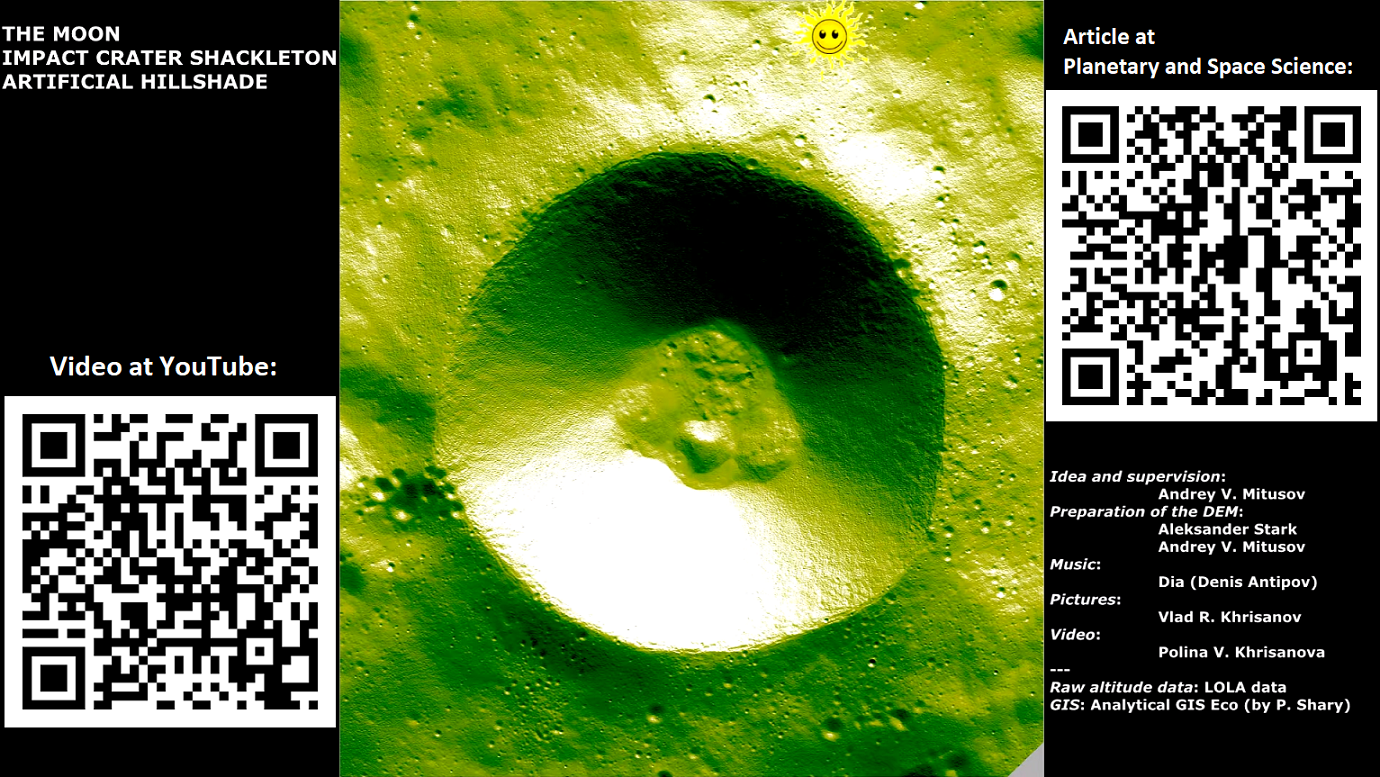
Figure 2. Video screenshot of the artificial insolation of the DEM from different angles at the YouTube channel "Land and Water CA" (Mitusov et al., 2022: https://www.youtube.com/watch?v=gAY0JYlOkK4).
The DEM was analysed for slope steepness, Maximal Catchment Area (MCA) and four curvatures: maximal (kmax), minimal (kmin), horizontal (kh) and vertical (kv). All Morphometric Variables (MVs) were calculated using Analytical GIS Eco (e.g. Shary et al., 2002).
The high sensitivity of MVs helps spatial localization of pixels with altitude anomalies. Based on this, we easily identified natural hidden structures and errors in the DEM.
Elevated structures “A”, “C” and “B”
Elevated structures "A" and "C" are clearly identified as landslides, confirming the opinion of Zuber et al., (2012). For both structures the material sources are visible at the top of Shackleton Crater rim as deviations of the real rim (Fig. 1, contour 1) from the ideal circle (Fig. 1, contour 2). The source area for landslide “C” (Fig. 1, polygon 7) is larger, and equals 5.9 km2. The most probable trigger of these landslides is the large meteorite impact visible as Shackleton-A Crater (Fig. 1, polygon 9).
The exposed initial floor of Shackleton and Shackleton-A are characterised by the comparable number of younger small craters. This confirms the formation of Shackleton-A, and landslides in the form of elevated structures “A” and “C”, relatively soon after the formation of Shackleton Crater itself.
The origin of elevated structure “B” is not related to any sedimentary process. We suggest two hypotheses of this structure formation: a central peak, or a small volcanic dome without central pit.
Slope erosion and sedimentation
The almost linear parallel stripes with kh > 0 in the foot slope zone (Fig. 1, polygon 11) are identified as granular debris flow terminations.
The shape and the slope inclination of elevated structures "A", "B" and "C" caused the lateral distribution of granular flows. This process formed the tree-like structures (Fig. 3). The rare occurrence of small craters (Fig. 1, index 5) confirms the tree-like pattern was formed due to long-term erosion, transition and accumulation.
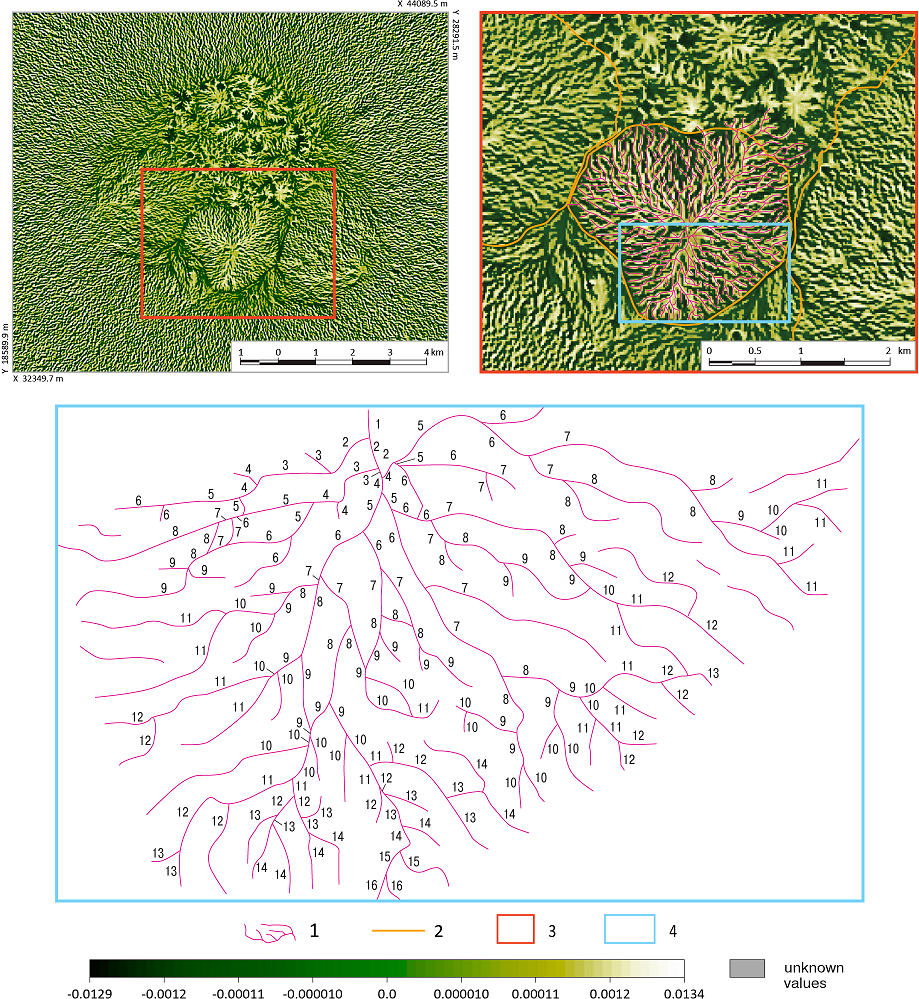
Figure 3. Identification of tree-like structures on the map of kh: the example of the elevated structure “B”. 1 – Indication of tree-like structures by the generalised lines above upper parts of flow divergence zones (kh > 0). 2 – Borders of the elevated structures A, B and C. 3 – Enlarged area. 4 – Example of the hierarchical levels numbering. Each segment from the upper branch to the lower branch (in several cases – convergence) was counted. The smallest order is at the summit of the elevated structure B.
Conclusion and extension
We suggest an in-situ exploration of water traces in the foot slope deposits marked by polygon 11 (Fig. 1). The thickest slope deposits up to 120 m (Fig. 1, polygon 8) are also promising target, however this area is topographically isolated.
The complete research is: Mitusov, A. V., Stark, A., Khrisanov, V. R., Oberst, J. (2023). Hidden morphology of Shackleton Crater, lunar South Pole. Planetary and Space Science, 238, 105795. https://doi.org/10.1016/j.pss.2023.105795
Donations
This research involved a large amount of unpaid time! We will be grateful for any BTC donations to our team: bc1qa33qmar5y97xskh5hfms7lckq7cfel4vtyu7qa
References
- Mitusov, A. V., Stark, A., Khrisanov, V. R., Khrisanova, P. V., Antipov (Dia) D. (2022). Crater Shackleton at the lunar South Pole. YouTube channel "Land and Water CA". https://www.youtube.com/watch?v=gAY0JYlOkK4
- Shary, P. A., Sharaya, L. S., Mitusov, A. V. (2002). Fundamental quantitative methods of land surface analysis. Geoderma, 107(1-2), 1-32.
- Stark, A, Oberst, J, Scholten, F, Gläser, P. (2017). Measurements of Moon's Rotation by Co-Registration of Laser Altimeter Profiles and Stereo Terrain Models. 48th Lunar and Planetary Science Conference, The Woodlands, Texas. https://www.hou.usra.edu/meetings/lpsc2017/eposter/2304.pdf
- Zuber, M. T., Head, J. W., Smith, D. E., Neumann, G. A., Mazarico, E., Torrence, M. H., Aharonson, O., Tye, A. R., Fassett, C. I., Rosenburg, M. A., Melosh, H. J. (2012). Constraints on the volatile distribution within Shackleton crater at the lunar South Pole. Nature, 486(7403), 378-381.
How to cite: Mitusov, A. V., Khrisanov, V. R., and Oberst, J.: Map of major landforms in Shackleton Crater, lunar South Pole, Europlanet Science Congress 2024, Berlin, Germany, 8–13 Sep 2024, EPSC2024-144, https://doi.org/10.5194/epsc2024-144, 2024.
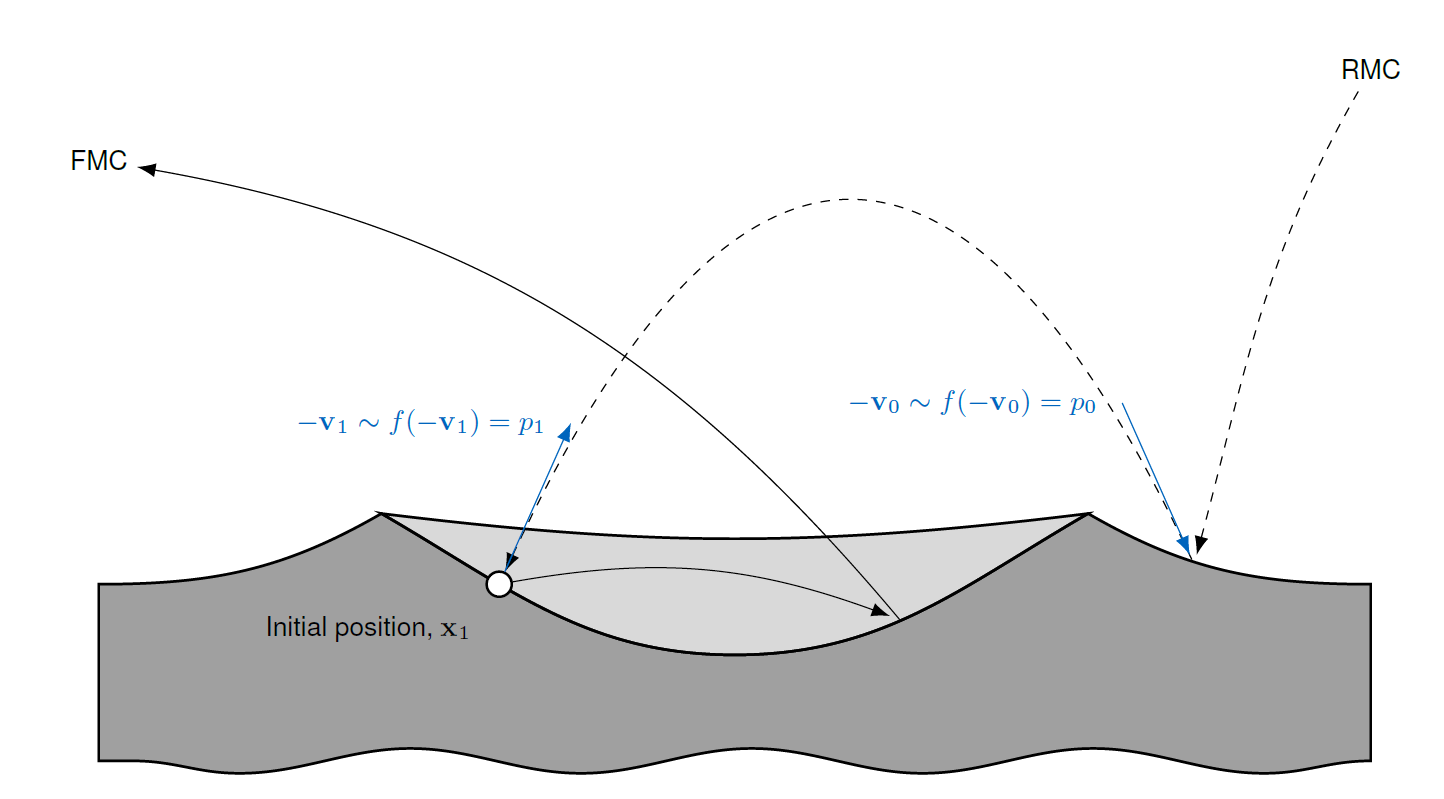
- Crider et al. (2002). Advances in Space Research
- Gratiy et al. (2010). Icarus
- Grava et al. (2014). Icarus
- Hodges et al. (1973). Fourth Lunar Science Conference
- Hurley et al. (2017). Icarus
- Kegerreis (2020). Springer Theses Ser.
- Killen et al. (2019). Icarus
- Schörghofer et al. (2021). Space Science Reviews
- Smolka et al. (2023). Icarus
How to cite: Smolka, A., Saenz Reguero, C., and Reiss, P.: A Reverse Monte Carlo Method to Investigate the Topography Interaction with the Lunar Exosphere, Europlanet Science Congress 2024, Berlin, Germany, 8–13 Sep 2024, EPSC2024-299, https://doi.org/10.5194/epsc2024-299, 2024.
Introduction: The proposed landing and exploration site, Amundsen crater, has been suggested several times [e.g., 1-3]. This is due to its location, size, and diverse geology that records a wide range of the south polar impact history [3-4]. Sunlit regions, regions with high Earth visibility, and the flat crater floor (Figure 1) enhance Amundsen crater’s capability for landing and operations as well as its ability to assess multiple science objectives [5]. This places Amundsen crater as an appealing target for future exploration. To address the local geology and history of the region, we performed 1:100,000 scale mapping of Amundsen crater [3-4]. Following, we identified five potential landing and exploration sites (Figure 1) that satisfy technical criteria, including shallow slopes, sufficient solar illumination, and Earth visibility. These sites also provide sample materials and can contribute to several scientific objectives (Figure 2).
Regional Setting of Amundsen Crater: Amundsen crater, centered at 84.5°S, 85.6°E, is situated in the South Pole-Aitken basin (SPA) near the lunar South Pole. With a diameter of ~100 km, Amundsen crater is the southernmost crater of its size on the Moon and, with its late Nectarian age [3], the youngest south polar complex crater of its size. Amundsen crater is located near the outer rim domain of the SPA basin [5], suggesting that ancient lunar rocks exposed by the SPA impact may have been reworked and redistributed by the Amundsen impact [3]. Therefore, sampling and analyzing the Amundsen crater materials and the younger crater materials that have strongly modified the surface will allow us to explore a wide range of south polar impact history and the processes that have reworked the crater materials over time.
Areas of Interest (AoI): The Artemis program selected two candidate sites in the Amundsen region, "Nobile Rim 2" (AoI a) and "Amundsen Rim" (AoI b), while the Chinese ILRS potentially targets the Amundsen crater floor (AoI c, [1]). Additionally, we examined two AoIs, that fulfill scientific objectives beyond the aforementioned sites, on the plains near Idel'son L crater (AoI d) and the Rubin crater region on the Amundsen rim (AoI e). Based on traversability constraints, we present an assessment of their ability to address key science objectives.
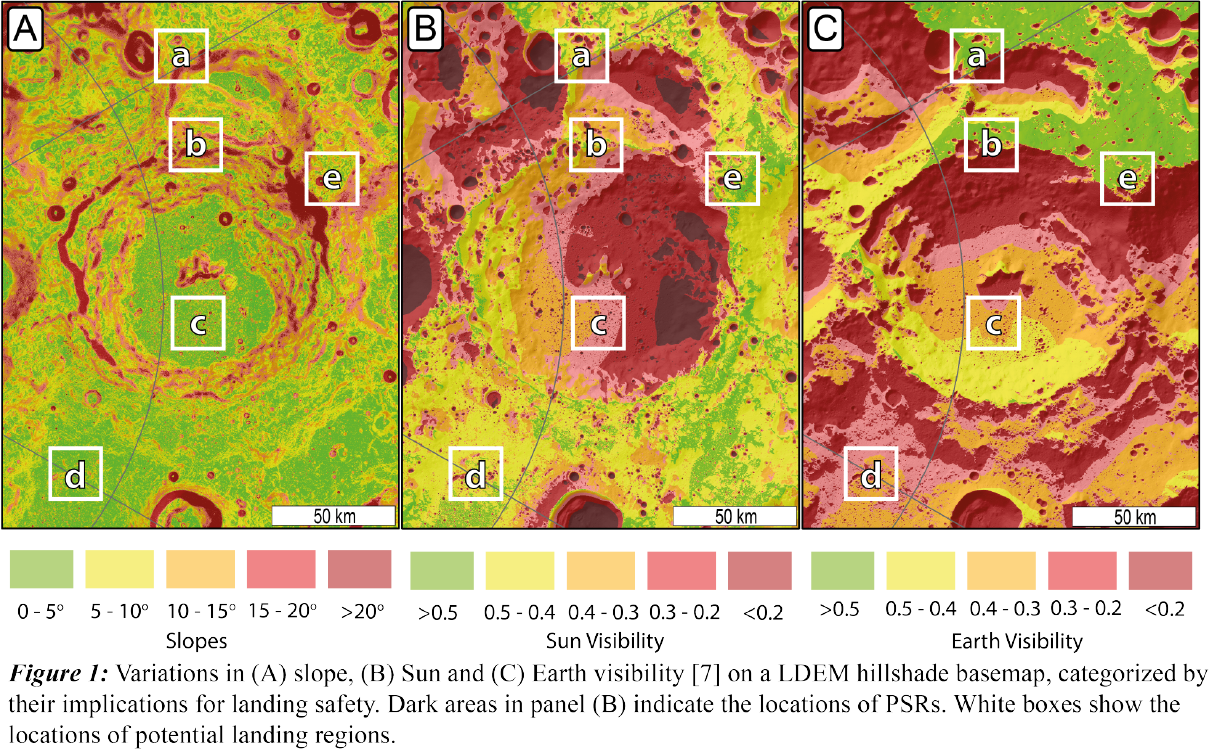
AoI a Artemis Nobile Rim 2: The Artemis candidate site “Nobile Rim 2” is located in the intercrater highland [3-4]. Most of the region has slopes of less than 5°, low surface roughness, and adequate Sun and Earth visibility (Figure 2). The region is dominated by Eratosthenian crater materials [3], where a km2-sized permanently shadowed region (PSR) are present. Furthermore, the region offers the opportunity to sample undifferentiated pre-Nectarian basin material, potentially containing Nobile ejecta and SPA-derived material redistributed via younger craters.
AoI b Artemis Amundsen Rim: Landing on the Amundsen rim benefits from advantageous Sun and Earth visibility. Shallow slopes exist, but are limited to the flat-topped rim segment, which is surrounded by steep slopes. Consequently, traversability is limited to the flat rim segment, where temperatures vary from 130 K in winter to 240 K in lunar summer [6]. The exploration site is located at the intersection of multiple craters and is capable of sampling materials excavated from depth by the Amundsen impact [3].
AoI c Amundsen Crater Floor: The Amundsen crater floor has been previously proposed as an exploration site [1-2]. Extensive areas with shallow slopes facilitate access to the floor, including the large PSR, and promote traversability and mobility. Sun and Earth visibility [7] allow for solar power generation and direct communication with Earth in a favorable temperature regime [6]. The central peak represents the deepest derived materials that can be sampled, while materials on the crater floor can be studied to determine their nature and origin. This will offer valuable insights into the origin, distribution, and thickness of plains found elsewhere. The Amundsen crater floor provides one of the largest and coldest PSRs at the South Pole, where potential CO2 ice can be sampled [8].
AoI d Plains near Idel’son L Crater: This site exemplifies the most diverse geology and offers favorable landing conditions (Figure 2). Investigating the terra-mantling unit [3] at this site will help to address the nature and timing of a potential resurfacing event [3]. In addition, volatile studies can be conducted in the PSRs.
AoI e Rubin Crater Region: The northern rim of Amundsen crater, where Rubin crater is located, benefits from favorable landing conditions with a wide range of scientific objectives (Figure 2). The selected region is primarily characterized by its location on a massif that is considered to be the SPA rim [3]. The candidate site is covered by Amundsen ejecta, but features younger craters such as the Eratosthenian Rubin crater [3]. The Rubin crater is of particular interest as it may have reached the underlying massif and excavated SPA-derived material.
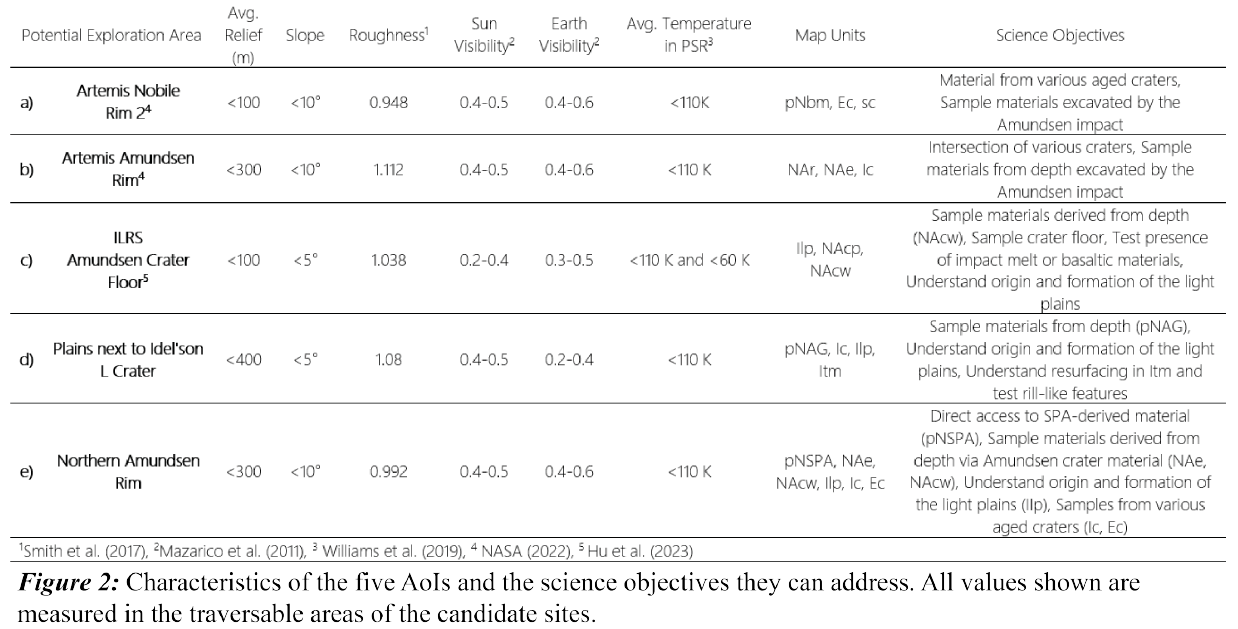
Conclusion and Outlook: Based on our map, we have identified five AoIs that meet landing safety requirements and are capable of addressing key science objectives. We are not prioritizing one AoI over another, as the final selection will depend heavily on the design, scope, and duration of a mission. As a continuation of this study, we are producing higher resolution geological maps for each AoI to further refine site selection for different types of landed missions, setting the stage for maximum scientific return from the Amundsen crater region.
References: [1] Hu et al. (2023) P&SS 227. [2] Lemelin et al. (2014) P&SS 101. [3] Wueller et al. (2024) PSJ, accepted. [4] Wueller et al. (2024) LPSC 55, Abstract#1015. [5] Artemis SDT report. (2020). [6] Williams et al. (2019) JGR 124. [7] Mazarico et al. (2011) Icarus 211. [8] Schorghofer et al. (2021) PSJ 1.
How to cite: Wueller, L., Iqbal, W., Frueh, T., van der Bogert, C. H., and Hiesinger, H.: Comparison of Landing Conditions and Science Potential of Candidate Landing Sites at Amundsen Crater near the Lunar South Pole, Europlanet Science Congress 2024, Berlin, Germany, 8–13 Sep 2024, EPSC2024-473, https://doi.org/10.5194/epsc2024-473, 2024.
The methodology of this work consists the following sequence of steps: understanding the general topographic radial profile of ejecta plus bedrock uplift around differently sized moderately fresh craters, definition of mathematical formula to model the observed crater ejecta topography, subtraction the supposed tectonic uplift near to the rim of the crater to separate the ejecta, and definition of the sequence of ejecta layers. Two types of lunar datasets contributed to identify craters: for small size range (diameter < 2 km) LOLA Digital Elevation model with spatial resolution of 60 m/px were used to mark their appropriate shape, for large craters WAC Digital Elevation Model with spatial resolution of 100 m/px was evaluated. For the identification of the sequential order of layers (vertical stratigraphy), dating of the source crater is needed. However here a simpler approach has been applied: larger craters were assumed to be older and provide ejecta deeper in a given sequence, while smaller craters than those considered provide ejecta to very small areas of the total landing region.
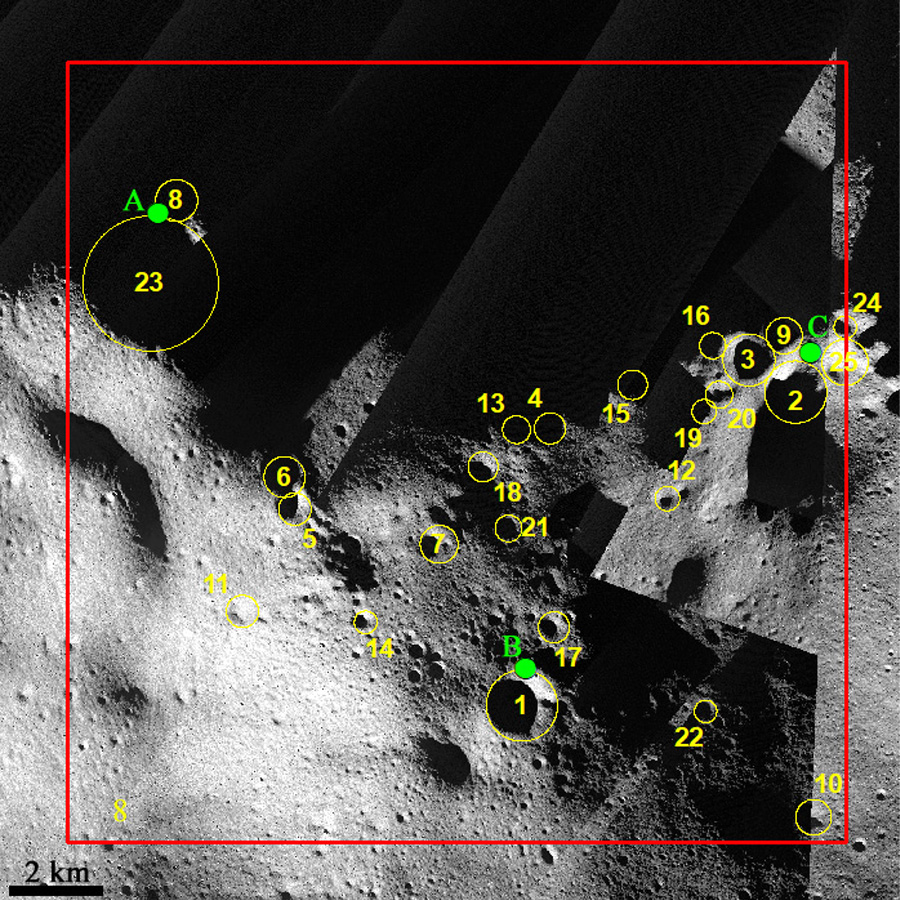
Figure 1. Optical view of the selected 25 craters and the place of the three stratigraphic points A, B, C) marked in an LRO Narrow Angle Camera Mosaic.
The modelled craters are marked in Figure 1. The calculated ejecta thickness plus stratigraphy using 25 local craters with diameters above 0.45 km were evaluated.
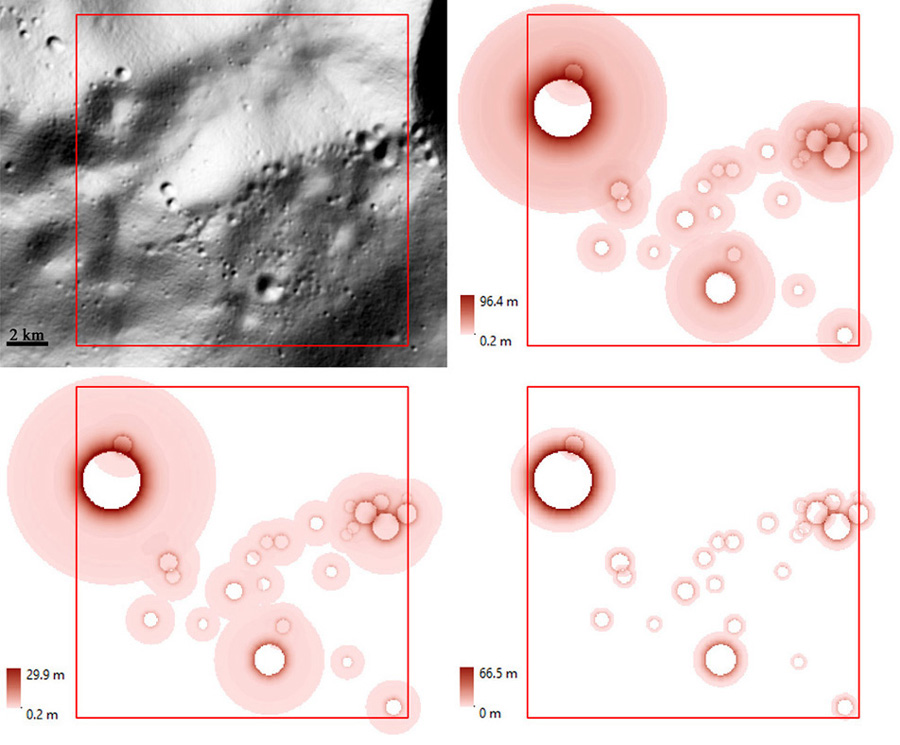
Figure 2. Topography from LOLA Digital elevation model (A), modelled ejecta thickness with basement uplift (B), ejecta without uplift (C) and only uplift (D) of the selected 25 craters.
Considering the uplift plus ejecta together, the maximal modelled surface elevation increase is 96.4 m at the rim of ID8 and ID23 craters (Figure 2B). Separately evaluating the bedrock uplift and ejecta components, in Figure 2D it can be seen that the uplift influenced only close to the elevated rim in all cases, in agreement with the dominant topography there. Considering the ejecta only in Figure 2C, it can be seen that the maximal thickness is close to the rim, without the uplift - and the ejecta covers a much larger area than the uplift. These estimations show that the crater ID23 has the highest ejecta thickness values: with the structural uplift is 80.2 m and without the structural uplift is 24.2 m at the rim. The diameter of this crater is 2.78 km and the maximum distance where its ejecta was considered (above roughly 1 cm thickness) is 4.98 km.
Summarizing the general numerical aspects of the results, 64 % of the target 256 km2 area was covered by any of the surveyed crater’s ejecta above about 1 cm minimal thickness. The largest areal coverage by a single crater was provided by the largest carter as expected, what was the ID23 (2.78 km diameter) with 28% areal coverage (72 km2).
Figure 3. Ejecta stratigraphy of three sample points (see their locations in Figure 1). The numbers indicated on or next to the vertical columns mark the identification number of the given crater.
Evaluating the ejecta superposition of the 25 craters, maximal up to 7 layers covered each other at the same location, making up a vertical strata of 10.9 m total thickness. Stratigraphic sequence of different ejecta layers was estimated using the simple approach: smaller craters are probably younger thus the sequence of ejecta order was defined to suppose the ejecta from the largest craters at the bottom (oldest event), and smaller craters (being younger) are located above those of larger ones. To demonstrate the possible expected sequence of layering three typical locations were analysed: the A, B, and C locations in Figure 1, where the vertical sequence of layers are presented in FIgure 3. The height of the three columns (along the vertical axis) marks the vertical thickness of the deposited ejecta from all considered craters.
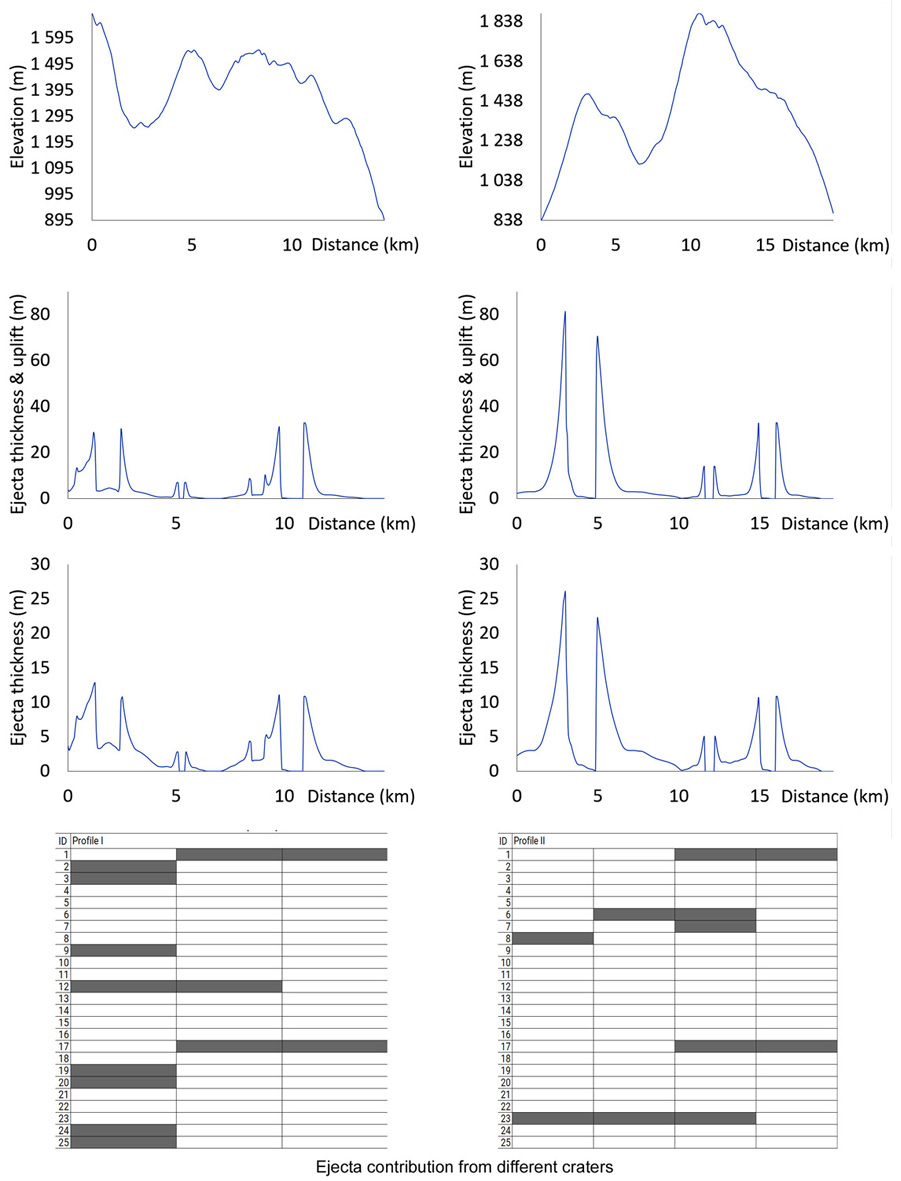
Figure 4. Ejecta related changes along two profiles regarding the topography from LOLA Digital elevation model (A1, B1 panels), ejecta thickness plus structural basement uplift (A2, B2 panels), and only the ejecta thickness along I. and II. profiles (A3, B3) indicated inFigure 2. The source craters of the ejecta within 5 km wide sections along the I. and II. profiles (A4, B4 panels) also can be seen below.
For further visualization of ejecta distribution, the change along two profiles (that crossed the A, B and C locations) are presented in Figure 4. The bedrock including profiles show larger thickness values, while the most dominant feature in both the second and third lines are the double peaks which mark the crossing of craters’ rims. These are the most elevated peaks both by the bedrock uplift (Figure 4 A2, B2) and also because the thickest ejecta layer formed closest to the rim (Figure 4 A3, B3).
References
(1) Takano et al. 2020. Experimental study on thermal properties of high porosity particles for understanding physical properties of Phobos surface. In: JpGU-AGU Joint Meeting, PPS08-P01.
(2) Kobayashi et al. 2023. Laboratory measurements show temperature-dependent permittivity of lunar regolith simulants. Earth Planets and Space 75:1, 8.
(3) Moriarty and Petro 2024. Journal of Geophysical Research: Planets, Volume 129, Issue 4, article id. e2023JE008266.
(4) Heather et al. 2024. The ESA PROSPECT Payload for CP22: Science Activities and Operations Planning. 55th LPSC, No. 3040, id.1085
How to cite: Tomka, R. K. and Kereszturi, Á.: GIS methods based ejecta layer estimation for the Moon to support research and ISRU activities, Europlanet Science Congress 2024, Berlin, Germany, 8–13 Sep 2024, EPSC2024-554, https://doi.org/10.5194/epsc2024-554, 2024.
The lunar south pole is a region of focused scientific and exploration interest, with several crewed and robotic missions to this region planned within the next decade. Understanding the mineralogy of the region is essential to inform landing site characterization and selection and provides key context for interpreting samples and in situ observations.
The Artemis exploration zone (areas poleward of 84° latitude) is also relevant to geological investigations providing new insight into fundamental planetary processes. Specifically, Artemis Science Objective 1 from the Artemis III Science Definition Team Report is to understand a wide range of planetary processes including formation and differentiation of the Moon into a core, mantle, and crust, in addition to subsequent processes such as volcanism, tectonism, impacts, and regolith development. Artemis astronauts will address these objectives in several ways, guided by compositional remote sensing analyses of the region. Here, we present local mineralogical and compositional analyses of candidate high-priority science targets drawing upon several remote sensing datasets including Moon Mineralogy Mapper data.
Moon Mineralogy Mapper (M3) data provide the highest spatial - and spectral-resolution mineralogical data for the lunar surface and are therefore ideally suited for characterizing compositional diversity at ~100 m spatial scale. Mineralogical diversity across the lunar surface is dominated by variations in the abundance and composition of a handful of common lunar minerals and oxides, including plagioclase, pyroxene, olivine, spinel, and ilmenite. This diversity is reflected in overall albedo and differing strengths and relative positions of spectral absorption bands at 1 and 2 μm.
M3 achieved near-complete coverage of the south polar region. Due to the pole-crossing orbit of Chandraayan-1, areas close to the pole were imaged numerous times across the lifetime of the M3 mission, with different lighting conditions and orbital altitudes. This is helpful, as lighting conditions at high latitudes involve extreme solar incident angles and large shadows, affecting data quality (signal-to-noise ratio) and availability. The number of M3 observations available for each candidate Artemis III region is given in Table 1. In this work, we examine the character and mineralogical diversity reflected full-resolution M3 data for the candidate Artemis III landing regions.
Fig. 1: M3 1 μm Integrated Band Depth across the Artemis Exploration Zone. Areas lacking well-illuminated M3 pixels (in global mosaics) are shaded light grey. Note: these areas may be illuminated in individual M3 images.
How to cite: Moriarty, D. and Petro, N.: High-Priority Mafic Mineral-Bearing Science Targets at the Artemis III Candidate Landing Regions, Europlanet Science Congress 2024, Berlin, Germany, 8–13 Sep 2024, EPSC2024-568, https://doi.org/10.5194/epsc2024-568, 2024.
Introduction: Synthetic Aperture Radar (SAR) is a powerful tool for the remote sensing of planetary surfaces. It allows for high resolution imaging of the surface at different wavelength ranges (or ‘bands’), each providing different information. The European Space Agency has an open-source toolbox named SNAP for the exploration of Earth Observation data. However, there is no equivalent open-source toolbox for non-terrestrial datasets. This project aims to begin the development of an open-source toolbox created for planetary missions, with an initial focus on the development of radiometric correction module for SAR data acquisitions from the ISRO’s Lunar, Chandrayaan-2 mission.
Chandrayaan-2: Launched by the ISRO in 2019, Chandrayaan-2 is the first fully-polarimetric SAR to study the Moon. This allows for the gathering of detailed information on the properties of surficial elements such as the structure or the orientation. The Dual Frequency Synthetic Aperture Radar (DFSAR) onboard the satellite will image in both S- and L-Band frequencies, the latter allowing for shallow ~3m penetration into the Lunar surface [1]. This mission's main scientific goals are to create high-resolution maps of the polar regions, estimate the distribution and thickness of the regolith and to make a quantitative estimation of water-ice in the polar regions of the Moon.
The Lunar South Pole: A heavily cratered region of great interest due to the suspected presence of water-ice in the permanently shadowed regions (PSRs.) It is also the location of candidate landing regions for NASA’s Artemis III mission. Evidence for the presence of subsurface water-ice has been provisionally interpreted from anomalies in UV and VIR albedo, and high Circular Polarisation Ratio (CPR) in remotely sensed data [2]. The initial data return of Chandrayaan-2 has indicated that craters in both PSRs and non-PSRs have anomalous CPR values in both the S band and L band [1]. These results align with what has been observed for Greenland’s ice sheets [3] and the Galilean satellites [4].
Processing: The module aims to be a complete end-to-end, user-friendly Python catalogue for the processing of Level 1 SAR data products. This term encompasses both Single Look Complex (SLC) and Ground Range Detected (GRD) images. It encompasses the calculation of several backscatter coefficients – Beta0, Sigma0 and Gamma0 – as well as the ability to reintroduce the Noise Equivalent Sigma Naught (NES0) back into the image, and to correct for the terrain variations. A simple function to show each polarisation side-by-side is available. Current work is being done on a function that will allow a colourised overlay of HH, HV and VV polarisations to be displayed. Fig.1 shows a small section of the surface for four separate polarisations with gamma0 backscatter. Additional modules for the toolbox are planned to be in development.
When completed, the toolbox will contain radiometric correction tools for both SLC and GRD images, StereoSAR tools and radarclinometry tools to work with Chandrayaan-2 data.
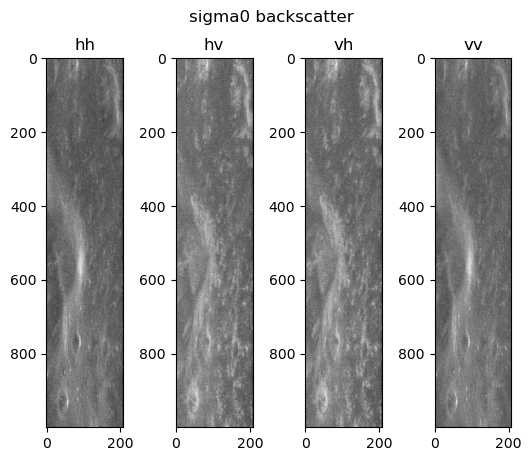
Fig. 1: A plot of four types of polarised radar backscatter of a small region of the Lunar South Pole, with a Gamma0 backscatter.
References:
[1] S. S. Bhiravarasu et al. (2021) Chandrayaan-2 Dual-frequency Synthetic Aperture Radar (DFSAR): Performance Characterization and Initial Results. Planet. Sci. J. 2 134
[2] J. Flahaut et al. (2019) Regions of Interest (ROI) for Future Exploration Missions to the Lunar South Pole. Planetary and Space Science, 180.
[3] E. Rignot (1995) Backscatter Model for the Unusual Radar Properties of the Greenland Ice Sheet. J Geophysical Res. 100 E5.
[4] G.J. Black et al. (2001) Icy Galilean Satellites: Modelling Radar Reflectives as a Coherent Backscatter Effect. Icarus. 151 2. P167-180.
How to cite: McVann, P., Ghail, R., Mason, P., and Manning, C.: The Creation of a Radiometric Correction Module in Python for Chandrayaan-2, Europlanet Science Congress 2024, Berlin, Germany, 8–13 Sep 2024, EPSC2024-622, https://doi.org/10.5194/epsc2024-622, 2024.
We report on the outcomes of several years of study focused on the understanding of the nature and evolution of regolith on airless surfaces, particularly on the Moon, with the unique approach of using lunar rocks as probe of surface processes. Orbital and in situ imaging of the Moon reveal rocks and boulders scattered across the surface. These rocks preserve the chemistry, mineralogy and petrology of the lunar crust and its evolution. Upon exposure to the surface, they are affected by surface processes and thus inform on regolith formation and evolution [e.g., Hörz et al., 2020]. Furthermore, boulders influence processes such as dust lofting and migration, and surface thermal emission. Here we present an overview of our results. We summarize our findings follow the chronological sequence of events during the residence period of rocks on the surface.
We focused our studies on the most frequent context of lunar rocks: the ejecta of impact craters. We studied the photometry of boulder fields around impact craters with modeling and observations and found differences likely associated to the down and up range of the crater impact angle [Marshal et al., 2023]. Variation in petrology has a minor effect on surface microscale roughness and thus on photometry [Marshal et al., 2024], suggesting that the observed difference of boulder fields at lunar craters might be due to the impact-related effect during rock fracturing and excavation. A second unexpected photometric anomaly was found on single instances of ejecta lunar rocks and likely related a soil mantling on top of rocks of peculiar properties [Rüsch et al., 2024a]. These results suggest that the outer surface of lunar rocks is subject to a still unclear set of processes. We found evidence for one of such processes during our laboratory experiment on thermal vacuum cycling on meteorite samples [Patzek et al., 2024]. Upon temperature excursions similar to those experienced on the Moon, we observed formation and detachment of micro-flakes on a lunar meteorite, implying that diurnal temperature variation affect superficially lunar rocks. This could in turn influence the rock photometric response. This phenomenon is likely related to rocks of glass and plagioclase-rich petrologies, such as lunar and impact (melt) breccias [Patzek and Rüsch, 2022]. The newly found micro-flaking, together with micrometeorite abrasion and dust deposition [Rüsch and Wöhler, 2024] occur until rock catastrophic shattering. This shattering event take place once the rock has accumulated sufficient internal damage by repeated meteoroid bombardment. We calculated this lifetime, as a function of the rock size, using meteoroid size-frequency distributions and size-dependent specific shattering functions [Rüsch et al., 2022]. These new lifetime estimates quantitatively describe i) the change in shape of a rock size-frequency distribution with time and ii) the decrease in rock abundance (aerial fraction covered by rocks) around craters with time (Figure 1). The outcomes of rock impact shattering and the produced fragments are clearly visible in orbital imagery around the lunar globe [Rüsch and Bickel, 2023]. We modeled the fate of these fragments produced by impact shattering in order to account for multiple generation of rock fragmentation. This allowed to estimate rock abundances down to the centimeter scale and to estimate the specific shattering energy of lunar boulders. Rock abundances and size-frequency distributions around craters of known radiometric age can be entirely described by modeling shattering by meteoroid bombardment, implying that even if thermal stresses likely modify boulder interior properties, the resulting effect on boulder lifetime is negligible relative to the role of meteoroids bombardment. The current work is threefold: it consists in i) applying the understanding of these processes to an analysis at the quasi-global scale of lunar surface boulders with deep learning algorithms [Aussel et al., 2024], ii) study the underlying processes involving in human image inspection and mapping (including ambiguous rock identification) to underpin, enhance and appropriately use deep learning [Rüsch et al., 2024b], and iii) understand the effect of impact (shock and impact melt) on the microscale roughness of rock samples.
Figure 1. The evolution of lunar boulders. (left) Instances of boulders in crater ejecta at different evolutionary stages, from Rüsch and Bickel (2023). (right) Modeled decrease of rock abundance in a crater ejecta for all rocks above 1 m (solid line) and corresponding formation of new regolith soil (particles <1 cm) (dashed line), using the model of Rüsch et al. (2022). Ejecta radius is 1.5 crater radius. Crater radius is 0.5 km.
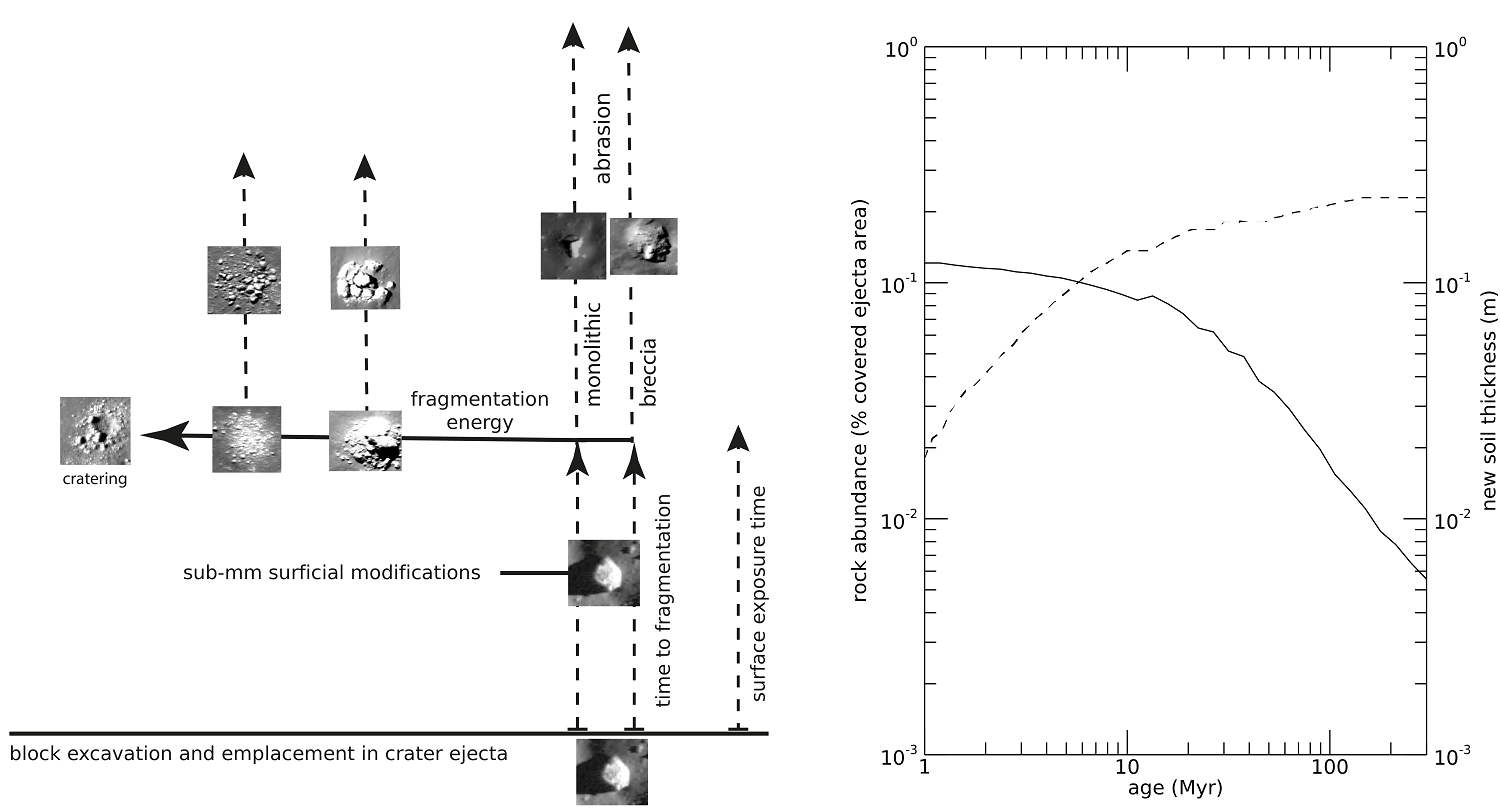
How to cite: Rüsch, O., Marshal, R. M., Patzek, M., and Aussel, B.: Understanding lunar regolith formation through the evolution of boulders, Europlanet Science Congress 2024, Berlin, Germany, 8–13 Sep 2024, EPSC2024-717, https://doi.org/10.5194/epsc2024-717, 2024.
The future space missions dedicated to the Moon stimulate the renewal of lunar reference system definitions and characterizations. At present, two slightly different reference systems are commonly used to define the lunar body-fixed coordinate system: the Mean Earth/Rotation Axis (or polar axis) (ME) reference system and the principal axis (PA) reference frame.
The former has been used at the beginning of lunar observation and it is commonly adopted for archiving and data distribution proposes of lunar surface or topography. The latter corresponds to the orientation where the lunar tensor of inertia is diagonal that is a natural reference system to model and to integrate the equations of motion. It is directly determined from lunar laser ranging measurements. The transformation between the two reference systems (PA, ME) is realised by three static rotations that depends on the lunar gravity field coefficients and dissipative models. Consequently, this transformation is dependent to a lunar ephemeris.
In preparation of future lunar missions, we present a review on actual lunar coordinate systems and present a new determination based on the Integration Numérique de l’Observatoire de Paris lunar ephemerides (INPOP) with a determination of a lunar time scale. In addition, we present the expected accuracy and discussed the differences with other lunar coordinate frame realisation. Finally, we provide recommendations for future lunar coordinate system.
How to cite: Rambaux, N., Fienga, A., Kaitheri, A., Gastineau, M., Baguet, D., and Laskar, J.: On the Lunar reference systems , Europlanet Science Congress 2024, Berlin, Germany, 8–13 Sep 2024, EPSC2024-760, https://doi.org/10.5194/epsc2024-760, 2024.
Gravitational waves from astrophysical sources interact with elastic bodies and their interaction can be presented in terms of the normal mode excitations. In this regards, the GWs are described as forces driving these oscillations. In the community, two theories emerged on how the GW metric perturbation couples with the elastic body. One theory relates to Dyson’s paper (Dyson, 1969), where the GW force is coupled with the elastic body through the gradient of the shear modulus. The second one is related to Weber’s paper (Weber, 1960), where the GW is coupled with the elastic body through a Newtonian tidal forcing. Here, we present analytical displacement solutions to both of these theories by using the Green tensor formalism, where the induced displacement is calculated as a double integral of the convolution between the impulse response of the elastic body and the GW force term. Eventually, we examine what are the key ingredients to obtain the GW response of the Moon. It has been shown that Moon is extremely seismically quiet with an upper limit on the background noise that is lower than the Earth one by at least 3 orders of magnitude. This is one of the main driving reasons why the Moon is considered as a unique environment for a gravitational astronomy. Therefore, to conduct our study, we introduce several approximations: firstly, GWs are monochromatic waves defined by a scalar metric value, a polarization tensor and a propagating vector; secondly, we consider non-rotating anelastic Moon; thirdly, the derivation is obtained in the Moon’s reference system. We study, what are the main differences of the induced responses from the two theories, and what are the levels of the excitation amplitudes for a published lunar model. Next, we also scrutinise how the estimated excitation amplitude depends on the regolith structure by altering the initial lunar model and using different regolith models. We discuss what are the prospect of detecting these signals with future GW detectors build on the Moon.
Dyson, F. J. (1969). Seismic response of the earth to a gravitational wave in the 1-Hz band. Astrophysical Journal, vol. 156, p. 529, 156, 529.
Weber, J. (1960). Detection and generation of gravitational waves. Physical Review, 117(1), 306.
How to cite: Majstorović, J., Vidal, L., and Lognonné, P.: Amplitude estimation of the Moon’s spheroidal excitation induced by a gravitational wave, Europlanet Science Congress 2024, Berlin, Germany, 8–13 Sep 2024, EPSC2024-811, https://doi.org/10.5194/epsc2024-811, 2024.
Introduction: With the return of mankind to the Moon in the frame of NASA's Artemis program comes the need for detailed analyses of ambient conditions and resources like e.g. water ice in possible landing regions. There are several hints to water ice deposits within permanently shadowed regions (PSRs) in the Moon's south pole area. Some of these regions might have sufficiently low temperatures to allow the presence of water ice over geological timescales [1-4] . In fact, the LCROSS experiment showed the presence of water ice within at least one of these PSR's [5].
Intuitive Machines' first mission (IM-1) recently landed successfully in Malapert crater 300 km from the south pole. Its follow-up mission IM-2 is planned to land on the Shackleton-de Gerlache connecting ridge close to the south pole in late 2024. There, IM-2's main lander Nova-C will deploy the NASA-funded Polar Resources Ice-Mining Experiment-1 (PRIME-1) - consisting of a drill and a mass spectrometer - to search for ice deposits below the surface. [6, 7]. Nova-C will also carry a smaller vehicle, the Micro-Nova hopper, which will perform a series of short flights across the surface and land in a PSR. The hopper's payload consists of a set of cameras, a neutron spectrometer (PLWS), and the Lunar RADiometer (LRAD).
The LRAD Instrument: The Lunar Radiometer's purpose is to measure the surface brightness temperature inside a PSR, thus providing ground truth for thermophysical models of the south polar region. Specifically, LRAD measures the radiative flux in the thermal infrared range [8, 9, 10]. To that end it houses six thermopile sensors, equipped with individual IR-filters to fulfill specific scientific measurement goals. These are:
-
Determination of surface brightness temperature in the illuminated and shadowed terrain.
-
Determination of the mm to cm-scale surface roughness.
- Determination of surface thermal inertia.
The thermopile sensors are situated inside the sensor head having a radiation shield, reflective coating and heaters for temperature control. To decouple the sensor head thermally from the rest of the hopper, the head is attached to the hopper using PEEK brackets. (Fig. 1) A low-thermal conductivity flex harness connects the sensor head to the avionics box.
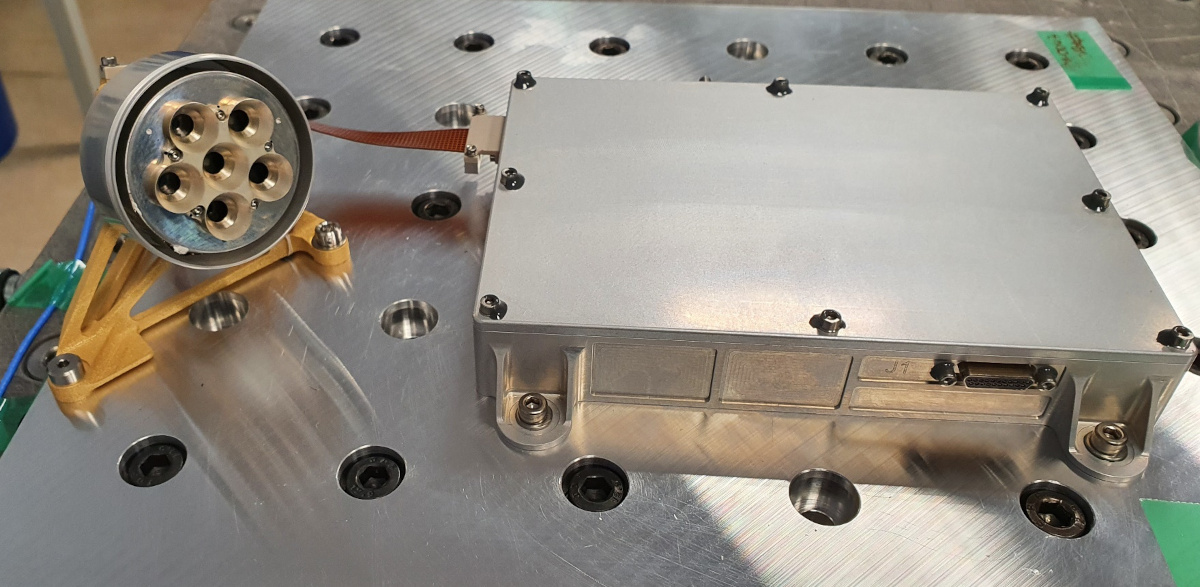
Figure 1: LRAD's components during a vibration test. Left: Sensor head and PEEK mounting brackets. Right: Avionics box. Sensor head and avionics box are connected via a low-thermal conductivity flex harness. (© DLR (CC BY-NC-ND 3.0))
Calibration: We describe the relation between target temperature T and the signal voltage U by a form of the Sakuma-Hattori interpolation equation
U = R * exp(- c2 /(A*T+B)) - R * exp(- c2 /(A*TS +B)) + SH*PH + Uoff
where c2 is the second radiation constant while R, A, B, SH and Uoff are adjustable parameters. PH is the heating power used to stabilize the sensor head at the chosen setpoint, and the factor SH corrects for the instrument background radiation slightly varying with PH.
LRAD underwent radiometric calibration in a small vacuum chamber equipped with a He-cooled cold head (Fig. 3 and 4). The sensor head was placed inside a temperature-controlled aluminum box representing the thermal environment while viewing a blackbody mounted to the cold head. By varying the blackbody temperature from 70-330 K and the box temperature between 200 K and 280 K the five calibration coefficients could be fitted for each thermopile channel. The estimated uncertainty of the brightness temperature measurement (using the longpass filters), including systematic disturbances, is 10 K for a target temperature of 80 K and 5 K for a target temperature of 100 K.
Figure 2: Brightness temperatures inverted during calibration and deviation from blackbody temperature.
Summary: As part of Intuitive Machines' second mission IM-2, LRAD will measure the brightness temperature of regolith near the lunar south pole, thus performing the first in-situ temperature measurements within a PSR. Here we report on the calibration of the instrument.
Acknowledgements: LRAD is supported by the German Federal Ministry for Economic Affairs and Climate Action on the basis of a decision by the German Bundestag. Grant: 50OW2103
References:
[1] Feldman, W.C., et al. (1998) Science, 281, 5382, 1496-1500
[2] Hayne, P.O., et al. (2015) Icarus, 255, 58-69
[3] Rubanenko, L. et al., (2019) Nat. Geosci,12, 597-601
[4] Hayne, P. O., et al. (2021). Nat. Astr., 5, 169
[5] Colaprete, A., et al. (2010) Science, 330, 6003, 463-468
[6] Atwell, M., et al., (2020). Lunar Surface Science Workshop 2020, 6011
[7] Voosen, P., et al., (2021). Science, 373, 6560, 1188-1192
[8] Spohn, T., et al. (2007). Space Sci. Rev., 128, 339
[9] Grott, M., et al., (2017). Space Sci Rev., 208, 413
[10] Spohn, T., et al. (2018). Space Sci. Rev., 214, 96.
How to cite: Knollenberg, J., Ziese, R., Hamm, M., Grott, M., Robinson, M. S., Mabe, K., Pacher, T., Martin, T., and Rauer, H.: Calibration Of The Lunar Radiometer (LRAD) For Intuitive Machine’s Micro-Nova Hopper., Europlanet Science Congress 2024, Berlin, Germany, 8–13 Sep 2024, EPSC2024-837, https://doi.org/10.5194/epsc2024-837, 2024.
Introduction: Determining the age of a planet's surface can not only help distinguish the sequence of geological events and reveal clues of the planet's evolution, but can also support the selection of lunar exploration sites. Therefore, the determination of the lunar surface ages is very important for characterizing different geological units and investigating the geological history of the landing sites. At present, the widely used method for lunar surface dating is the measurement and fitting of crater size-frequency distributions (CSFD) [1]. One major challenge for this method is to avoid and/or remove of secondary craters that would yield incorrect ages if included in the CSFD. Secondary craters are typically identified based on their irregular morphology and shape compared to primary craters. However, there are some limitations in this method, because remote field secondary craters may have morphologies very similar to primary craters. Therefore, we developed a method to identify secondary craters on mare surfaces based on a contrast between the iron content of the surface inside and outside the crater.
Approach: The lunar regolith has unique mineralogical compositions and contains large quantities of nanoscale elemental iron due to space weathering [2]. In the study of data from Clementine and Apollo lunar highlands and mare, Ye et al. [3] found that the concentration of FeO inside craters was much lower than in their surroundings.
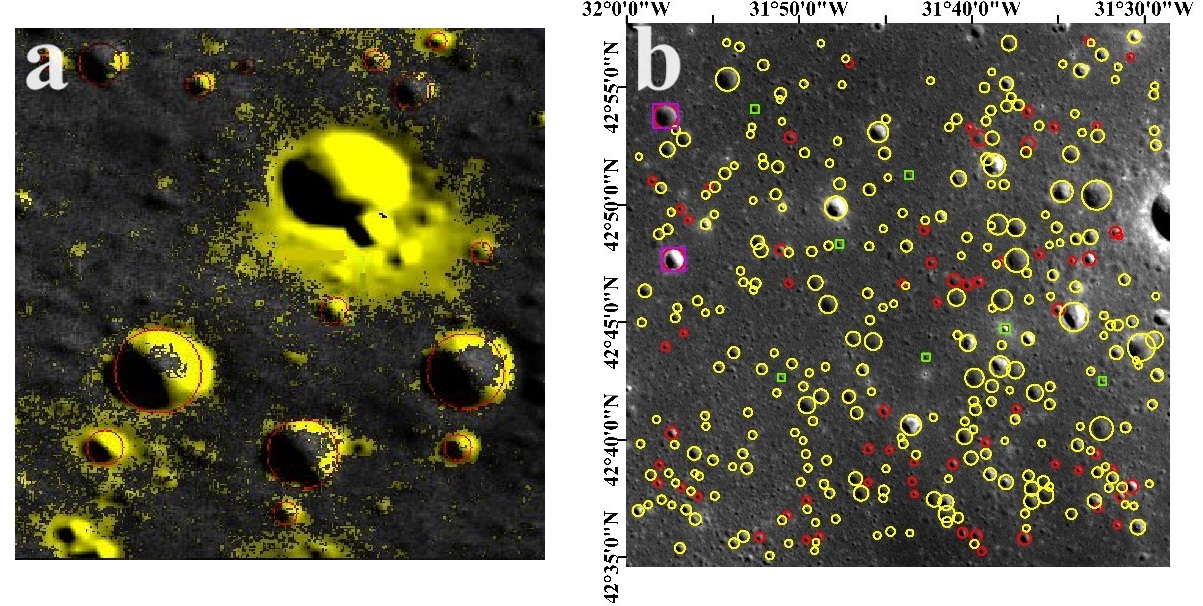
Figure 1. Distribution of iron in and around craters and identification of secondary craters. (a) Effect picture of error elimination (N39°-40° E323°-324°, the lower iron regions are shown in yellow, whereas higher iron areas are shown in gray). (b) Test Results and details for the Sinus Iridum area (yellow: primary craters; red: secondary craters; green: isolated secondary craters; purple: secondary craters with diameters larger than 400 m).
Because the depth/diameter ratio for primary craters is 0.12 and 0.06 for secondary craters [4], we infer that the iron content for secondary craters is more similar to that in the lunar surface soil than for primary craters. Hence, we first determine the mean FeO abundance within a given crater and then the mean FeO abunddance of the lunar soil outside the crater. The difference between these two abundances is calculated and a threshold value is obtained through comparative analysis to identify secondary craters. After the secondary craters are eliminated, the remaining craters are used to date lunar surface unit. We then compare our new results with known ages [5] to iteratively adjust the threshold and improve the method. However, possible sources of uncertainty in our method include potential compositional layering in the regolith. Ongoing work will examine this and other potential effects on our approach.
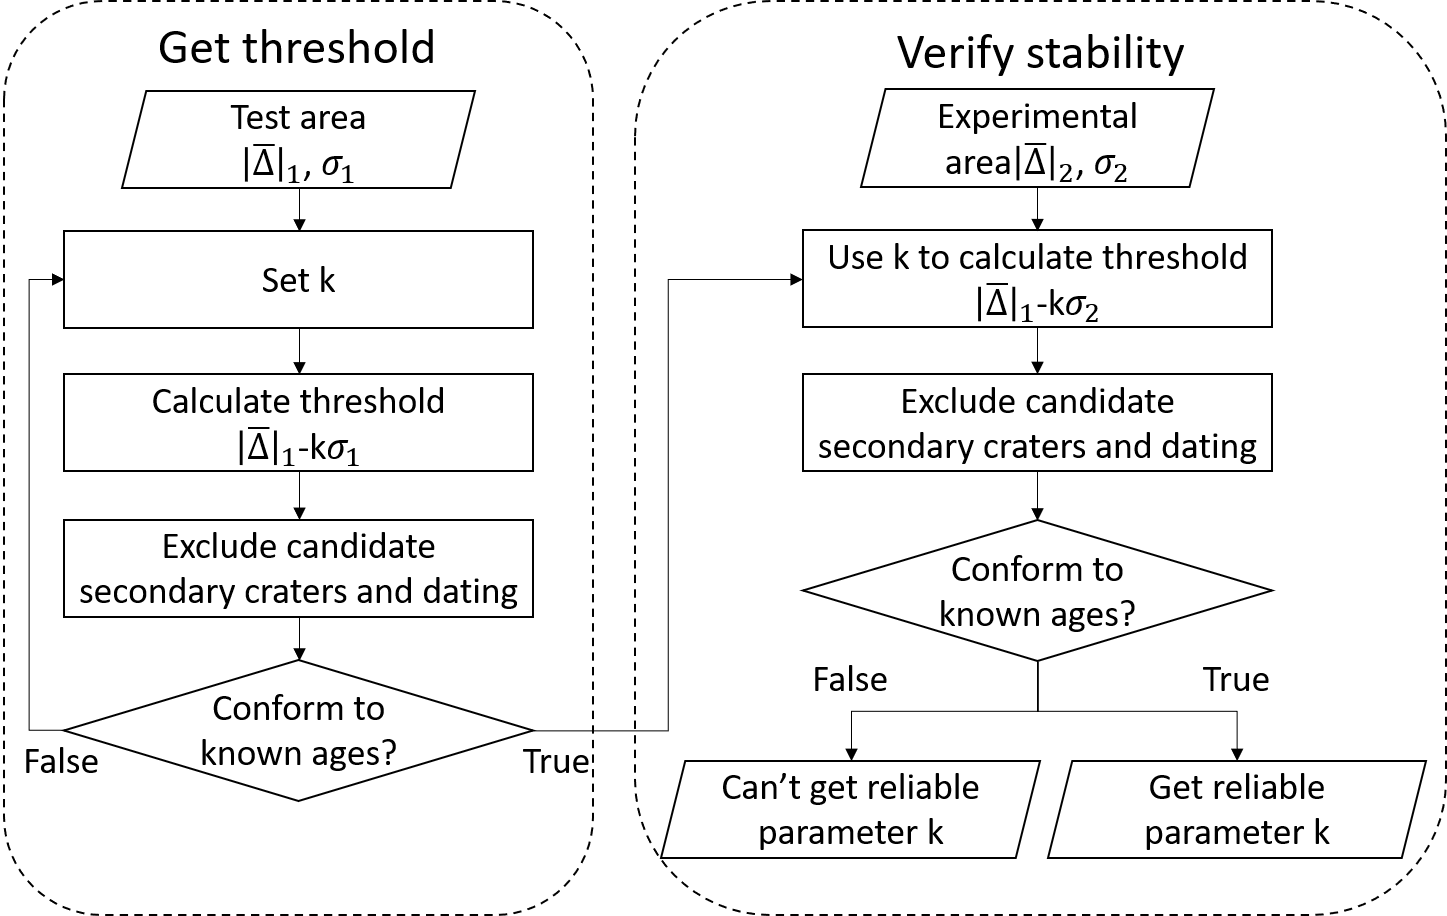
Figure 2. Flowchart for the determination of the recognition threshold for secondary craters.
Results: We selected areas in Tsiolkovsky crater and Sinus Iridum to develop our method. We used the multispectral data obtained by the multi‑band imager of the Japanese Selene Mission to determine the iron abundance. The result for the Sinus Iridum area is shown in Figure 1b. Most craters are primary craters (yellow). The identified secondary craters (red) are either chain-like or isolated (green), rather than clustered. Some of the secondary craters have diameters larger than 400 m (purple).
Discussion: To improve the reliability of secondary crater identification, the results were verified by CSFD. Our dating results were compared with existing ages. The similar age indicates that the method can identify secondary craters (Table 1). Besides morphological considerations and spatial patterns of secondary craters, our secondary crater identification method might provide an additional possibility to detect secondary craters and to eliminate them from CSFD measurements. Secondary Craters Not Excluded
Table 1. Dating Results (Ga)
|
Area |
Pasckert, 2015 Hiesinger, 2011 |
Secondary Craters Not Excluded |
Excluded Secondary Craters |
|
Tsiolkovsky Crater Area |
3.2 |
3.37 |
3.22 |
|
Sinus Iridum Area 1 |
3.0 |
3.47 |
3.02 |
|
Sinus Iridum Area 2 |
3.0 |
3.43 |
3.04 |
References: [1] Hiesinger, H., van der Bogert, C. H., Michael, G., Schmedemann, N., Iqbal, W., Robbins, S. J., Ivanov, B., Williams, J. P., Zanetti, M., Plescia, J., Ostrach, L. R., & Head, J. W., III. (2023). The Lunar Cratering Chronology. Reviews in Mineralogy and Geochemistry, 89(1), 401-451. [2] Taylor, L. A., & Meek, T. T. (2005). Microwave sintering of lunar soil: properties, theory, and practice. Journal of Aerospace Engineering, 18(3), 188-196. [3] Ye, L., Xu, X., Luan, D., Jiang, W., & Kang, Z. (2017). Automatic Detection and Recognition Of Craters Based on The Spectral Features Of Lunar Rocks and Minerals. Int. Arch. Photogramm. Remote Sens. Spatial Inf. Sci., XLII-3/W1, 199-204. [4] Plescia, J. B. (2015, March). Lunar crater forms on melt sheets—Origins and implications for self-secondary cratering and chronology. In 46th Annual Lunar and Planetary Science Conference (No. 1832, p. 2054). [5] Hiesinger, H., Head, J. W., III, Wolf, U., Jaumann, R., Neukum, G., Ambrose, W. A., & Williams, D. A. (2011). Ages and stratigraphy of lunar mare basalts: A synthesis. In Recent Advances and Current Research Issues in Lunar Stratigraphy (Vol. 477, pp. 0). Geological Society of America.
How to cite: Xu, X., Ye, L., Zhang, D., Kang, Z., Hu, T., Bogert, C. H. V. D., and Hiesinger, H.: Identification of Secondary Craters Based on Variations in Iron Composition on Lunar Mare, Europlanet Science Congress 2024, Berlin, Germany, 8–13 Sep 2024, EPSC2024-1145, https://doi.org/10.5194/epsc2024-1145, 2024.
Over the last two decades, an international program of lunar exploration has continued to pick up speed, with over ten countries launching missions towards the Moon, successful robotic landings by several of them, and plans for humans to return to the surface and begin—for the first time—to learn how to live and work on another planetary body. Multiple commercial companies are designing and launching lunar landers, heralding unprecedented public access to the lunar surface. The Moon is a celestial body with deep cultural meaning to a great number of populations across planet Earth. Thus, it is important to engage the whole world as the next fundamental science and exploration steps are taken.
The importance of worldwide engagement in the science and exploration of the Moon is well established. Numerous organizations, including the International Lunar Exploration Working Group (ILEWG), the Moon Village Association, and the International Space Exploration Coordination Group (ISECG), have been developing roadmaps for international partnerships in lunar exploration, engaging countries that have not historically been a part of space exploration efforts. The International Lunar Year of 2027 (ILY2027) seeks to build on the strong foundation that these organizations have lain by forging a sustained campaign of collaborations involving scientists, policy makers, the commercial sector, educators, and the public throughout the world, to establish together new guidelines and standards for exploration and for disseminating scientific data.
ILY2027 follows the tradition set by the International Geophysical Year of 1957–58, which advanced science, drove political collaborations, and caught the attention of the global public. ILY2027 seeks participation from diverse communities to collect and analyze data to understand the lunar environment, navigate challenging political issues such as resource utilization, protect the myriad historical, cultural, and scientific aspects of the Moon, and establish standards for operation as different countries and commercial companies move towards extended operations on the lunar surface. At the Europlanet Science Congress, we will present initial high-level scientific and cultural goals for ILY2027, with the aim of broadening involvement and engaging nations and other interested parties across the world.
How to cite: Klima, R., Neal, C., Jawin, E., Pieters, C., Hanlon, M., Keane, J., Livengood, T., Barnes, J., Rubio, M., Glotch, T., Schmidt, G., and Byrne, P.: International Lunar Year 2027: Advancing Lunar Science and Exploration Globally, Europlanet Science Congress 2024, Berlin, Germany, 8–13 Sep 2024, EPSC2024-1255, https://doi.org/10.5194/epsc2024-1255, 2024.
Introduction: A new class of enigmatic deposits on the Moon has emerged since the Lunar Reconnaissance Orbiter entered orbit that contrasts with the lunar regolith at large. Unlike optical anomalies, such as swirls, these deposits are unusual for their thermophysical characteristics. One class consists of lunar cold-spot craters, so-named because they are characterized by extensive regions, relative to their cavity diameter and depth, of anomalously cold regolith temperatures in nighttime Diviner data [2]. These cold regions are not easily explained by conventional impact mechanics. Hayne et al. [1] further characterized these features with high Diviner-derived H-parameter values which provides a convention for describing thermophysical depth profiles. The H-parameter governs the variation of density and conductivity of the lunar regolith with depth and is independent of temperature. The high H-parameter values that cold-spot craters show suggests their thermophysical properties are consistent with a ‘fluffed up’ regolith in the upper 10 to 30 cm created by some aspect of the impact process.
Also reported by [1] were thermophysically distinct signatures associated with pyroclastic flows and a thermophysically unique region near ~45°N, ~45°E. This region is southeast of Mare Frigoris and is more expansive than typical cold spots, encompassing the craters Atlas, Hercules, Burg, and Keldysh. With thermophysical similarities to cold spots, initially the region seemed to fit the definition of a cold spot. However, the region is without similar geomorphological characteristics and bears dramatic differences in spatial scale to cold spots and conventional lunar pyroclastic deposits. The ‘Atlas thermophysical anomaly’, as we denote it here, also consists of high H-parameter values relative to its surroundings, suggesting it consists of finer regolith materials, with higher porosities (is ‘fluffier), and has lower thermal inertias than typical regolith. But, the mechanism necessary to form such a large thermophysically distinct region is less clear making it enigmatic even relative to cold-spots.
As mentioned previously, the regions thermophysical values are also consistent with pyroclastic deposits. Further, Atlas crater itself is a floor fractured crater with previously documented evidence of magmatic/volcanic activity in the form of pyroclastic deposits [3, 4]. However, these pyroclastic deposits are localized to the Atlas crater cavity floor and no known studies have inferred additional expansive volcanic activity that would be coincident within the thermophysical boundaries until now.
Making the region more scientifically intriguing, the craters Atlas, Hercules, and Burg have each previously been identified as radar dark halo craters [5]. Ghent et al. [6]’s most recent analysis of the physical properties of radar dark halo craters reported that the halo material is depleted in surface rocks, but are otherwise thermophysically indistinct from background regolith. This contrasts with what we observe in H-parameter maps of the Atlas region. Here, with additional radar, TIR, and gravity data sets for perspective we re-examine the region relative to other traditional radar dark halo craters in search of similarities and differences in formation mechanism(s) and timing.
Objectives: The Atlas region may provide a unique insight into how the lunar regolith is being weathered that contrasts with cold spots in general. For example, unlike the Atlas region, cold spots are not typically detected in radar wavelengths. Here we focus our investigation on the physical properties of the Atlas region and how they may or may not be synergistic with its thermophysical properties with increasing depth. We do this with a combination of monostatic and bistatic radar observations of the region at multiple wavelengths, and we postulate potential formation mechanisms of this region relative to lunar cold spots and radar-dark halo craters (e.g., new craters, pyroclastic deposits, etc.). And finally, we examine GRAIL gravity data to determine if additional information can be derived from the deeper subsurface regarding magmatic/volcanic potential. Questions we aim to answer include: How does the mechanism that formed the Atlas thermophysical anomaly contrast with that of typical cold spots, pyroclastic deposits, and radar dark halo craters?
Methods: Study of this region starts with the analysis of Diviner H-parameter and rock abundance maps relative to Mini-RF monostatic S-band (12.6 cm) and Earth-based Arecibo Observatory-Greenbank Observatory bistatic P-band (70.3 cm) observations. The contrast in physical sensitivity between circular polarization ratio of these two radar data sets and Diviner’s thermophysical information is complementary regarding surface and subsurface material, size, and relative stratigraphic depths. We also compare these data with optical and GRAIL-derived cryptomare detection maps to examine the potential of magmatic source influences in the region.
Discussion: In 12.6 and 70 cm image data (Figure 1), the Atlas region shows distinctive low backscatter characteristics more consistent with radar-dark halo craters than lunar cold-spots which are usually undetectable at radar wavelengths [1, 5]. The radar-dark halo craters Burg, Atlas, and Hercules show backscatter properties consistent with lunar regolith devoid of scatterers (boulders, fractures, and corner reflectors) to at least ~10 m depths, significantly greater depths than sensed by Diviner. However, Atlas is thermophysically distinct from is surroundings, unlike most radar-dark halo craters which show little contrast in the H-parameter relative to background regolith, consistent with Ghent et al. [6]’s findings. This suggests something about this region is unique from most other RDHCs.
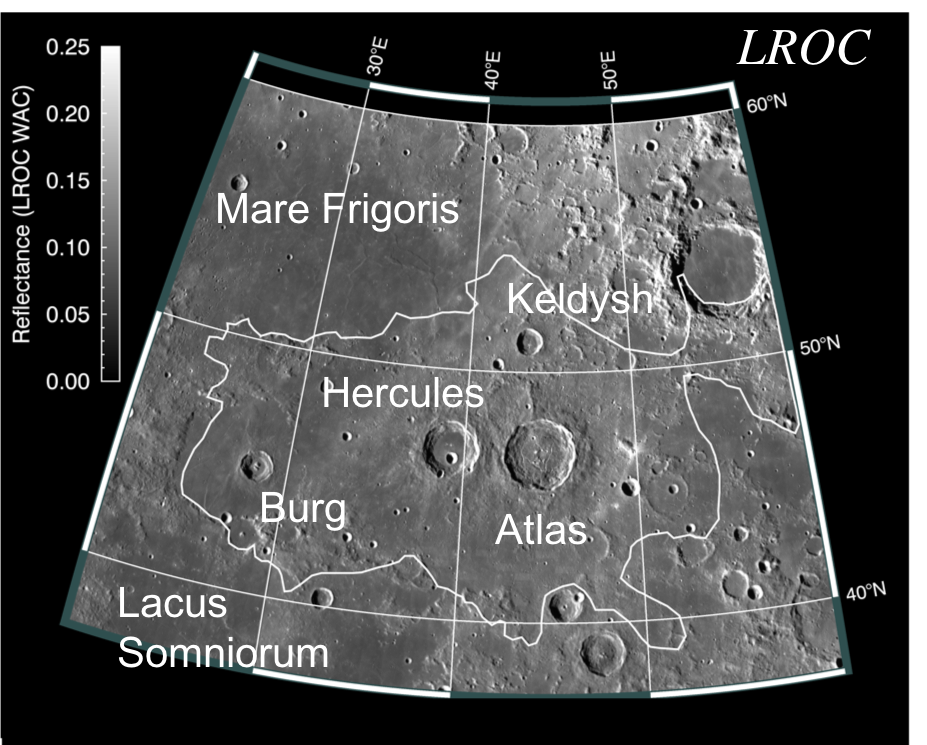
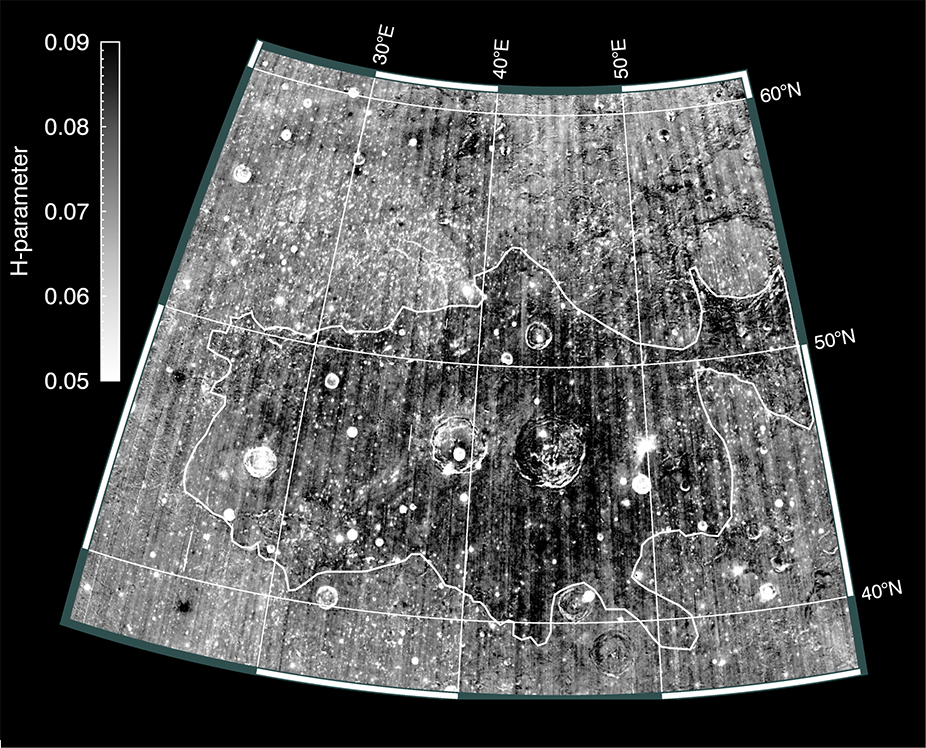
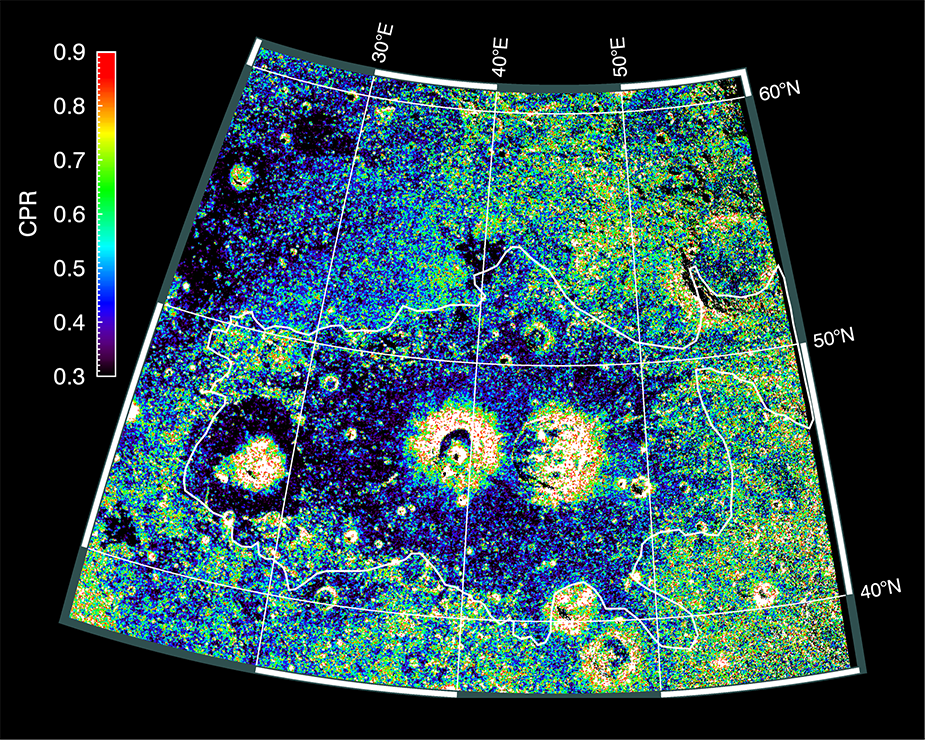
Figure 1
GRAIL-derived cryptomare thickness maps of [7; Fig. 2] show modest thicknesses (400 to 600 m) starting on the northern side of the anomaly that cut down west of Hercules crater and surround Burg with increasing thicknesses (600 – 800 m). Volcanism is pervasive here on the western anomaly complicating the geologic history and inferred formation mechnism. While proximity may suggest volcanism influenced the anomalies formation, though likely did not instigate it, it was not a uniform influence across the anomaly. Atlas crater sits alone, apparently free of volcanic influence, with no optical or gravity cryptomare detections in its vicinity.
Figure 2
References: [1] Hayne et al. (2017) JGR. [2] Bandfield et al. (2014) Icarus. [3] Gaddis et al. (2003) Icarus. [4] Gaddis et al. (2000) JGR. [5] Ghent et al. (2005) JGR. [6] Ghent et al. (2015) Icarus. [7] Izquierdo et al. (2024) JGR.
How to cite: Cahill, J., Marting, A., Izquierdo, K., and Patterson, W.: An Atlas/Hercules thermophysical anomaly examination relative to radar dark halo craters and its regional volcanism, Europlanet Science Congress 2024, Berlin, Germany, 8–13 Sep 2024, EPSC2024-1172, https://doi.org/10.5194/epsc2024-1172, 2024.
Introduction: The topography of a landing region is a critical factor in the operational safety and planning of human extravehicular activities (EVAs). Consequently, digital terrain models (DTMs) and derived slope maps are employed to impose constraints on proposed EVA paths with minimal slopes and elevation discrepancies. It is clear that there are technical constraints associated with the use and operation of equipment and tools, such as suits and instrument carts, and astronaut walking trafficibility. While these constraints have been improved over the years, it is also important to consider the observational, physiological, and psychological experiences and constraints of astronauts when planning successful EVAs. This study examined Apollo astronaut reports as well as audio and video recordings to ascertain the experience and performance of the astronauts in relation to the topography and slopes encountered during their EVAs.
Data and Methods: We conducted an analysis of the elevations and slopes along the traverses of the Apollo landing sites, utilizing the Lunar Reconnaissance Orbiter (LRO) Narrow Angle Camera (NAC) derived Digital Terrain Model (DTM) with a 2-m pixel resolution and the related slope map with a 6-m baseline [1,2] (Fig. 1). We extracted topographic profiles of each Apollo landing site traverse in ArcGIS Pro and imported them into Matlab for evaluation. The profiles are simplified and vertically exaggerated by a factor of two (Fig. 1).
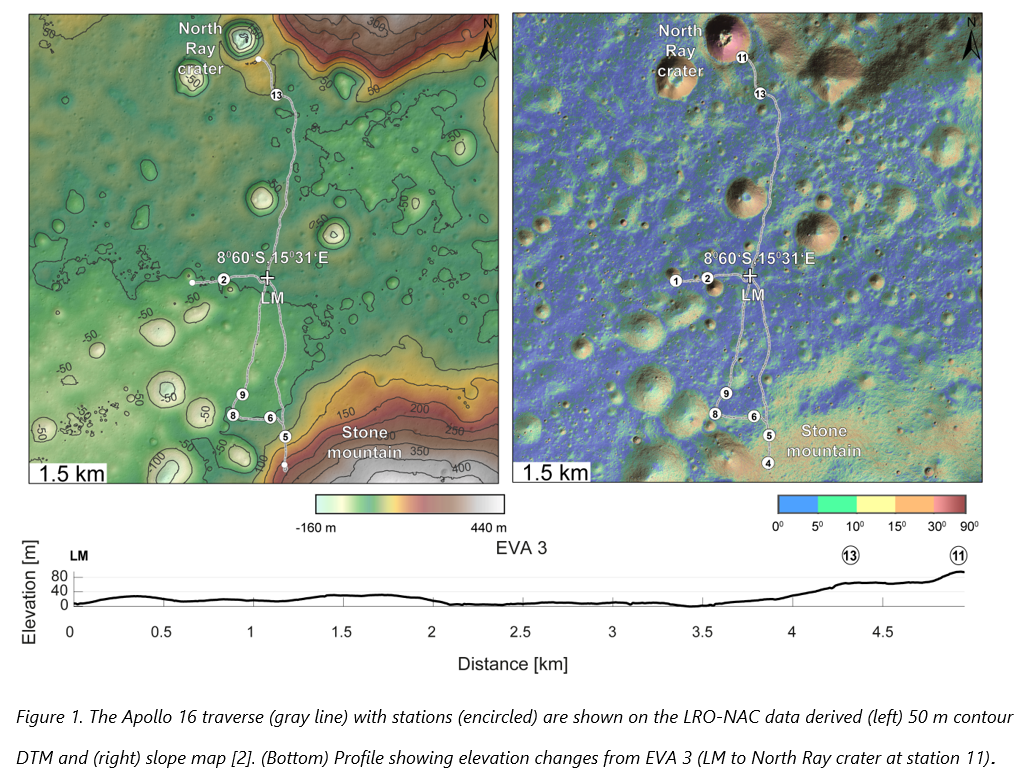
Furthermore, we examined NASA's extensive archive of Apollo mission journals, images (Fig. 2) and video libraries [3], from which we extracted discussions among the astronauts about their experiences dealing with challenging terrain.
Distance Perception: The Apollo astronauts reported difficulty perceiving the distance and size of objects [3]. In addition, incorrect estimates of size and distance have been reported by travelers on Earth, which are attributed to “the absence of objects of comparison” [4]. Astronauts' perceptions are highly influenced by lighting conditions. In conditions with low sun angles, which are prevalent during landing due to the lunar morning landing time, shadows appear longer (Fig. 2) and the terrain appears more rugged. [5].
Slopes Perception: The Center of Lunar Science and Exploration report [6] classifies slopes with inclinations of less than 25° as highly accessible. However, more detailed, quantitative data on the performance of Apollo and Lunokhod provides specific guidelines for use under both Earth-based and lunar conditions [7]. The perception of slope steepness can also be affected by lighting conditions, with boulders on slopes casting particularly long shadows which exaggerate the actual steepness of the slopes. During the Apollo 16 mission, the astronauts standing on the North Ray crater rim (Fig. 2) were unable to see the crater floor. Consequently, they perceived the slope of the wall to be approximately 60°. However, this was in fact less than 30° [3] (Fig. 1).
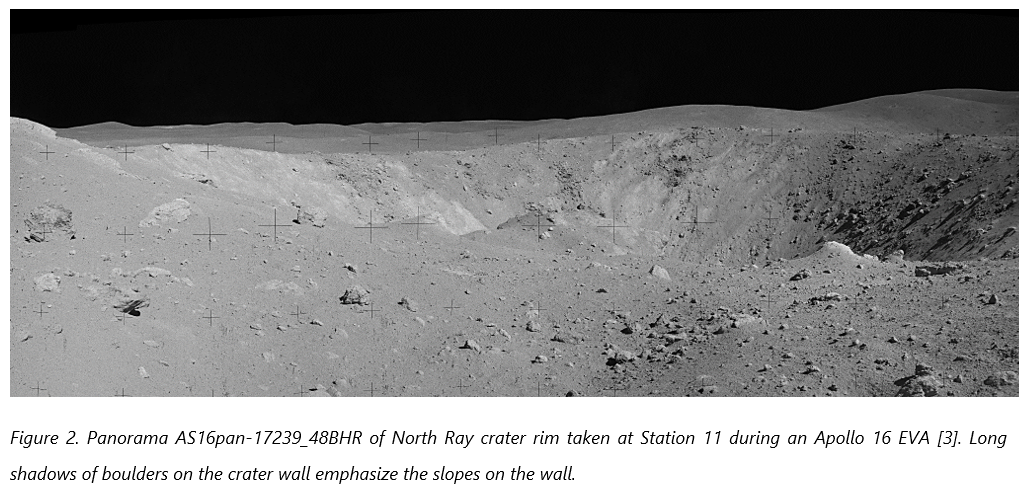
The lunar surface is characterised by a soft regolith, which presents a challenge for walking on uphill slopes. However, the Moon's gravity is ~1/6th of the Earth, which reduces the risk of astronauts sliding downhill [3]. In their own accounts, astronauts have noted that they relied on their center of gravity while walking downhill [3]. Additionally, Apollo astronauts frequently reported the challenge of traversing slopes due to the limited mobility afforded by carrying their tools and samples. This restriction in movement resulted in a longer time needed to complete a traverse [3]. The lunar roving vehicle was introduced to the Apollo 15, 16, and 17 missions to facilitate the exploration of greater distances and steeper slopes by the astronauts.
Future Missions Planning: The 13 Artemis landing sites were selected on ridges and large crater rims at the South Pole in well-illuminated areas with good Earth visibility, and with potential access to the presumably volatile-rich permanently shadowed regions (PSRs) [7]. However, the landing sites are situated in more complex geological terrains, which may necessitate a greater duration of time at individual stations for the completion of tasks. The astronauts climbed up to 150 m during the Apollo missions and walked on slopes of <15°. In contrast, the Artemis landing sites have elevation differences of ~3400 m. The Apollo astronauts traversed near-equatorial regions on relatively smooth surfaces, but perceived them as rough at low sun angles. Near the South Pole, this effect can be more extreme, limiting visibility and mobility during EVA exploration. It is of the utmost importance to prioritize safety measures [6] and to learn from past successful missions in order to optimize success.
[1] Scholten F., et. al. (2012). J. Geophy. Res. Planet 117 (E12), 2156–2202.
[2] Henriksen M. R., et. al. (2017). Icarus 283, 122–137.
[3] Jones E. M., Glover K. (2017). Apollo lunar surface journal. NASA.
[4] Darwin, C, (1835) ch. XV, p 347, ISBN-13 : 978-1787377424
[5] van der Bogert, C. H., et. al. (2022). LPSC 53., # 1347.
[6] Kring, D. A., Durda, D. (2012). LPI. #1694.
[7] Basilevsky, A.T., et al. (2019). Solar System Research, 53, 383-398.
[8] McKay, D.S., et al. (1991). Lunar sourcebook, 285-356.
How to cite: Iqbal, W., Head, J. W., van der Bogert, C. H., Frueh, T., Henriksen, M., Bickel, V., Kring, D., Hiesinger, H., Scott, D. R., and Heyer, T.: Astronaut experiences on the slopes along Apollo EVAs, Europlanet Science Congress 2024, Berlin, Germany, 8–13 Sep 2024, EPSC2024-196, https://doi.org/10.5194/epsc2024-196, 2024.
Please decide on your access
Please use the buttons below to download the supplementary material or to visit the external website where the presentation is linked. Regarding the external link, please note that Copernicus Meetings cannot accept any liability for the content and the website you will visit.
Forward to presentation link
You are going to open an external link to the presentation as indicated by the authors. Copernicus Meetings cannot accept any liability for the content and the website you will visit.
We are sorry, but presentations are only available for users who registered for the conference. Thank you.
Please decide on your access
Please use the buttons below to download the supplementary material or to visit the external website where the presentation is linked. Regarding the external link, please note that Copernicus Meetings cannot accept any liability for the content and the website you will visit.
Forward to session asset
You are going to open an external link to the asset as indicated by the session. Copernicus Meetings cannot accept any liability for the content and the website you will visit.
We are sorry, but presentations are only available for users who registered for the conference. Thank you.