
Depth to diameter ratio of lunar craters and its possible correlation to the water ice deposits
 1,2,
1,2,- 1Physical Research Laboratory, Ahmedabad, India (sachanasathyan22@gmail.com)
- 2University of Kerala, Thiruvananthapuram, India
Introduction: The depth to diameter ratio (d/D) of a crater is an important morphological parameter that represents the extent of crater degradation. Recently several studies utilized d/D of craters at Moon and Mercury’s poles as a possible indicator of water ice deposition [1, 2, 3]. The study conducted by [2] revealed a poleward decrease in d/D for both Mercury and the Moon for a diameter range of 2-15km. The gradual shallowing of craters towards the poles is particularly observed at the lunar south pole compared to the north pole which was attributed to the potential infilling by water ice. Also the craters with permanently shadowed regions (PSRs) on Moon was found to be shallower (lower d/D) as compared to the illuminated craters at lunar south pole.
Interestingly, the lunar north pole does not show similar d/D trend as the south pole [2]. However, several other measurements including neutron spectrometer, radar, illumination and temperature variations [4, 5, 6] suggest ice containing north polar region albeit with a lower ice concentration compared to the south pole. This observed discrepancy is the motivation of this work where we used an existing d/D catalogue and integrated the outcomes with several other parameters like temperature, radar based circular polarisation ratio (CPR) and NIR based water detections.
Methods: About 9100 simple craters spanning both the poles within a latitudinal range of 65° N/S to 90° N/S, with crater diameter range between 5-20 km were analyzed to understand if d/D can be used as a proxy to water ice filling. We considered already available illumination, temperature [6], CPR [7] and NIR [5] based water ice detection maps in order to establish the correlation if any with d/D parameter.
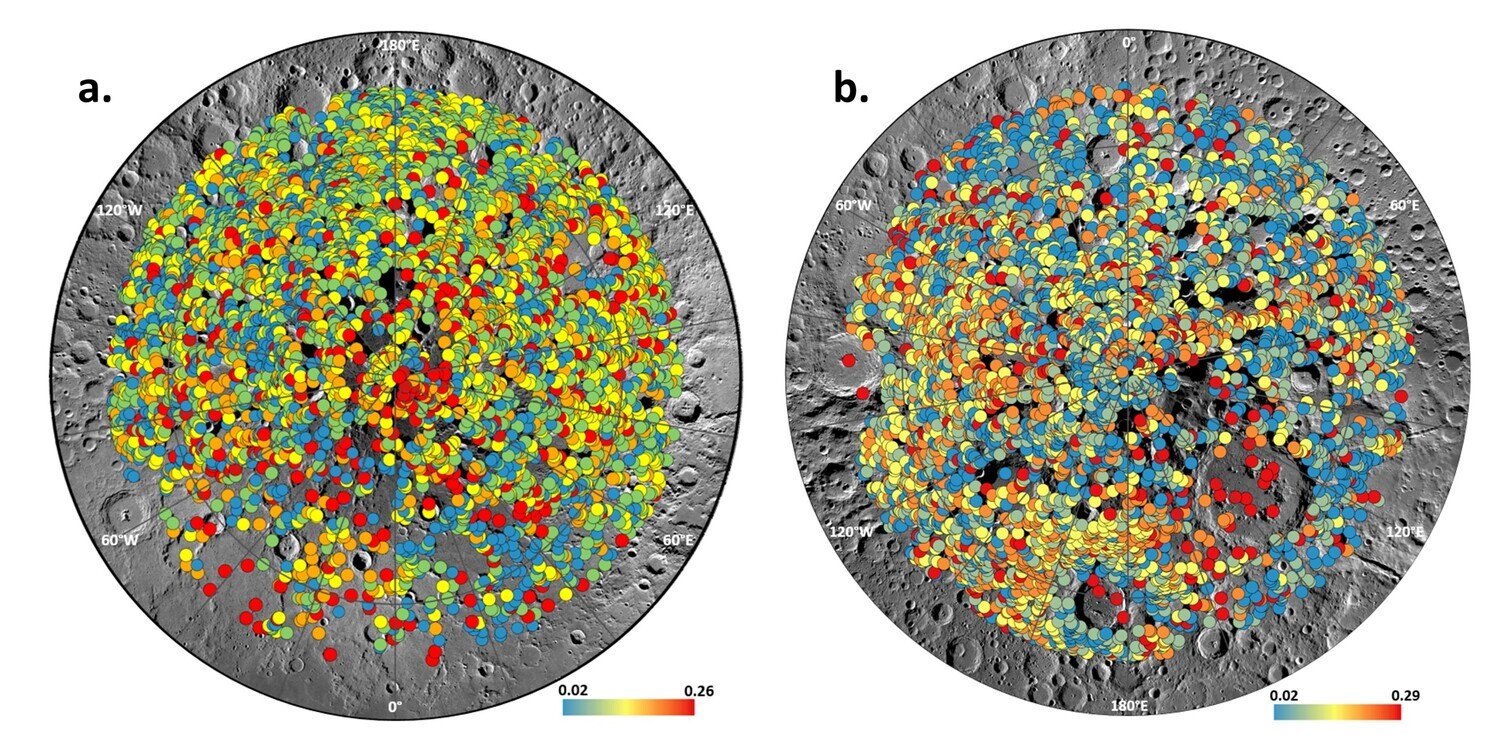
Fig 1. Depth to diameter (d/D) ratio distribution for craters of north (a) and south (b) poles. Base image LROC WAC mosaic.
Results: A gradual decrease in d/D ratio is observed at latitudes 80 ̊-90 ̊ for south pole (Fig 2) while an opposite trend is visible for North pole with increasing mean d/D with increasing latitude towards North. In order to correlate whether the observed trend especially for south pole is corresponding to water ice deposits, locations of craters with specific temperature conditions (below 110 K) [6], those confirmed to have water- ice deposits based on M3 observations [5], and those exhibiting anomalous behaviour according to circular polarization ratio (CPR) derived from Chandrayaan-2 Dual Frequency Synthetic Aperture Radar (DFSAR) [7] were incorporated to the plot (Fig 2).
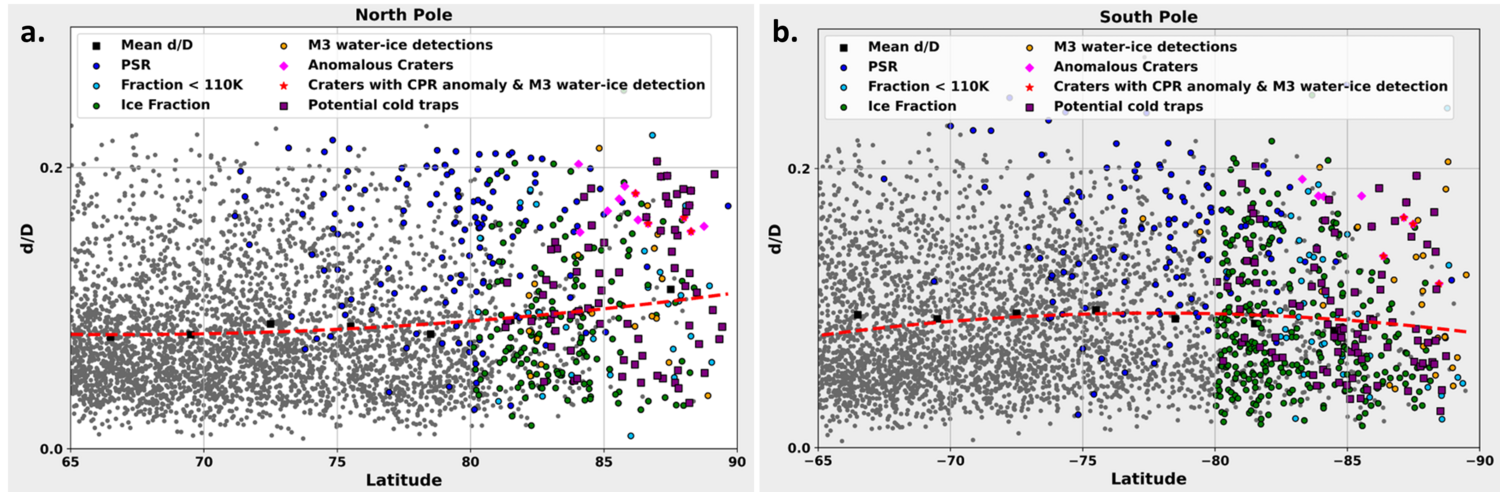
Fig 2. The depth-to-diameter ratio (d/D) for craters at lunar poles: (a) north (65-90 ̊N) and (b) south (65-90 ̊S), integrated with temperature, DFSAR, and M3 observations. Black markers depict mean d/D in 3 ̊ bins. Dark grey markers signify non-PSR craters. The horizontal dashed line serves as a reference based on average d/D values at 65 ̊N/S.
As per the results from [2] it is anticipated that craters identified as water ice-rich using radar and NIR techniques would exhibit lower d/D values. However, contrary to expectations, Fig. 2 illustrates no clear correlation between d/D values and confirmed water ice detections. These findings highlight that the lower d/D of craters towards the poles might be influenced by additional factors and should not be singularly relied upon for estimating water ice filling. Also it is expected to have a lower d/D for craters with PSRs as compared to illuminated craters of the same diameter range due to water ice infilling in PSRs. Comparing the d/D of PSRs and non PSRs (illuminated craters) at both the poles, we found that the mean d/D value of PSRs and non-PSR craters differed, with the non-PSR craters having a significantly lower d/D. In case of the North Pole, this effect is particularly noticeable.
Conclusion: We found that the analysis of d/D ratio of craters is shown to have a latitudinal dependence in case of the south pole as observed by [2] but the obvious correlations with other measurement techniques are missing. The result so far is not supporting the decrease in d/D ratio and its linkage to water ice deposition. Also the contribution of sub surface ice deposits to the observed d/D trend cannot be ignored as the datasets used in the study have a detection limit of water ice only at surface level. Analysis involving changes in the slope of the crater due to water ice deposition is under progress which will further help in understanding clear trends if any on the topographic modification of craters due to water ice infilling.
References: Kokhanov et al., (2015) Sol. Sys. Res., 49, pp.295-302 [2] Rubanenko L. et al., (2019) Nat. Geosci., 12(8), 597-601. [3] Marco Figuera R. et al., (2022) Remote Sensing, 14(3), 450. [4] Lawrence D. J. (2006) JGR Planets, 111(E8). [5] Williams J. P. et al., (2019) JGR: Planets, 24, 2505–2521. [6] Li S. (2018) PNAS 115(36), 8907-8912. [7] Putrevu D. et al., (2023) JGR Planets, 128(12), e2023JE00774
How to cite: Sathyan, S., Bhatt, M., Kumar, S., Srivastava, N., and Bharadwaj, A.: Depth to diameter ratio of lunar craters and its possible correlation to the water ice deposits, Europlanet Science Congress 2024, Berlin, Germany, 8–13 Sep 2024, EPSC2024-1086, https://doi.org/10.5194/epsc2024-1086, 2024.