
Digital Terrain Models of the NASA ARTEMIS sites from single LROC-NAC images using the UCL MADNet retrieval system.
 1,1,2,2
- 1Mullard Space Science Laboratory, UCL Dept., of Space and Climate Physics, Holmbury St Mary, Surrey, RH5 6NT, UK
- 2Planetary Sciences and Remote Sensing Group, Department of Earth Sciences, Freie Universität Berlin,Malteserstr. 74-100, 12249 Berlin, Germany
- Introduction
Large area, high-resolution, three-dimensional (3D) mapping of a planetary surface is not only essential for performing key science investigations on the formation and evolution of the surface, but is also critical for planning and supporting existing and future surface robotic missions as well as planning human exploration. Over the past 20 years, 3D mapping of the Moon surface has only been performed for larger areas with low-resolution data, or for very small areas with higher-resolution data.
Large area lower-resolution 3D mapping work usually refers to the global lunar digital terrain models (DTMs) created from the NASA Lunar Orbiter Laser Altimeter (LOLA) and LOLA altitudes blended with the Japanese SELenological and Engineering Explorer (SELENE) DTMs from the Kaguya Team at a grid-spacing at 118 m/pixel and 60 m/pixel, respectively, or using the Chang’E-2 3D image products at 7mpp or 3D map products at 20mpp. On the other hand, smaller area higher-resolution 3D mapping work usually employs the LROC Narrow Angle Camera (NAC) images at 0.5-1.5 m/pixel producing DTMs at about 5m/pixel using photogrammetry or DTMs at 0.5-1.5 m/pixel using photoclinometry.
The limitations of having to trade-off between “large area” and “high-resolution”, for lunar 3D mapping is a consequence of three different aspects. Firstly, lower-resolution data such as LROC WAC and Chang’E-2 (CE-2) generally have better stereo coverage, whereas the main high-resolution data to date (LROC NAC) only has limited stereo coverage (≤1% of the lunar surface). Secondly, the photogrammetry and photoclinometry processes are complex and subject to different errors (or artefacts) at each of their different processing stages, which require specialist expertise to deal with these complexities in order to produce high-quality DTM products, especially over large areas. Thirdly, the expensive computational cost from existing photogrammetry and photoclinometry pipelines makes it extremely difficult to achieve large area high-resolution coverage in any realistic time-scale.
To address these limitations, a single input image-based rapid surface modelling system has been developed, called MADNet 2.0 (Multi-scale generative Adversarial U-net with Dense convolutional and up-projection blocks) [1] to create high-resolution DTM products for the NASA MoonTrek system previously for the von Karman crater [2]. Here we apply MADNet to 7 of the 13 ARTEMIS landing sites near the lunar south pole which have very different illumination conditions.
- Methods
27 higher resolution LOLA DTMs of 5 mpp (usually they are 118 mpp) were processed by the NASA GSFC LOLA team [1] and are shown in Figure 1.
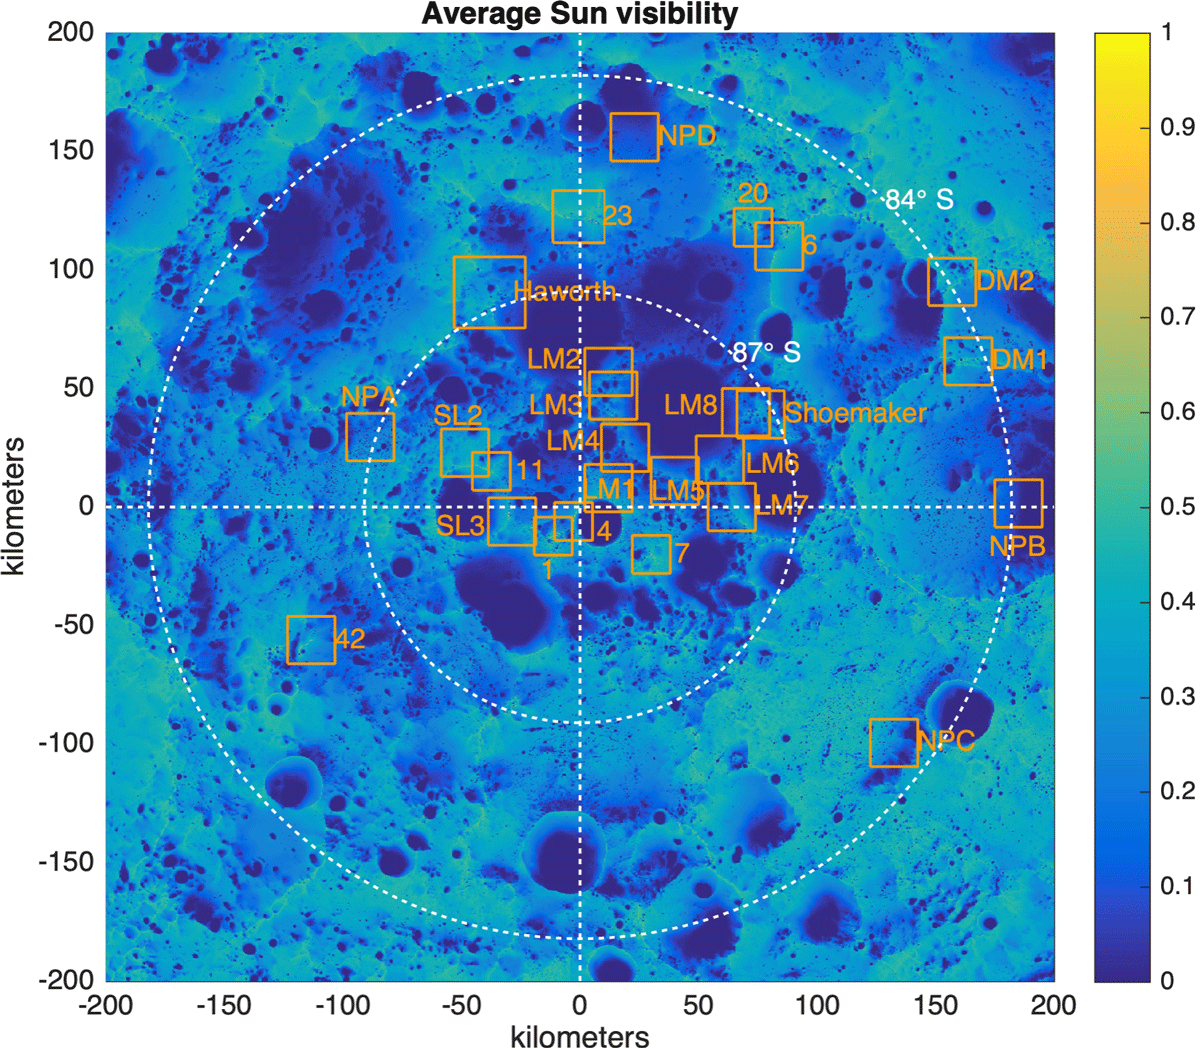
Figure 1. Display of 5 m/pixel LOLA DTMs created by the NASA GSFC LOLA team against a background generated from the LOLA 118 m/pixel global DTM. Our focus here is on the generation of 1m MADNet DTMs covering areas marked as Haworth, 23, 20, 6, DM1, DM2 and 7. Figure taken from https://pgda.gsfc.nasa.gov/products/78
A description of the overall MADNet processing chain can be found in [1] and Figure 2.
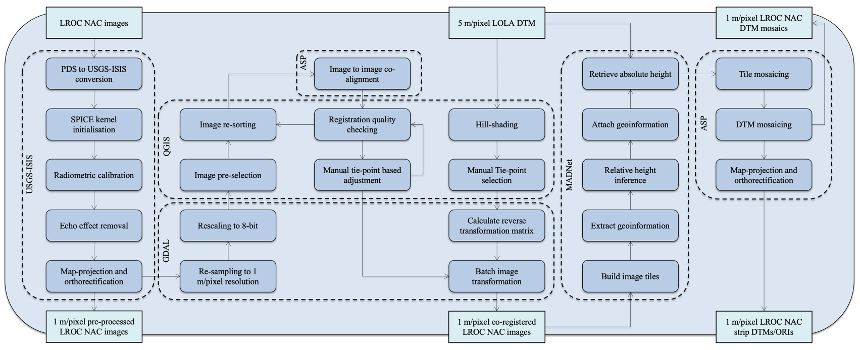
Figure 2. Flowchart of the MADNet 2.0 processing chain for DTM retrieval of single LROC-NAC images
A key requirement is the training of the network using pre-existing photogrammetrically derived DTMs consisting of 22,084 ORI-DTM training pairs (512*512 pixels at 5 m/pixel) which were formed using 392 pairs of single-strip downsampled 5 m/pixel LROC NAC PDS ORIs and 5 m/pixel stereo DTMs with horizontal and vertical flipping. The LROC NAC DTM processing includes 1) initial input selection (247 single-strip EDR data downloaded) and screening (103 out of 247 selected) for non-overlapping, quality and shadow control; 2) USGS-ISIS based pre-processing for format conversion (from PDS to ISIS CUBE), geometric calibration, artefact/noise removal and SPICE kernel initialisation, USGS-ISIS map-projection and orthorectification (cam2map) w.r.t. LOLA; 3) LROC NAC image co-alignment using the NASA Ames Stereo Pipeline (ASP)’s image_align method; 4) Manual tie-point based LROC NAC image co-registration with 5 m/pixel LOLA DTM; 5) MADNet based image-to-DTM inference that follows the standard MADNet 2.0 processing chain that is described in [1,2]; 6) ASP based tile and DTM mosaicing, as well as LROC NAC image orthorectification.
- Results
Seven 20 x 20 sq.km areas were processed but where there were significant gaps due to permanent shadows, these had to be filled in using the 5 mpp LOLA DTMs. Neither the NASA Shadowcam instrument [4] nor the Chandraya’an-2 OHRC [5] have sufficient coverage at present. Only 2 of the 7 sites show coverage > 50% as shown in Table 1.
Table 1. Summary of the higher-resolution LROC NAC DTM pixel coverage for the LOLA filled LROC NAC DTM mosaics of each site.
|
Site name |
LROC NAC DTM pixel coverage % |
|
Amundsen Rim |
54.33% |
|
Haworth |
20.12% |
|
Leibnitz Beta Plateau |
36.43% |
|
Malapert Massif |
40.77% |
|
Nobile Rim 1 |
40.35% |
|
Nobile Rim 2 |
49.47% |
|
Peak Near Shackleton |
51.78% |
Several example DTMs are shown here at 1mpp in Figures 3-6 as follows:
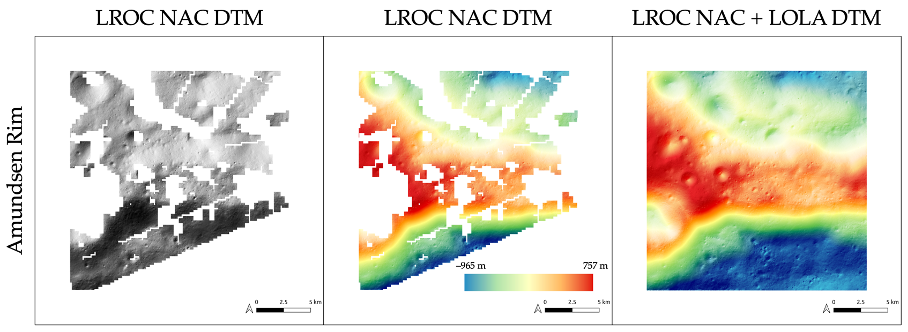
Figure 3. 1 m/pixel LROC NAC DTM products for Amundsen Rim
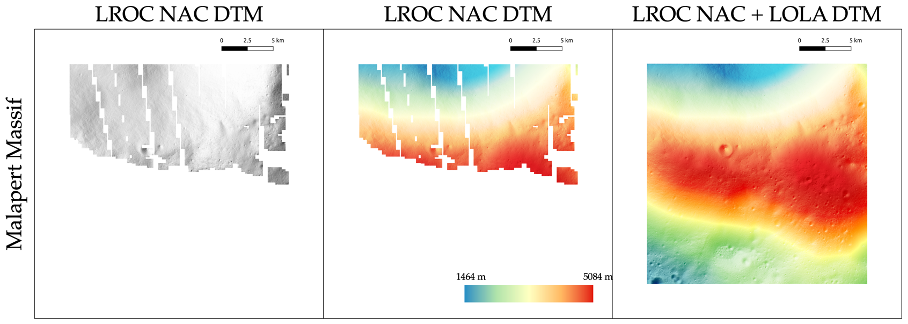
Figure 4. 1 m/pixel LROC NAC DTM products for Malapert Massif
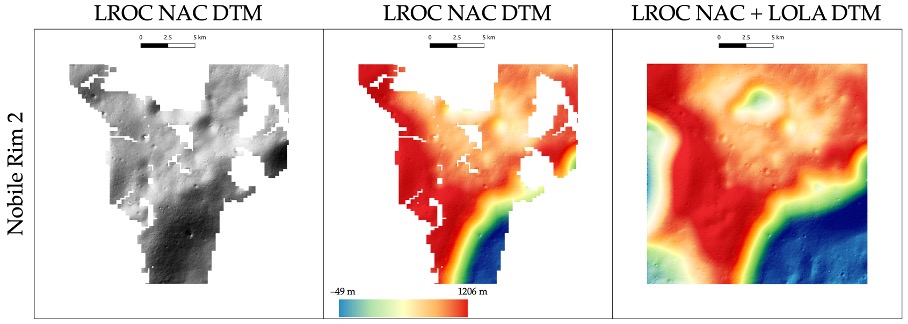
Figure 5. 1 m/pixel LROC NAC DTM products for Nobile Rim 1.
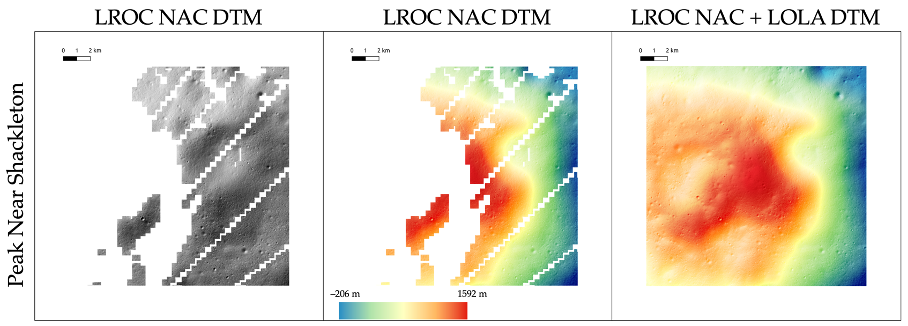
Figure 6. 1 m/pixel LROC NAC DTM products for Peak Near Shackleton
- Discussion and Conclusions
One metre DTMs were created from single image LROC-NAC images using the MADNet 2.0 DTM retrieval system which covered up to 54% of the 20 x 20km area. Significantly more detail is shown in the 1mpp DTMs compared with the LOLA 5 mpp DTMs. In order to fill these gaps in future, there need to be sufficient Shadowcam and/or Chandraya’an-2 OHRC shadow images and corresponding stereo DTMs at lower resolution for updating the training of the MADNet prediction model. All of these products will be released through the ESA Guest Storage Facility at https://www.cosmos.esa.int/web/psa/ucl-mssl_meta-gsf as well as through the NASA Moontrek system.
Cited references
[1] Tao, Y.; Muller, J.-P et al. Remote Sens. 2021, 13, 4220.
[2] Tao, Y.; Muller, J.-P. et al. Remote Sens. 2023, 15, 2643.
[3] Barker, M.K., et al. (2021),. https://doi:10.1016/j.pss.2020.105119.
[4] Robinson et al., 2023, J. Astron. and Space Science.
[5] Prateek Tripathi & Rahul Dev Garg doi: 10.5194/epsc2021-83
How to cite: Muller, J.-P., Tao, Y., and Walter, S. H. G.: Digital Terrain Models of the NASA ARTEMIS sites from single LROC-NAC images using the UCL MADNet retrieval system., Europlanet Science Congress 2024, Berlin, Germany, 8–13 Sep 2024, EPSC2024-1170, https://doi.org/10.5194/epsc2024-1170, 2024.