
 1,2,1,2,4,5,1,3,5,
- 1Dept. Earth Sciences, Univ. Western Ontario, CA (ltornabe@uwo.ca)
- 2Inst. Space & Earth Exploration, Univ. Western Ontario, CA
- 3INAF, Osservatorio Astronomico di Padova, IT
- 4School Phys. Sci., The Open University, UK
- 5Natural History Museum, UK
- 6Geological Sci., CCSU, CT
- 7Physikalisches Institut, UniBe, Bern, CH
Introduction:
CaSSIS is a visible to near-infrared (VNIR) bi-directional push-frame stereo camera onboard the ExoMars 2016 Trace Gas Orbiter (TGO) providing images at ~4.5 m/px (resampled to 4 m/px), < 9.5 km wide and up to ~50 km long with four broadband filters (BLU: 495 PAN: 678 RED: 836 NIR: 939 nm) [1]. This study demonstrates the effectiveness of CaSSIS data as a bridge between HiRISE IRB (~50cm-1m/px) [2] and hyperspectral VNIR+IR CRISM (targeted: ~16-40m/px; mapping ~180 m/px) [3-4] with examples from rover landing sites, active (Jezero, Gale) and future (Oxia Planum).
Methods:
To link and facilitate co-analysis between datasets and maximize the characterization of landing sites, we use a combination of 1) CaSSIS colour modeling, 2) colour transformations (e.g., Decorrelation Stretching - DCS), 3) spectral parameters and 4) a Dark Subtraction (DS) to minimize time-variable atmospheric scatter in the VNIR [5-9].
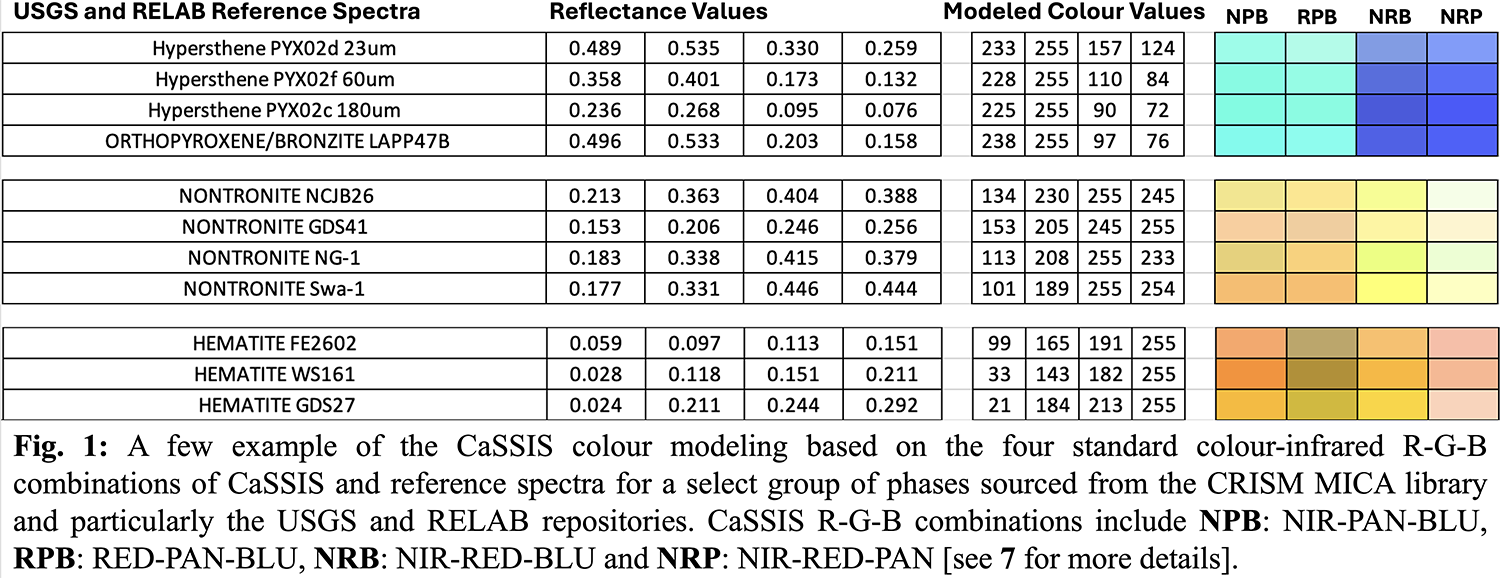
CaSSIS modeled colours aid with preliminary identification of phases by comparing them with observed CaSSIS NPB, HiRISE IRB, and CaSSIS/HiRISE-equivalent CRISM [7]. Our modeling method calculates the expected colour values for phases based on values from reference spectra for all CaSSIS bands, which are then combined into the four standard R-G-B combinations (i.e., NPB, RPB, NRB and NRP) (Fig. 1). This colour-modeling reveals and highlights the significance of relative colour on Mars. Relative colour is the manifestation of specific colour (rather than the predicted) based on the relative differences between the spectral character of a specific phase and that of the mean background. This may be unique to Fe-poor phases and provides the first explanation for the distinctive pinkish colour of chlorides and some Al-clays (e.g., kaolinite) in colour-infrared images [7, see 10].
We have been investigating the DS correction, recommended by [5] and demonstrated to effectively isolate surface spectral characteristics and facilitate spectral/compositional analysis between the datasets [6-9]. DS is critical for co-analysis as the ratio method employed by CRISM analysts does not work well for HiRISE and CaSSIS [7]. Lastly, DS-corrected CRISM will be compared to rover VISIR SuperCam (2020) and VNIR data from the MastCams (MSL & 2020) and PanCam (ExoMars) to validate phase identification and assess the effectiveness of the DS on orbital datasets.
Results & Discussion:
“Mega”breccia blocks within Jezero Crater.
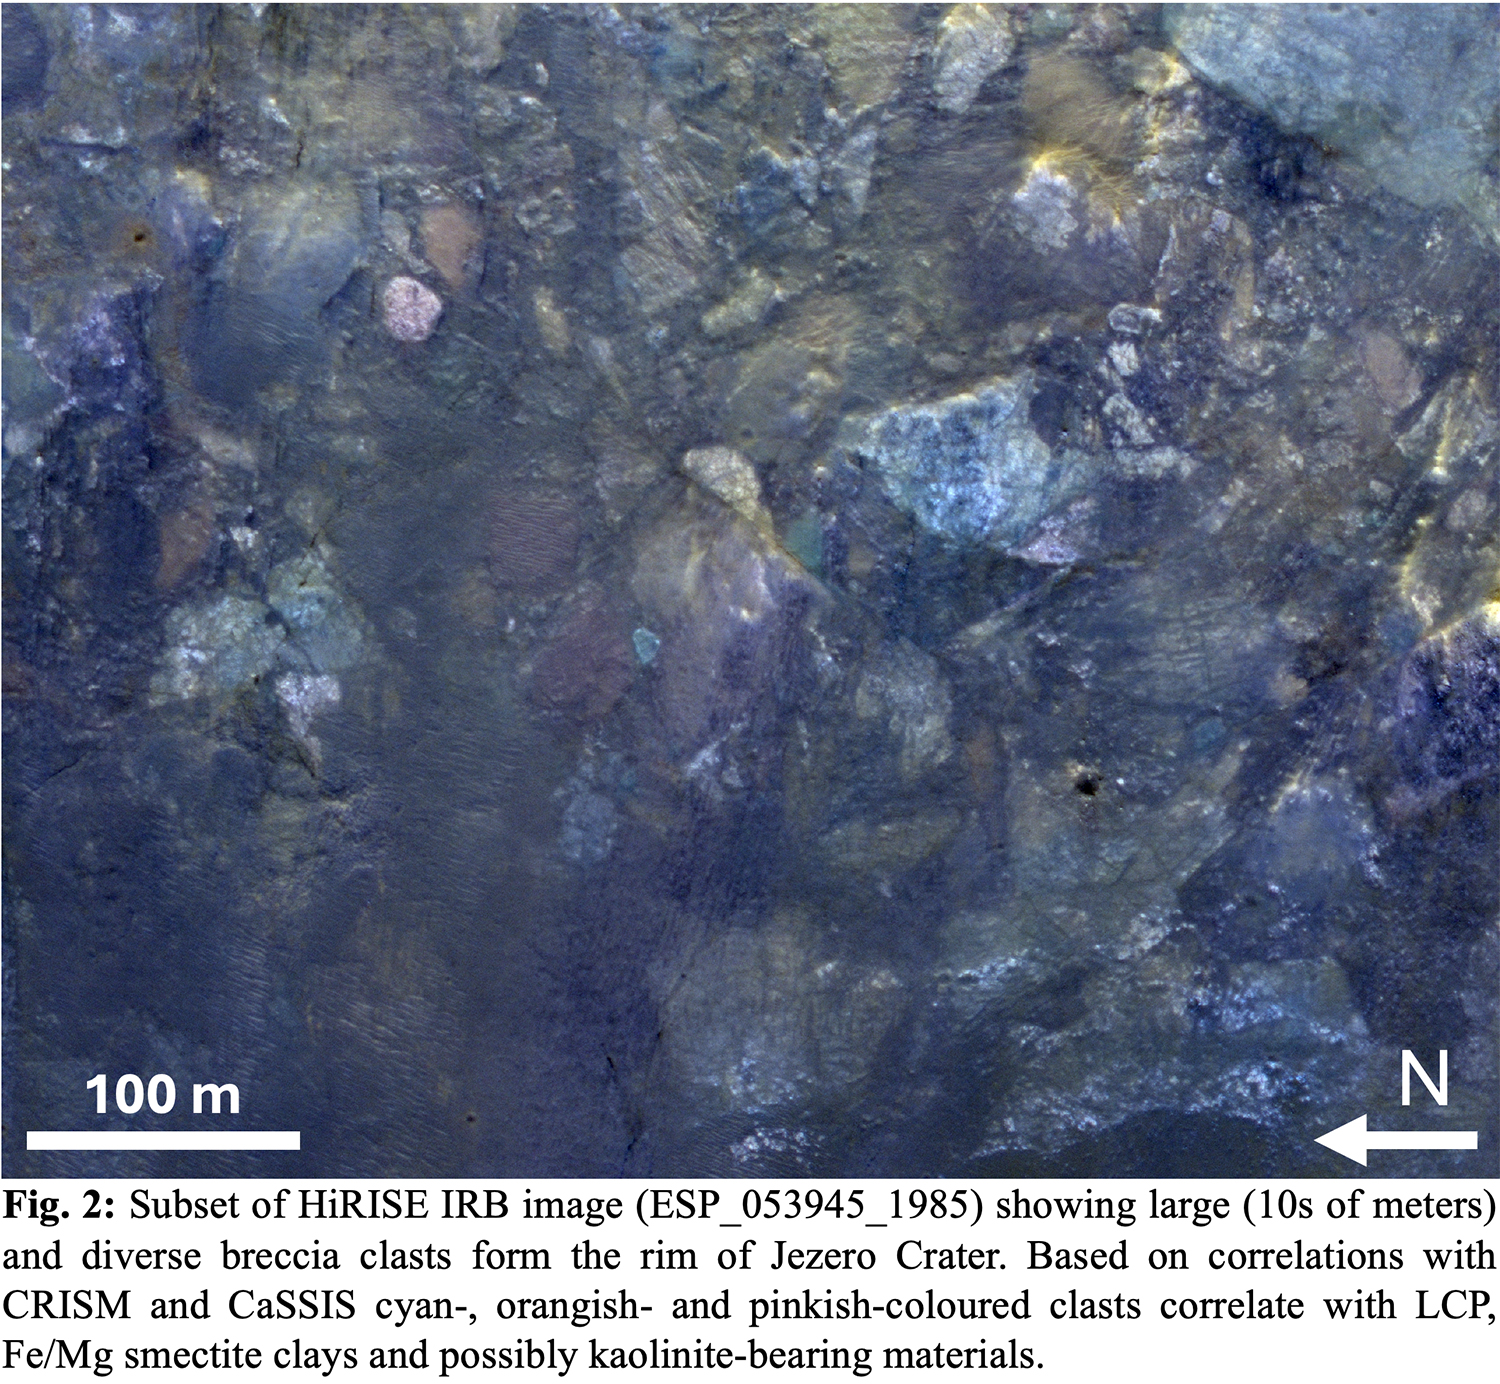
The geology of the Jezero Crater rim is characterized by the presence of large (10s-100s meters) and spectrally diverse clasts (Figs. 2 and 3); these likely originate from ancient crustal lithologies formed from multiple impact events pre-dating Jezero. Based on their characteristics, the rim also appears to include moderately- to poorly preserved Jezero impact melts; lastly, the rim possesses deposits that are interpreted to be post-Jezero [11-12].
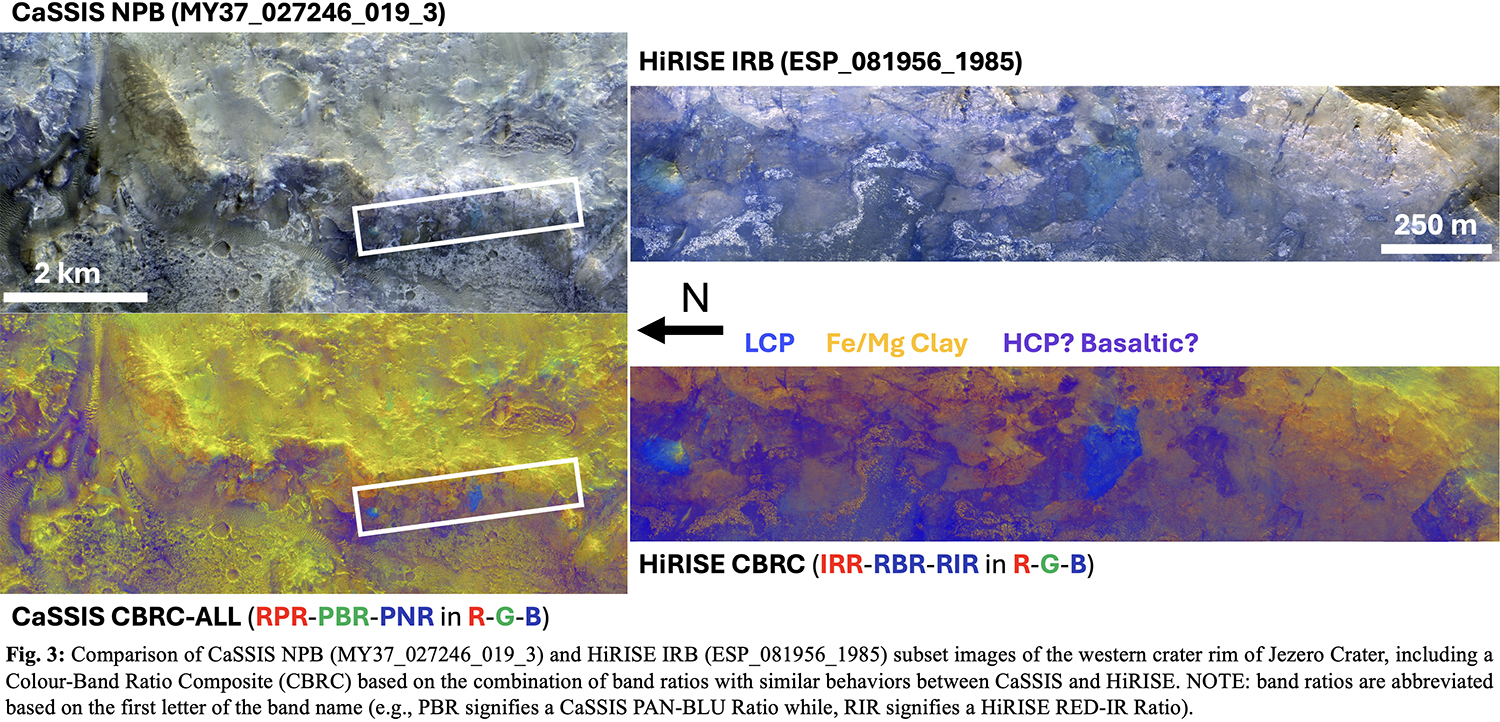
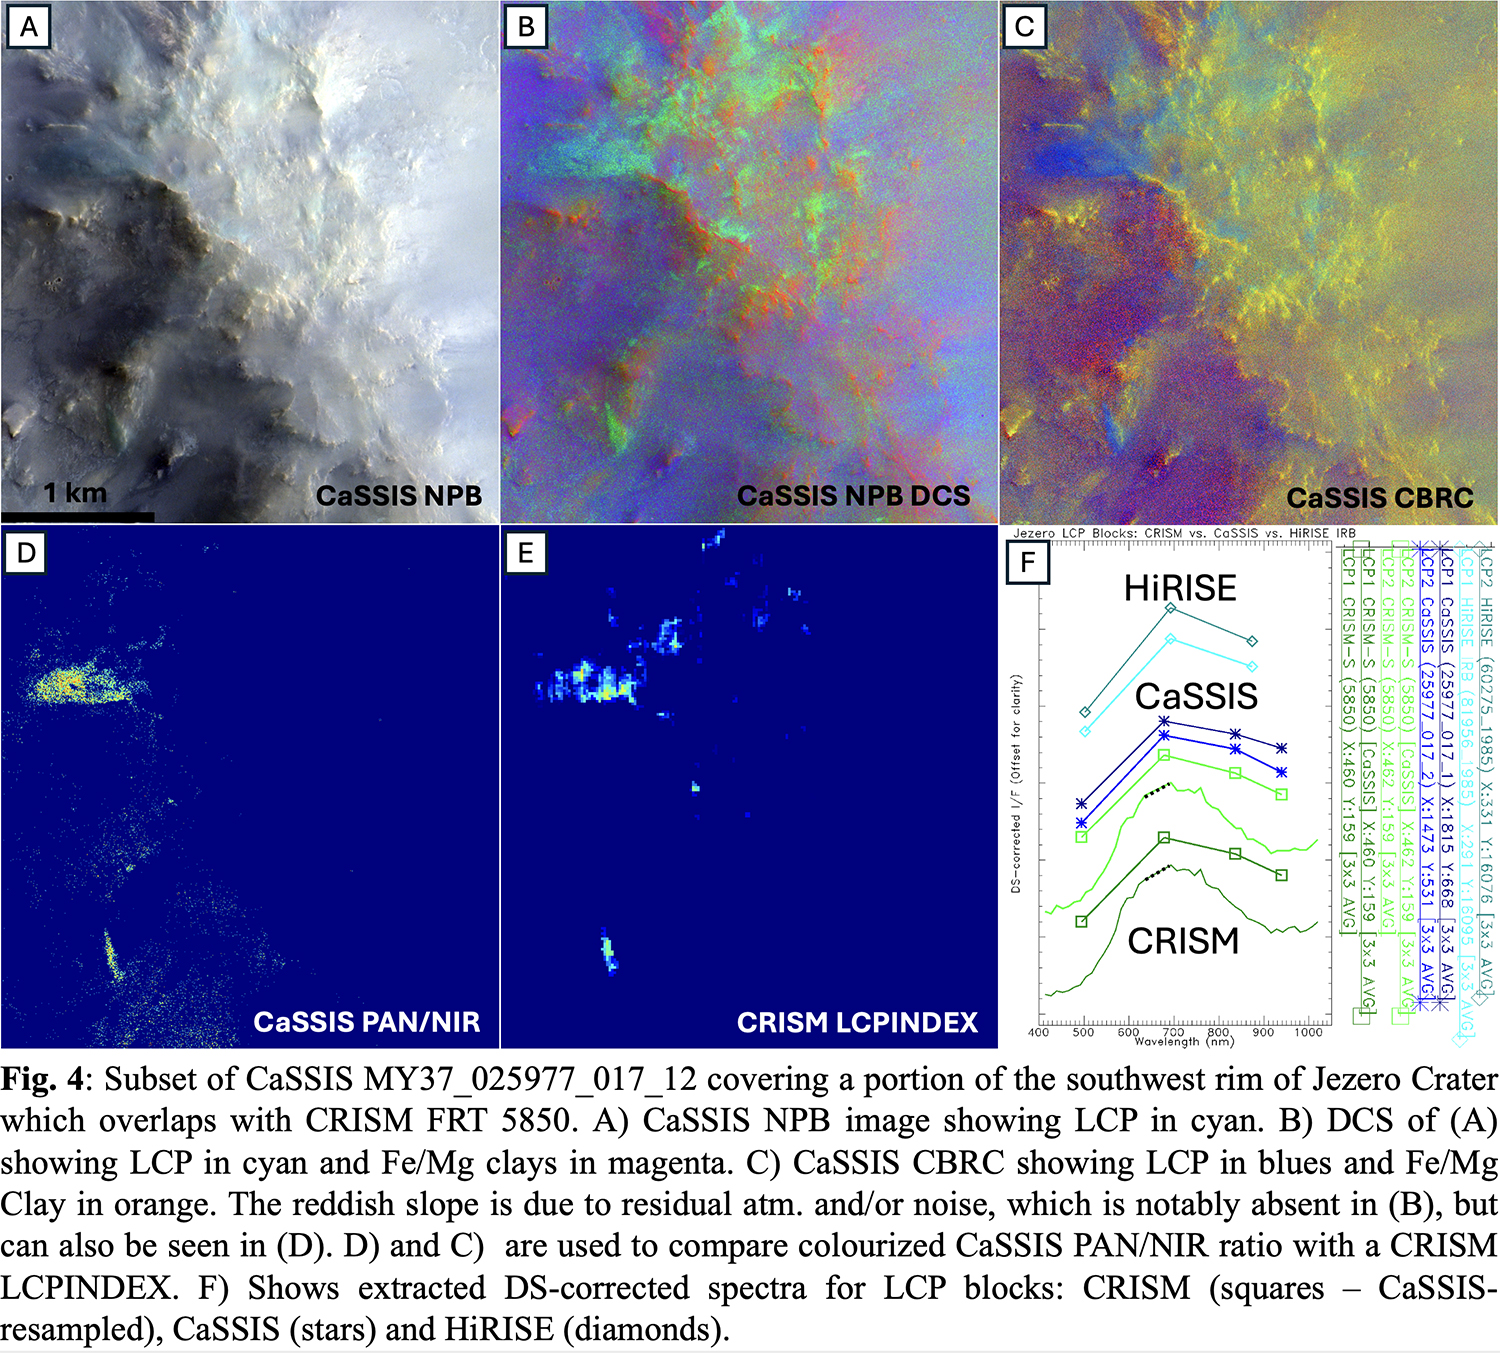
Here we focus on the diverse breccia clasts of the rim. Clasts are comprised of Fe/Mg smectite and LCP [11-13] but may also include HCP- or basaltic blocks and kaolinite. Kaolinite is characteristically pinkish in colour [7], which is identified at a few locations (Fig. 2). Fig. 3 shows linkages clasts of the western rim, while Fig. 4 focuses on the southwestern rim. LCP is a greenish cyan (Fig. 4a; c.f., Fig. 1), which is accentuated in DCS image (Fig. 4b) and corresponds to bluish colours in a CBRC image (Fig. 4c); both DCS and CBRC are more useful than a standard R-G-B due to the minimization of illumination effects. A CaSSIS PAN-NIR Ratio (PNR) effectively highlights LCP supported by how well it matches with the CRISM LCPINDEX (c.f., Fig. 4d & 4e). This is likely due to the ~900-1000 nm absorption for LCP falling well within the sensitivity range of CaSSIS. Lastly, DS-corrected spectra spanning all 3 datasets (Fig. 4f) show remarkable consistency, demonstrating the effectiveness of the correction to facilitate the co-analysis of these datasets.
CaSSIS characterization of hematite at Gale.
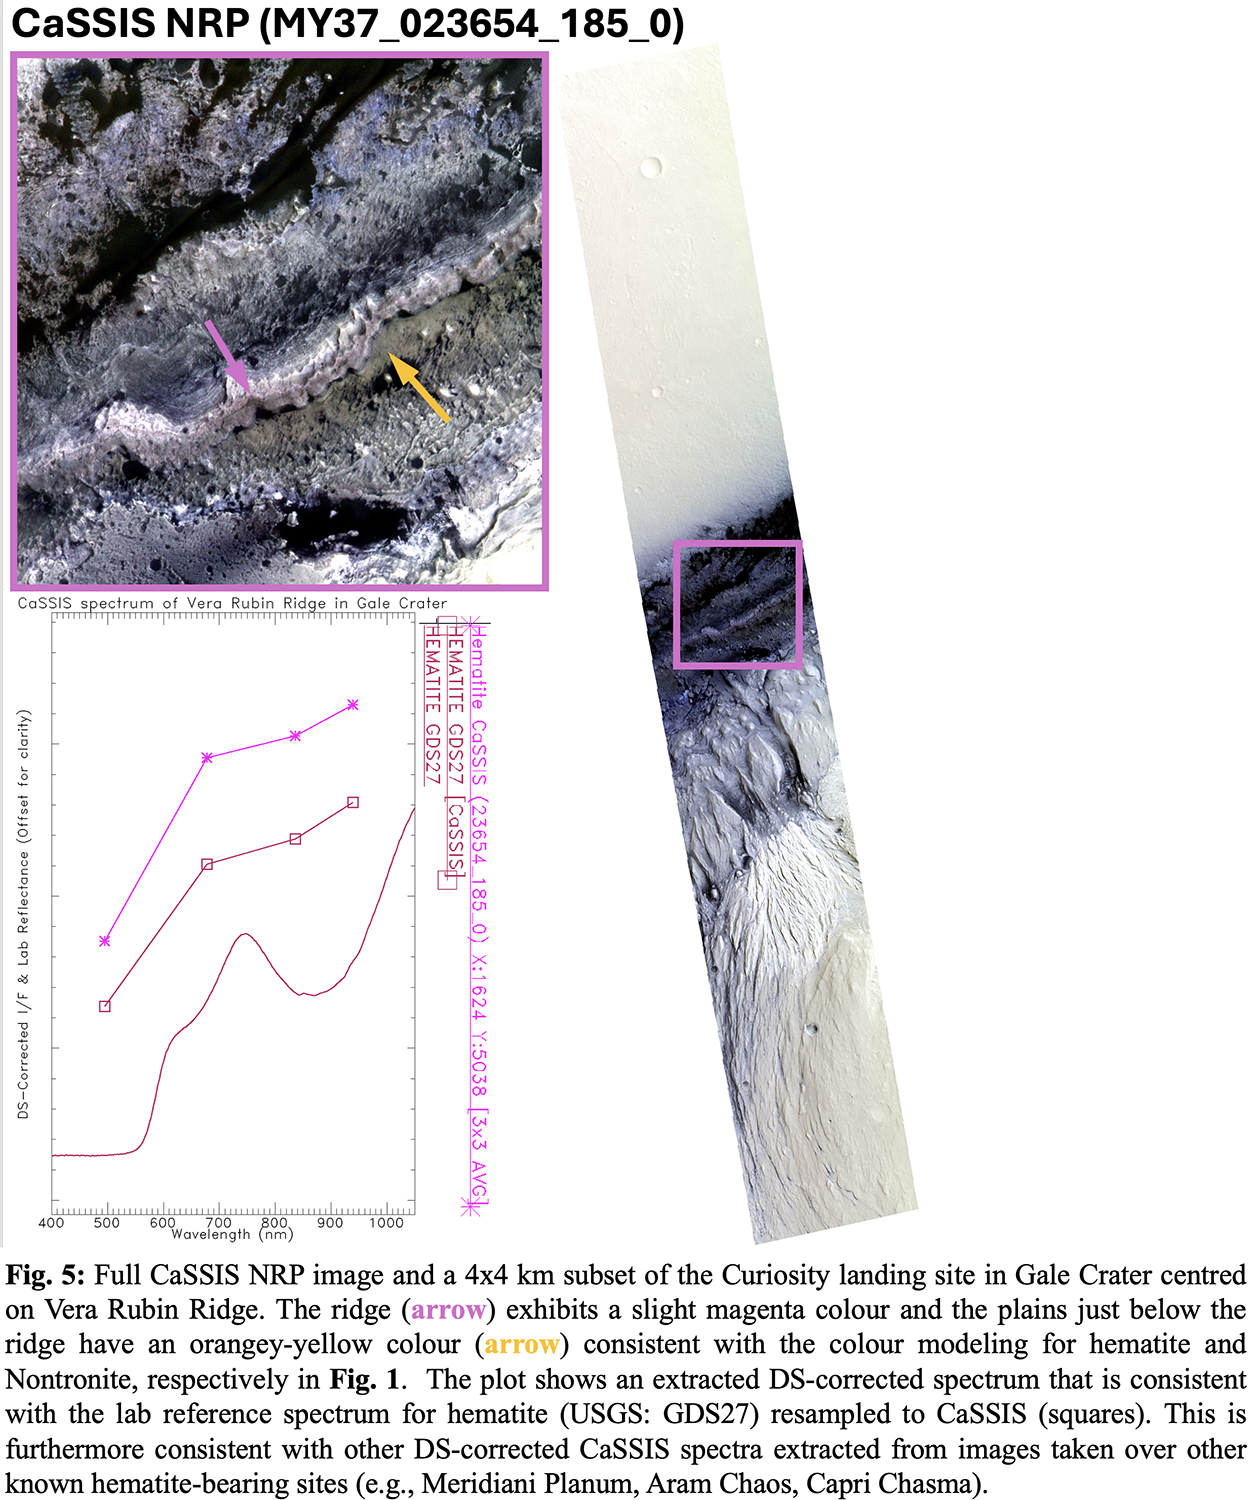
Hematite has a unique magenta colour in CaSSIS NRP images and a 4-point spectrum that makes it arguably identifiable with CaSSIS alone; the key is the “RED” IR-band (~836 nm) along with the PAN and NIR bands on either side, which just resolves the absorption around 850 nm (Fig. 5) [14]. Unfortunately, HiRISE does not possess this added spectral sensitivity. In addition to Gale [15-17] (Fig. 6), we have identified hematite at Meridiani Planum, Capri Chasma, and Aram Chaos with CaSSIS.
Clays and LCP in Oxia Planum.
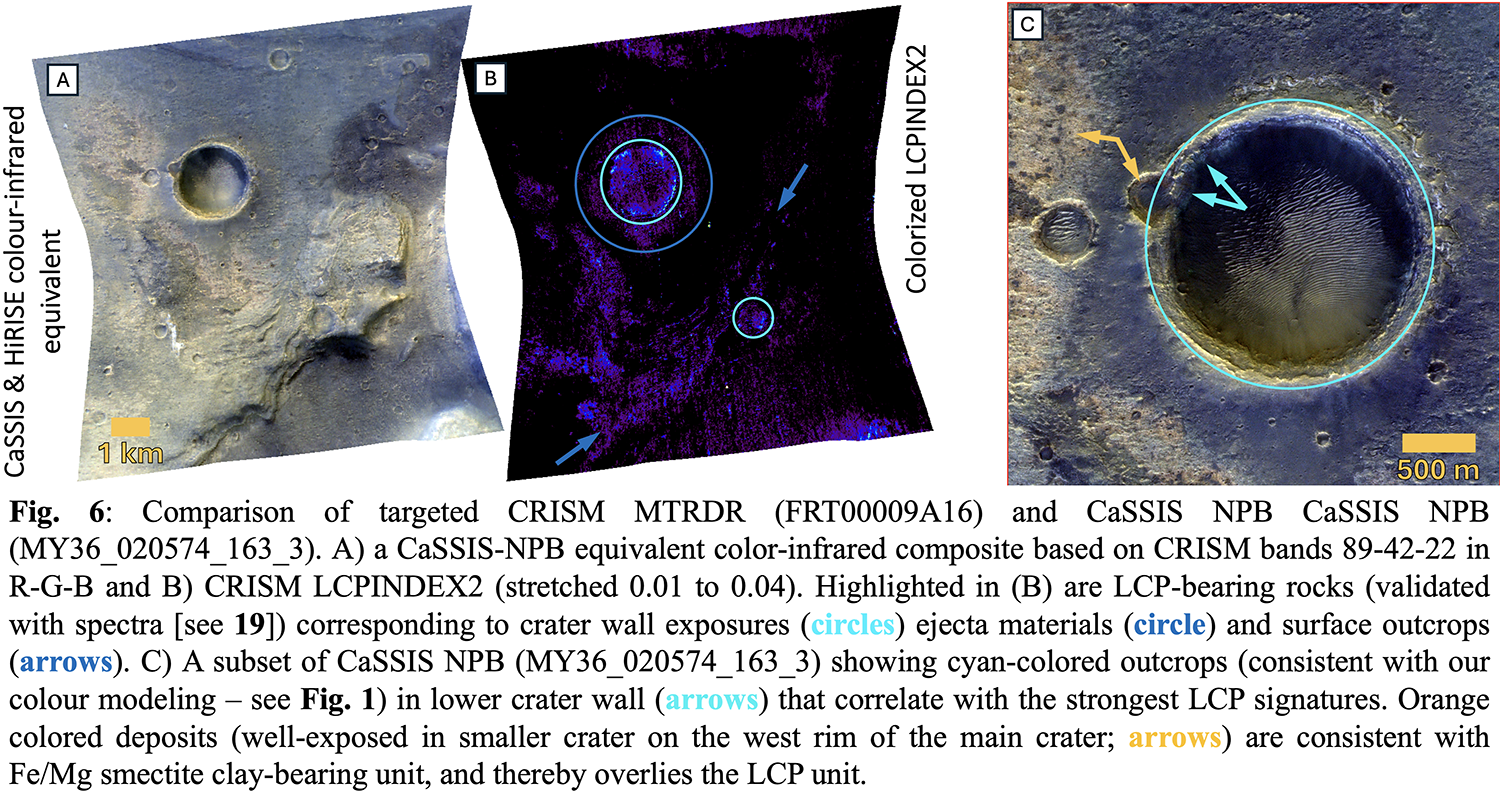
Compared to other landing sites, Oxia Planum lacks coverage of targeted CRISM cubes. CaSSIS is particularly well-suited to extend this paucity of information needed for landing site characterization and mapping [18]. Fe/Mg semctites have a characteristic orange colour and are distinct from the more yellowish ferric dust (Fig. 6). CaSSIS provides more coverage, including by the limited colour swath of HiRISE, and is well suited to mapping out both the orange and blue subunits of the clay. We also recently discovered LCP in Oxia [19] (Fig. 6), which we continue to explore with new data from CaSSIS and HiRISE. We are nearing completion on the first CaSSIS quantitative mosaic of the site to augment existing maps [e.g., 18] and be used as an effective tool for long-term planning and context.
References: [1] Thomas et al. (2017) Space Sci. Rev., 212, 1897. [2] McEwen et al. (2007) JGR Planet., 112 [3] Murchie et al. (2007) JGR Planet., 112. [4] Seelos, F. (2022) LPSC, 2361. [5] Tornabene et al. (2018) Space Sci. Rev., 214. [6] Tornabene et al. (2022), LPSC, 2330. [7] Tornabene et al. (2024) Space Sci. Rev., in prep. [8] Rangarajan et al. (2023a) Icarus, 115443. [9] Rangarajan et al. (2023b) Icarus, 115849. [10] Rangarajan et al. (2024) EPSC, this conference. [11] Mayhew et al. (2024) LPSC. [12] Scheller et al. (2024) LPSC. [13] Scheller and Ehlmann (2020) JGR Planet., 125. [14] Morris et al. (1985) JGR, 90. [15] Milliken et al. (2010) GRL, 37. [16] Fraeman et al. (2013) Geology, 41. [17] Fraeman et al. (2020) JGR-Planet., 125. [18] Fawdon et al. (2024) J. Maps., 20. [19] Tornabene et al. (2023) LPSC.
How to cite: Tornabene, L. L., Rangarajan, V., Osinski, G., Cremonese, G., Fawdon, P., Grindrod, P., Nobelt, A., Pajola, M., Piatek, J., Stabbins, R., and Thomas, N.: Utility of ExoMars-TGO/CaSSIS to facilitate co-analysis of CRISM and HiRISE for detailed characterization of the surface: Examples from active and future rover landing sites, Europlanet Science Congress 2024, Berlin, Germany, 8–13 Sep 2024, EPSC2024-1321, https://doi.org/10.5194/epsc2024-1321, 2024.