
Spatio-Temporal Detection, Aggregation and Tracking of Martian Large-Scale Dust Events
 1,2,3
1,2,3- 1Centre for Mars Meteorology Monitoring, Paneureka, Le Bourget-du-Lac, France
- 2Laboratoire de Météorologie Dynamique, IPSL/CNRS, Paris, France,
- 3Space Science Institute, Boulder, CO, USA.
Introduction: Martian dust storms play a crucial role in the red planet's climate and weather patterns, affecting both atmosphere and surface conditions over various time scales [1]. Orbital data help track these storms, which pose challenges for spacecraft operations and energy production [2], [3], [4] and [5]. Although monitoring is precursor, accurate forecasting is essential for future Mars exploration [6]. Supervised machine learning (SML) has already been used for automatic detection of Martian dust storms from visible images [7], [8]. However, we are not aware of SML and/or unsupervised machine learning (UML) being utilized for this application with other data sources.
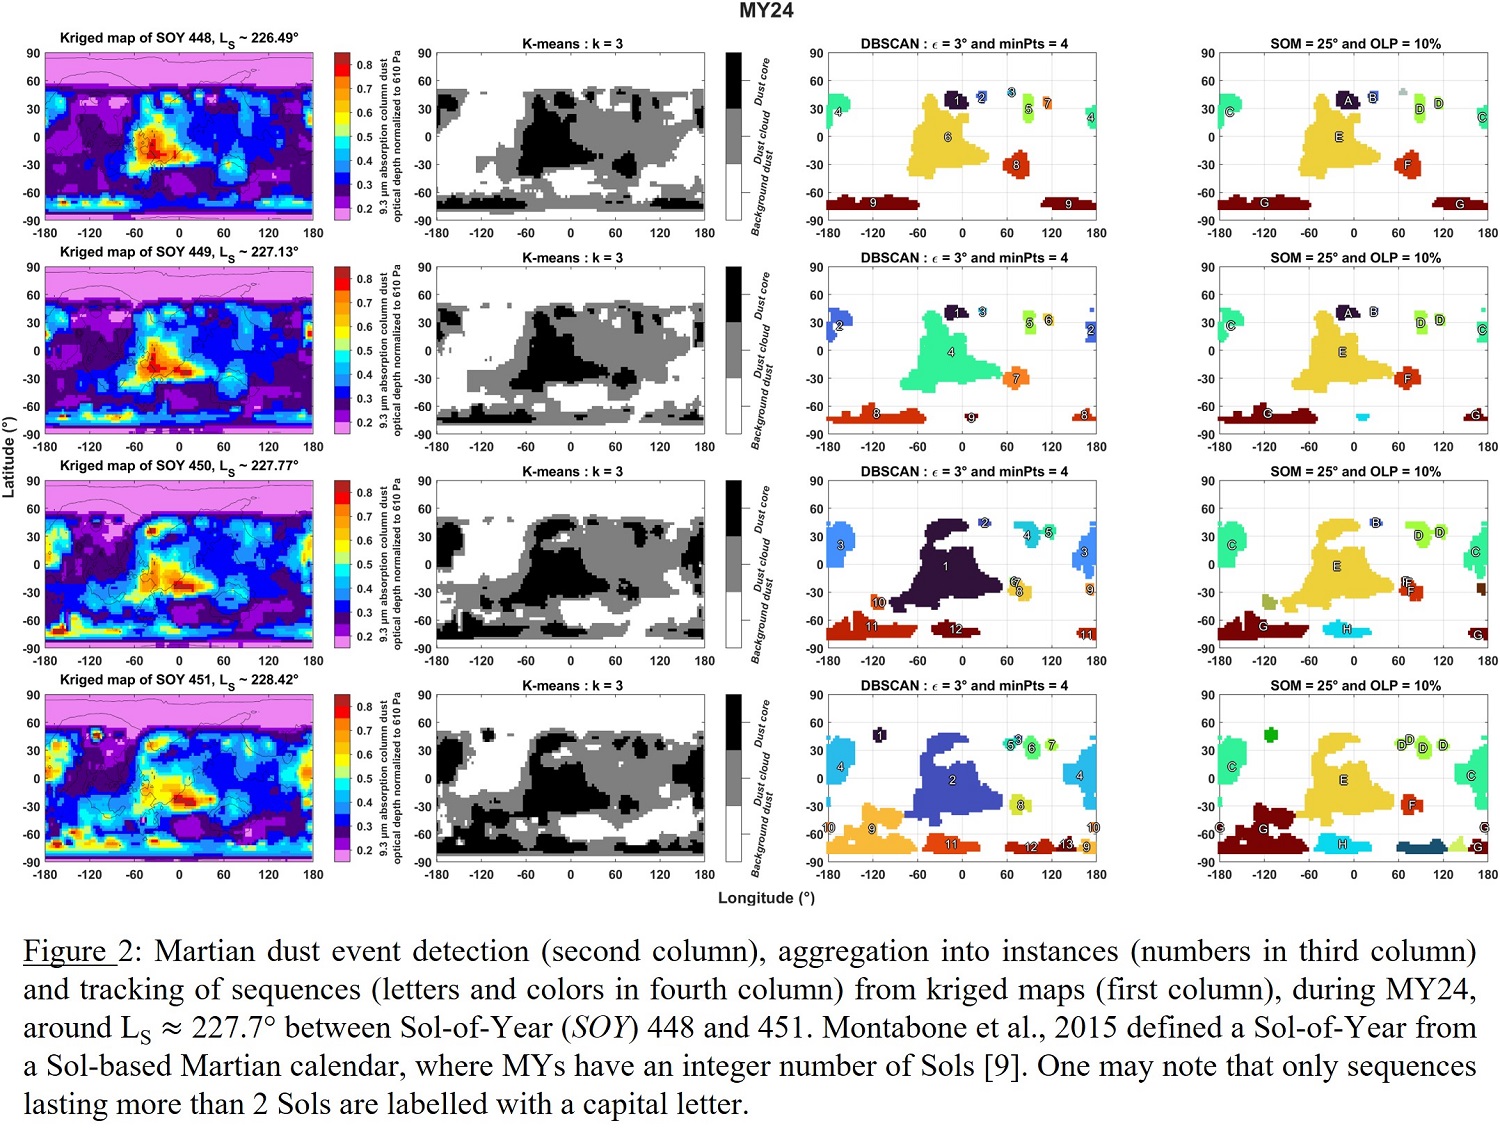
Data: Montabone et al. (2015) have already identified a certain degree of interannual repeatability of large-scale dust storms from zonal mean of column dust optical depth normalized to the reference 610 Pa pressure level (CDOD@610) [9]. A novel approach relying exclusively on UML (see Figure 1) has been developed to detect, aggregate and track Martian large-scale dust events both in space and time (ST-DATMADE), from the publicly-available, multiannual (from Martian Year (MY) 24 to 36) CDOD@610 dataset described in Montabone et al. (2015, 2020) [9], [10]. Large-scale dust events are characterized by surface areas ≥1.6×10⁶ km2 and last more than two Martian days [2]. Normalized CDOD is used to remove topographic features (plains, volcanoes etc.) which affect the distribution of dust within the column. The dataset contains gridded observation maps and kriged maps from CDOD satellite retrievals. Being spatially interpolated, regularly kriged maps (see Figure 2, 1st column) are more relevant to use for SML application compared to irregularly gridded maps.
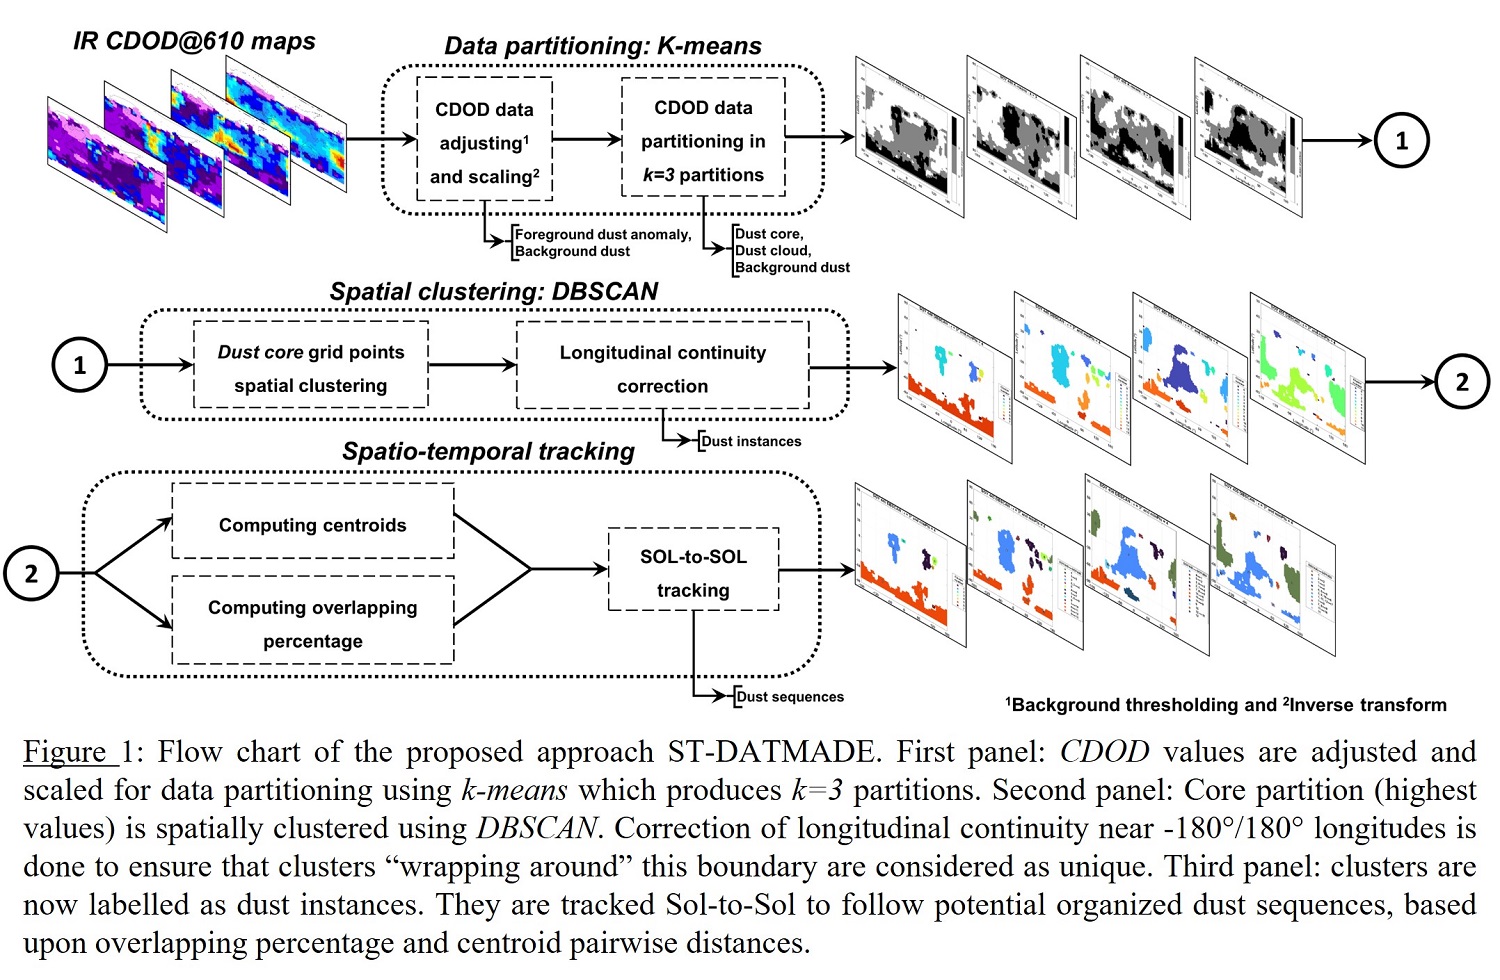
Detection: Detection of dust events involves the identification of spatio-temporal anomalies in CDOD maps. A dust event is defined as a temporal series of dust episodes characterized by foreground dust anomalies. A foreground dust anomaly refers to a significant increase in CDOD observed during a given Sol (Martian day), regardless of spatial dimension, relative to the background dust level. Background dust refers to the typical or baseline level of diffused dust present in the Martian atmosphere. Therefore, to facilitate the recognition of these anomalies, a “background/foreground” segmentation is initially performed to enhance subsequent data partitioning (see Figure 1). The CDOD data distribution is adjusted by mapping the lowest data associated with background dust into a threshold value, , calculated as follows:

The low dust loading season (LDLS) is a multiannual period between LS (Solar Longitude) = 10° and LS = 140° where there is almost no large-scale dust injection [11]. Here, the LDLS background, , is defined as the 95th percentile () of CDOD during LDLS between MY24 and MY36. It represents the multi-annual atmospheric background during the “clear” season. Additionally, the daily background, , is defined as the 33rd percentile () of CDOD at a given Sol and MY. It considers that the background dust may evolve as dust events may increase the surrounding dust opacity.
Furthermore, the adjusted dataset distribution is extremely and positively skewed, in such case an inverse transform may help to reduce the skewness, making the distribution more symmetrical and evenly distributed, particularly when addressing extreme dust events, [12]. This brings extreme values closer to average values. Within an episode of foreground dust anomaly, distinct features are identified as dust core and dust cloud. A dust core is a value-based partition where atmospheric dust injection is likely. A dust cloud is a value-based partition where atmospheric dust diffusion is likely. Grouping between background dust, dust cloud and dust core is realized through CDOD values partitioning in k=3 partitions using a widely-known UML algorithm: k-means [13]. See Figure 1 and Figure 2, 2nd column.
Aggregation: Density-Based Spatial Clustering of Applications with Noise (DBSCAN) algorithm ([14]) is used for spatial clustering of the partition with the highest CDOD values (i.e. dust core). A dust instance is an individual, isolated spatial-based cluster within the dust core partition, produced by DBSCAN (see Figure 1 and Figure 2, 3rd column).
Tracking: A series of space-coherent and time-continuous dust instances is organized into a dust sequence. To track instances from one Sol to another (Sol-to-Sol) the pairwise centroid distances of consecutive Sols is compared to a “sphere of membership” (SOM). As well as the percentage of overlapping (OLP) of instances from consecutive Sols. Thereby, it is possible to track dust event instances Sol-to-Sol and to deduce whether they form sequences (see Figure 1 and Figure 2, 4th column).
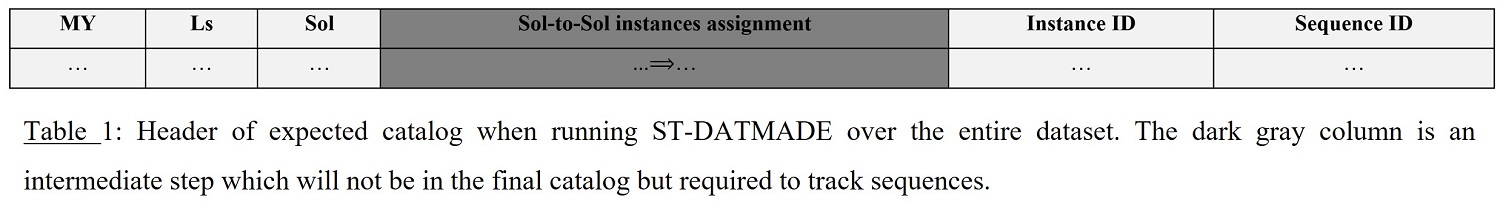
Catalog: Previous section of tracking provides Sol-to-Sol cluster assignments (instances organized in sequences) allowing to build a catalog of dust event instances tagged with an “id” with format: MY.._Sol_..._1,2,3 etc. Space-consistent and time-continuous instances are labelled with a sequence “id” as: MY.._A,B,C, etc. (see Table 1).
Statistics: This catalog will allow a comprehensive analysis of large-scale dust events based on CDOD data. In particular, their spatio-temporal distribution through trajectories, region of origination, LS of origination etc. as well as intensity distribution through area and CDOD statistical features (mean, median etc.).
Acknowledgments: The authors would like to acknowledge the use of the publicly available dataset on the LMD webpage: http://www-mars.lmd.jussieu.fr/mars/dust_climatology/index.html and the NASA PDS webpage:
https://pdsatmospheres.nmsu.edu/data_and_services/atmospheres_data/MARS/montabone.html.
References:
[1] L. Montabone and F. Forget, 2018, http://hdl.handle.net/2346/74226
[2] B. A. Cantor et al., 2001, https://doi.org/10.1029/2000JE001310
[3] H. Wang and M. I. Richardson, 2015, https://doi.org/10.1016/j.icarus.2013.10.033
[4] M. Battalio and H. Wang, 2021, https://doi.org/10.1016/j.icarus.2020.114059
[5] C. Gebhardt et al., 2022,
https://www-mars.lmd.jussieu.fr/paris2022/abstracts/poster_Gebhardt_Claus.pdf
[6] L. Montabone et al., 2022,
https://www-mars.lmd.jussieu.fr/paris2022/abstracts/oral_Montabone_Luca.pdf
[7] R. Alshehhi and C. Gebhardt, 2022, https://doi.org/10.1186/s40645-021-00464-1
[8] K. Ogohara and R. Gichu, 2022, https://doi.org/10.1016/j.cageo.2022.105043
[9] L. Montabone et al., 2015, https://doi.org/10.1016/j.icarus.2014.12.034
[10] L. Montabone et al., 2020, https://doi.org/10.1029/2019JE006111
[11] F. Forget and L. Montabone, 2017, http://hdl.handle.net/2346/72982
[12] B. G. Tabachnick and L. S. Fidell, Using Multivariate Statistics. Pearson Education, 2013.
[13] S. Lloyd, 1982, https://doi.org/10.1109/TIT.1982.1056489
[14] M. Ester et al., 1996, https://www2.cs.uh.edu/~ceick/7363/Papers/dbscan.pdf
How to cite: Lombard, T. and Montabone, L.: Spatio-Temporal Detection, Aggregation and Tracking of Martian Large-Scale Dust Events, Europlanet Science Congress 2024, Berlin, Germany, 8–13 Sep 2024, EPSC2024-1334, https://doi.org/10.5194/epsc2024-1334, 2024.