- The Open University, School of Physical Sciences, United Kingdom of Great Britain – England, Scotland, Wales (maureen.cohen@open.ac.uk)
Optically thick cloud decks shroud the deep atmosphere of Venus from the view of most observing instruments. Limited nightside spectral windows, however, have allowed detection of trace gas species like carbon monoxide (CO) and sulphur dioxide (SO2). The distribution of these species offers clues to the general circulation below the clouds. CO is formed above the clouds by photolysis of CO2 and reaches the deep atmosphere through downwelling at high latitudes associated with a cloud deck Hadley-like cell. SO2, on the other hand, is believed to originate from the surface, potentially from volcanic processes, and varies in abundance above the cloud deck on both short-term and long-term timescales due to a combination of photochemical and dynamical processes.
Using the Venus Planetary Climate Model (VPCM), a 3-D global climate model of Venus, we performed two age of air simulations to study how the surface, deep atmosphere, cloud decks, and upper atmosphere are connected by dynamical transport processes. In the experiments, a source region was initialised with a passive tracer whose abundance increased linearly with simulation time. The VPCM’s tracer routines transported the tracer from the source region around the model atmosphere. We then used the tracer abundance in each model gridbox to calculate the time since the air in that gridbox was last in the source region, a quantity known as the “mean age of air.” In one experiment (Surface), the tracer source region was the planetary surface, and in the second (Cloud Deck), the source region was the model level just beneath the lowest cloud deck.

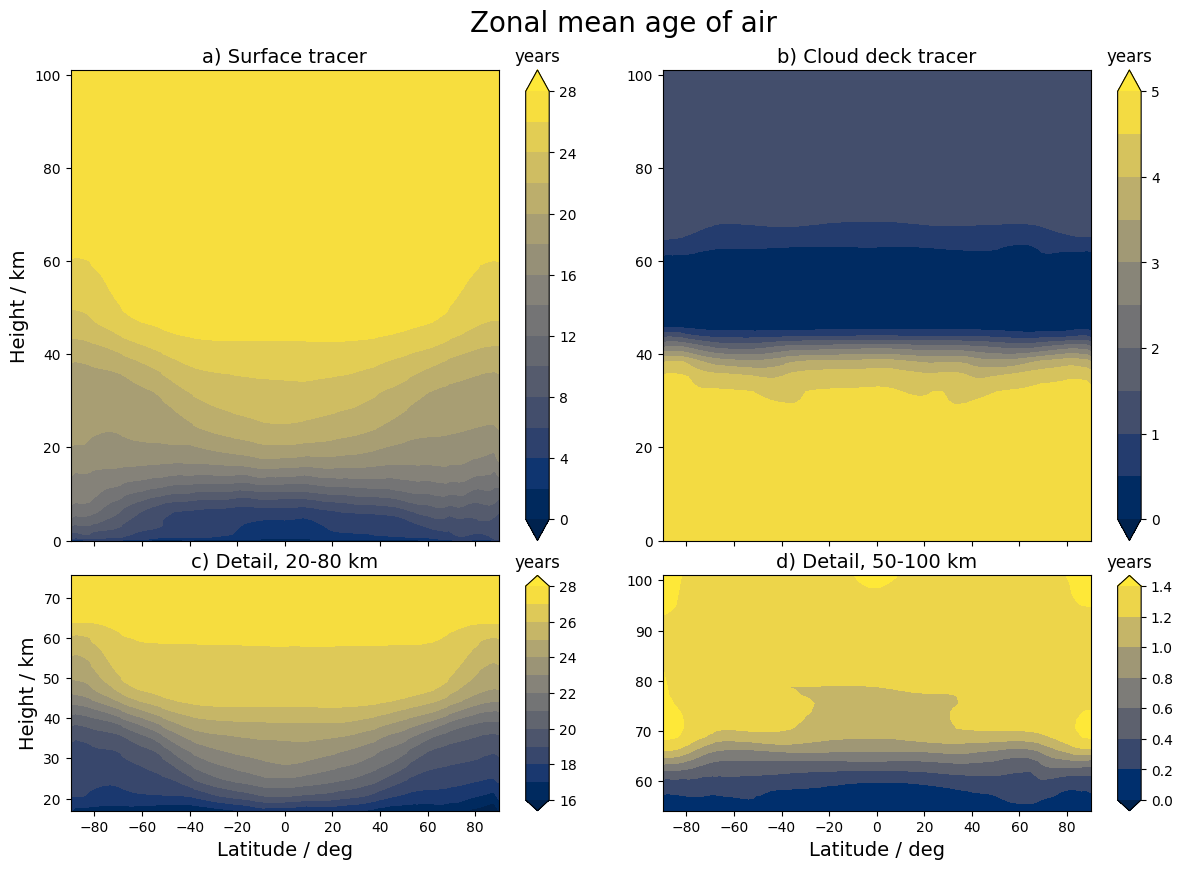
Figure 1: Zonal mean age of air for the Surface and Cloud Deck tracer experiments.
In the Surface experiment, air took around 25 Earth years to reach the region below the cloud decks, while in the Cloud Deck experiment, it took 1.5 Earth years to reach the upper atmosphere above the clouds. To put these timescales in context, we define the troposphere-to-stratosphere turnover ratio, a ratio of the transport time through the troposphere to the transport time through the stratosphere, for Venus in comparison to Earth and Mars:
|
Planet |
Venus |
Earth |
Mars |
|
Turnover ratio (equator) |
0.06 |
14.5 |
1 |
|
Turnover ratio (poles) |
0.075 |
21.9 |
0.5 (seasonal) |
|
Source |
Our work |
Krol et al. (2018) [1] |
Waugh et al. (2019) [2] |
While on Earth, air moves through the troposphere much more quickly than through the stratosphere, this is reversed for Venus, where the upper atmosphere sees much faster turnover. However, we also found a latitudinal gradient in the age of air which varies with altitude, with significantly younger air in polar regions at altitudes from 25-60 km, and older air at the poles both below and above this altitude range.

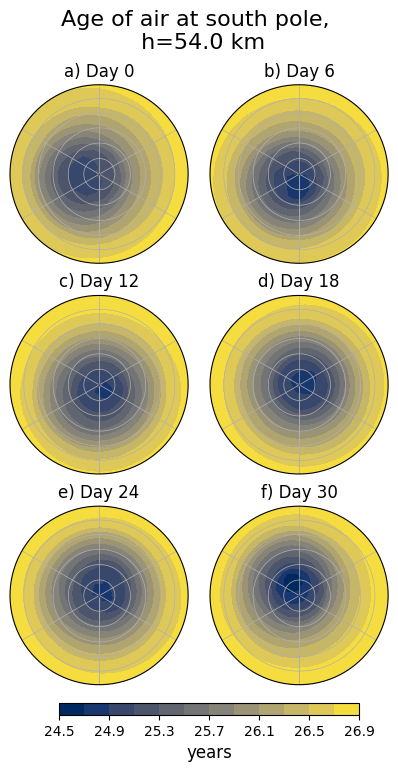
Figure 2: Six snapshots of the age of air in the Surface simulation at the south pole. The outermost circle is 60° and each radial gridline represents 5°.
To explain this latitudinal gradient, we investigated the circulation between 25-60 km and found that this region of the deep atmosphere generates planetary-scale Rossby waves with a zonal wave number of one. These waves are characterised by a pair of high-latitude cyclonic/anticyclonic structures or gyres in each hemisphere which collect the age of air tracers, leading to a younger age of air near the poles. The waves propagate around the planet with a period of 36 Earth days, as can be seen from the change in longitudinal location of the age of air minimum in Figure 2.
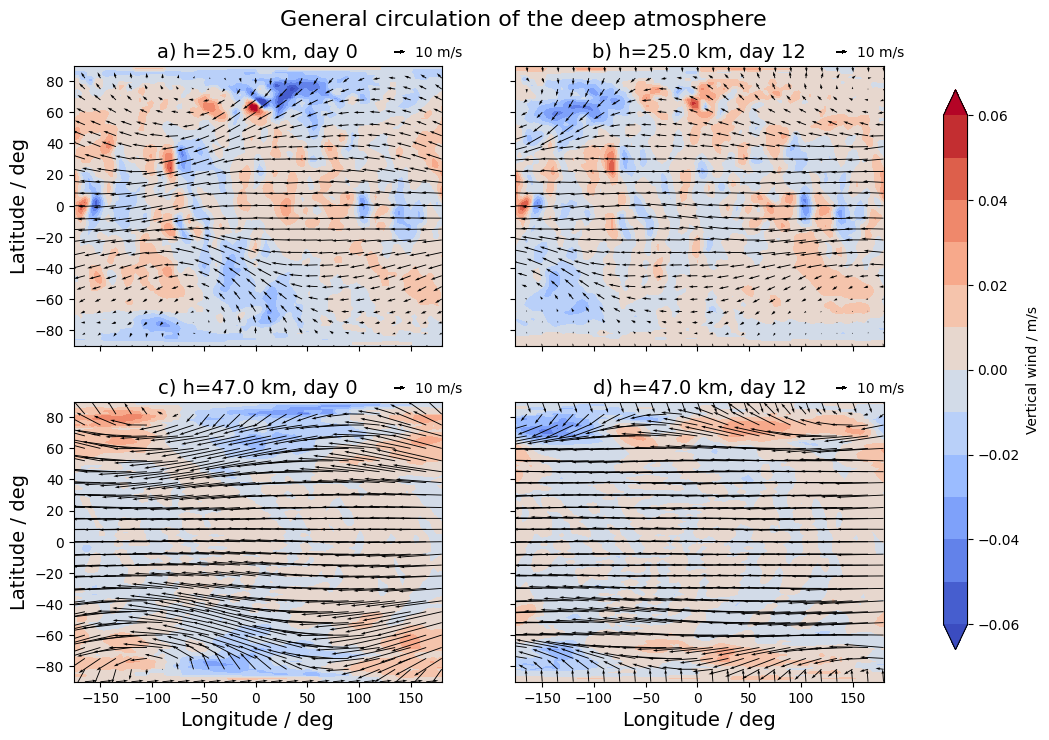
Figure 3 shows the general circulation at two altitudes within the wave region. Fig. 3a) contains large gyres in the top and bottom left of the panel with an area of upwelling at their western edges. The gyres are less evident in Fig. 3c) because they have become confined to very high latitudes as the superrotating equatorial jet comes to dominate most of the planet. However, time series analysis of the vertical wind at the gyre latitudes found that the waves continue to exist at these altitudes and remain in phase throughout the 25-60 km altitude range.
Traveling high-latitude Rossby waves could be a source of the observed variability in the trace gas distributions below the cloud deck and contribute to the complex, as yet poorly understood dynamics of the Venusian polar regions. The predicted existence of these waves could be tested by long-term or appropriately timed observations of the trace gas species near one or both poles to determine if there is a regular periodic variation in abundance.

Figure 3: Horizonal and vertical wind in the deep atmosphere at 25 km and 47 km altitude, 12 days apart.
References:
[1] Krol, M., de Bruine, M., Killaars, L., Ouwersloot, H., Pozzer, A., Yin, Y., Chevallier, F., Bousquet, P., Patra, P., Belikov, D., Maksyutov, S., Dhomse, S., Feng, W., and Chipperfield, M. P.: Age of air as a diagnostic for transport timescales in global models, Geosci. Model Dev., 11, 3109–3130, https://doi.org/10.5194/gmd-11-3109-2018, 2018.
[2] Waugh, D.W., Toigi, A.D., Guzewich, S.D.: Age of martian air: timescales for martian atmospheric transport, Icarus, 317, 148-157, https://doi.org/10.1016/j.icarus.2018.08.002
How to cite: Cohen, M., Holmes, J., Patel, M., and Lewis, S.: Planetary-scale waves in the Venus deep atmosphere cause variability in tracer distribution, Europlanet Science Congress 2024, Berlin, Germany, 8–13 Sep 2024, EPSC2024-165, https://doi.org/10.5194/epsc2024-165, 2024.