Measuring Schumann Resonances on Titan: Constraints on the internal ocean from PWA/Huygens and future EFIELD/Dragonfly observations
- LATMOS/IPSL, UVSQ Université Paris-Saclay, Sorbonne Université, CNRS, Guyancourt, France
I.Introduction
Several lines of evidence suggest the presence of an internal global ocean on Titan [1, 2]. Among them, is the detection of a Schumann-like resonance (SR) by the Permittivity, Wave and Altimetry (PWA) analyzer on board the Huygens’ probe [3]. SR are a set of extremely low frequency electromagnetic propagation modes in a planetary cavity [4]. On Earth these modes are generated by lightning discharges and propagating between the Earth’s surface and the ionosphere. Theoretically, SR could be observed on other planets and therefore, can be used as a tool to obtain information on the various planetary cavities [5]. On Titan, the electric signal observed at 36 Hz by PWA was interpreted to be the result of Saturn’s magnetosphere exciting Titan’s SR, with the ionized atmospheric layer (60–70 km altitude) serving as the top of the resonant cavity and a subsurface layer (40–80 km depth), presumably salty liquid water, as thelower boundary. While this detection is still subject to debate [6], the next mission to Titan, Dragonfly (NASA), will embark an electrical-field sensor, EFIELD/DraGMet, able to detect at least three harmonics of SR, if any [7]. Such detection would place new and more robust constraints on the buried ocean (in particular on its depth) and would therefore be key to better assess Titan’s habitability.
This work first describes the numerical computations for SR using surrogate modelling as a tool to accurately approximate the behaviour of the cavity [8]. Using this numerical model, the Huygens PWA data acquired in 2005 can be re-evaluated [3] with a cheap computation cost. Finally, a recently published conductivity model for Titan’s atmosphere is introduced in the numerical model in order to assess the potential of the EFIELD experiment to provide better constraints on the thickness of the ice crust.
II. Modelling Titan’s planetary cavity
Developing an accurate numerical model of Titan’s electromagnetic cavity is crucial to both better understand the measurements from the Cassini-Huygens mission, and prepare the future measurements from the Dragonfly mission. Therefore, the goal has been to develop a numerical model able to reproduce the behavior of Titan’s cavity in order to compute various resonant frequencies with their corresponding quality factors. The following cavity parameters have been considered for the various parametric analysis:
-
the thickness of the ice crust zc
-
the real part of the ice crust permittivity εc
-
the electrical conductivity of the ice crust σc
The considered outputs for the numerical model are the first three modes of the resonant cavity (f1, f2, f3) along with their corresponding quality factors (Q1, Q2, Q3). Thanks to the analysis made in [9], sufficient knowledge of εc = 2.5 ± 0.3 and σc = 1.2 ± 0.6 nS/m from both measurements and laboratory experiments can help in constraining zc.
The behaviour of Titan’s planetary cavity can be simulated using the finite element method with COMSOL Multiphysics®. In order to perform an accurate parametric inversion on zc, many datapoints are needed which is impossible by direct computation of the numerical model. Therefore, the computation can be simplified using a 2D axi-symmetric model combined with a metamodel, which is an analytical function used instead of the direct model to save computation time [8][10].

III. Re-evaluation of Huygens measurements
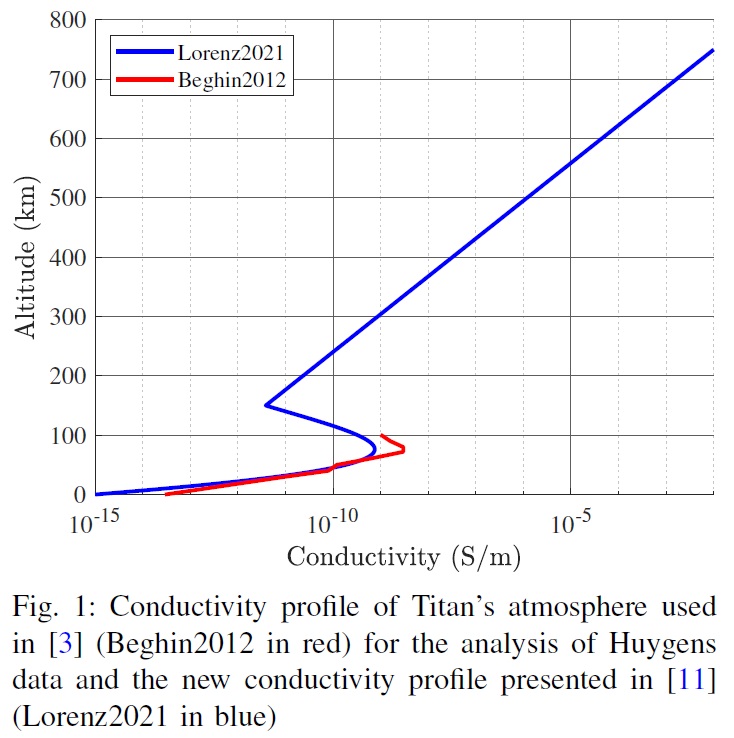
In the latest analysis of Huygens measurements [3], the probe supposedly measured the second harmonic of SR: f2 = 36 ± 3 Hz and Q2 = 6 ± 3 Hz. Given the conductivity profile in red on figure 1, the analysis lead to a rather large constraint: zc ∈ [40 − 80] km. In order to evaluate this analysis, the following ranges have been considered:
-
zc ∈ [5 − 200] km
-
εc ∈ [2 − 4]
-
σc ∈ [0.5 − 4] nS/m
The results of the inversion to constrain zc are displayed on figure 2. It appears that, given the 3 Hz resolution, the possible range is larger than expected: zc ∈ [15 − 195] km. This also emphasizes the need of deeper constraints on the other parameters εc and σc which could greatly narrow the possibilities. Moreover, a recently published conductivity profile ([11] displayed in blue on figure 1) could also provide better constraints on zc.
IV. Possible performances of the EFIELD experiment
Thanks to the technological advance in instrumentation since 2005, the frequency resolution could be reduced to 1 Hz for the EFIELD experiment. The orange area on figure 2 represents what could have been Huygens inversion with a 1 Hz resolution. This results could have given a much smaller range: zc ∈ [165 − 195] km. Moreover, the EFIELD experiment inversion could measure frequencies up to 100 Hz, which opens the possibility of measuring the first three modes of SR. The cavity can be simulated in the following ranges with the newly developed conductivity profile from [11]:
-
zc ∈ [5 − 90] km
-
εc ∈ [2.2 − 2.8]
-
σc ∈ [0.6 − 1.8] nS/m
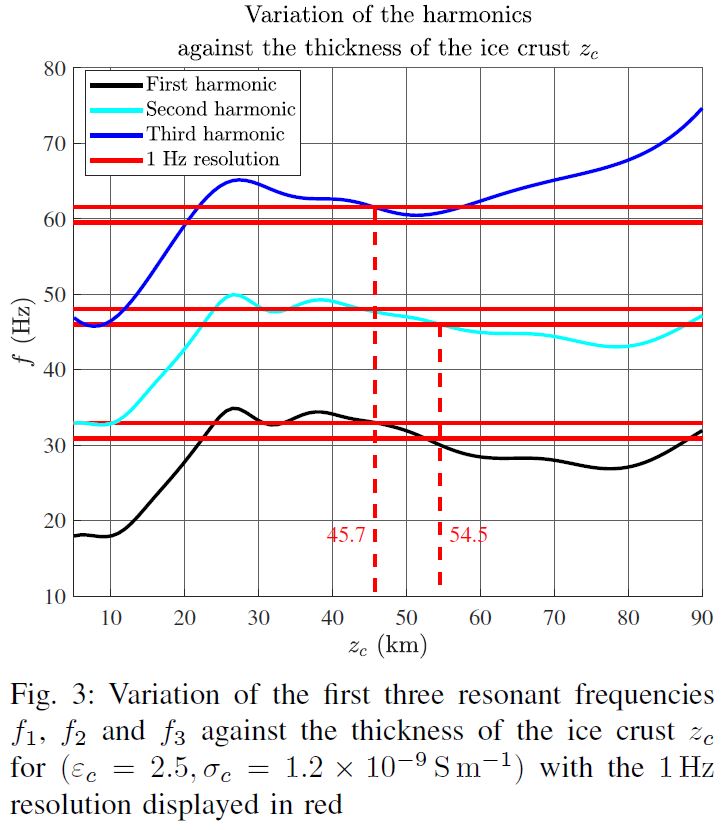
Let us assume Titan’s cavity with the following parameter values: (zc = 50 km, εc = 2.5, σc = 1.2 nS/m). The possible ranges for all three modes corresponding to the 1 Hz resolution of the EFIELD probe can be computed as displayed on figure 3.

By intersecting the possible intervals for the three harmonics, zc can be constrained in the range [45.7, 54.5] km. This example shows a possible uncertainty of 8.8% at the estimation of zc using the first three modes, which could be a great improvement from Huygens.

How to cite: Lagouanelle, P. and Le Gall, A.: Measuring Schumann Resonances on Titan: Constraints on the internal ocean from PWA/Huygens and future EFIELD/Dragonfly observations, Europlanet Science Congress 2024, Berlin, Germany, 8–13 Sep 2024, EPSC2024-186, https://doi.org/10.5194/epsc2024-186, 2024.