
Modelling Martian Moons' Surface Temperature
 ,,
,,- LESIA, Observatoire de Paris/PSL, Meudon, France (robin.sultana@obspm.fr)
Introduction
The two martian moons, Phobos and Deimos, will be visited by the sample return JAXA mission MMX in 2027 (launch planned in October 2026). They orbits Mars at respectively 9400 and Deimos at 23000km, with low inclinations and eccentricities. Their heavily processed surfaces harbour a fine regolith [1]. Visible and Near-Infrared (Vis-NIR) spectral readings reveal dark and red flat spectra[2,3]. These characteristics have spawned competing hypotheses regarding their formation:
- They could be remnants of D-type asteroids, captured by Mars[3].
- They may have formed from the aftermath of an impact between Mars and a protoplanet[4].
While the former hypothesis aligns with spectral similarities observed in D-type asteroids, it fails in explaining the moons' peculiar orbits. Conversely, the latter resolves the orbital puzzle but fails in elucidating their spectral characteristics.
To unravel the origins of Phobos and Deimos, the Martian Moons Explorer (MMX) mission[5] aims to scrutinise the moons' compositions. The MMX Infrared Spectrometer (MIRS) will observe the two moons in the range of 0.9 to 3.6µm[6]. However, at a distance of 1.5AU, the moons' surfaces emit a significant thermal flux, especially beyond 2µm, necessitating correction in spectral measurements.
We present a model adapted from previous works[7] to characterise the thermal behaviour of the Martian moons in preparation of MIRS data interpretation. From their properties—such as albedo, inertia, and thermal conductivity—alongside the incoming flux, we aim to compute their surface temperatures accurately, aiding in the interpretation of MIRS spectral observations.
Illumination at the moons’ surface
Given the absence of an atmosphere and the moons small size, their surface temperatures are dictated by the absorbed flux. Consequently, the initial step in computing their physical surface temperatures involves discerning the incident flux.
We developed a model that computes the flux reaching the surface of the moons over one orbit around the Sun. The model relies on the SPICE/NAIF toolkit to computes the distance and the viewing incidence and reflection angles at the moons surfaces. It takes into account for the eclipses when Phobos or Deimos enters Mars' shadow cone, and for the reflected and emitted light on Mars in the Vis-NIR.
Additionally, our model incorporates the shape model provided by[8] to compute illumination angles on the moons' surfaces. Furthermore, it utilizes the Mars albedo map from[9].
In the model, the incidence flux at a specific point of the surface hence varies over a year with:
-solar distance,
-eclipses,
-moon orientation,
-Mars thermal emission.
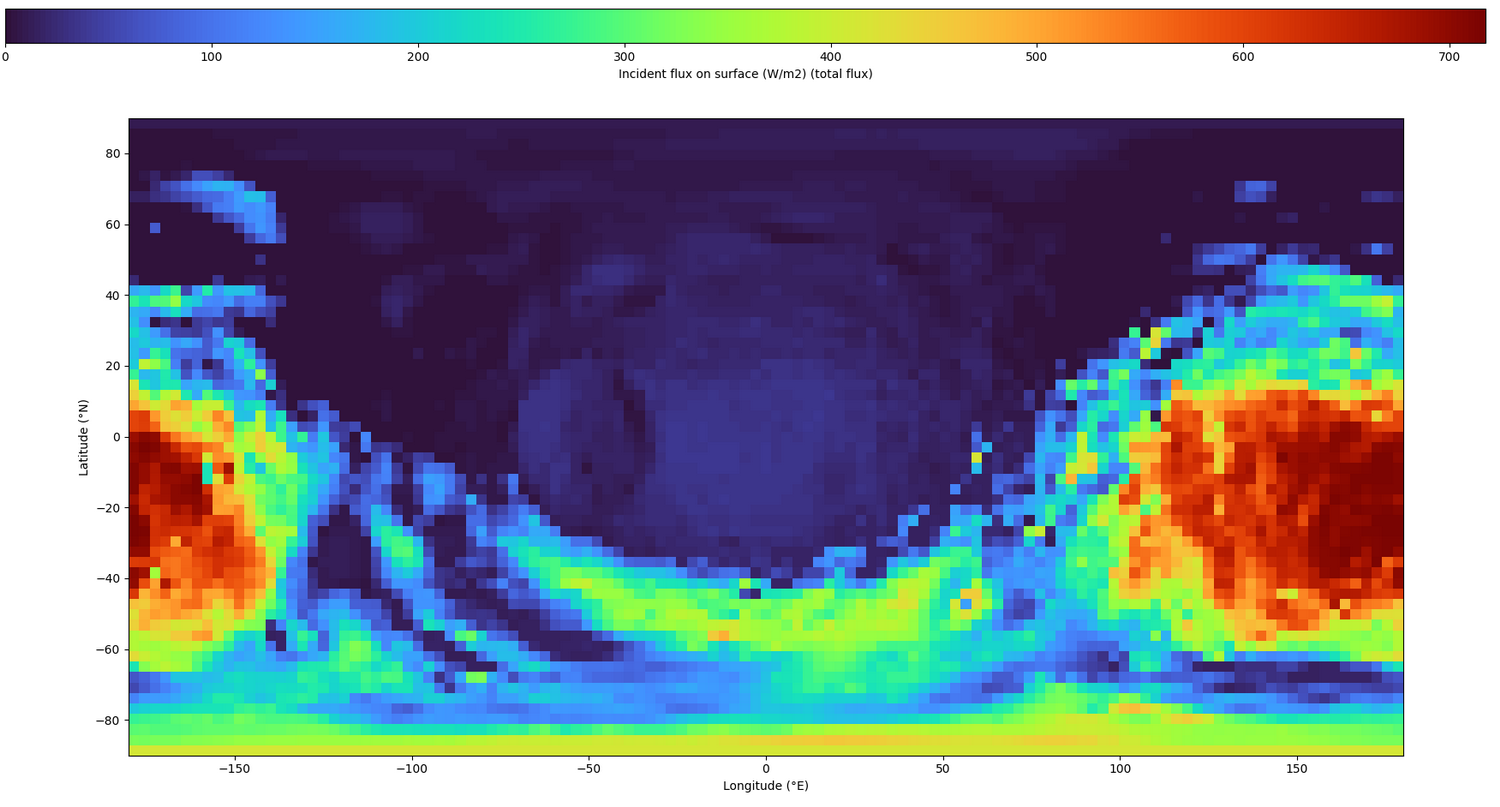
Fig.1: Incident flux at Phobos surface on the 28/07/2005.
Fig.1 illustrates the incident flux map at Phobos surface at a specific date (here on the 28/07/2005 at 09:27).
It clearly displays the sub-solar point at 175°E, and the sub-Mars point (at 0°E) where a second peak of flux arises as a consequence of the reflected and emitted light on Mars (resp. ~26W.m-2$ and ~11W.m-2).
Solving heat equations
To retrieve the surface temperature, we adapted a thermal model [7] to Phobos and Deimos.
This model solves the 1-D time-dependent heat equation for each point of the incident flux map previously computed.
It takes as input the thermal properties of the surface:
-thermal inertia
-porosity
-bulk density
It does not take into account for convection, but considering the absence of atmosphere the model is still applicable. However, it does not consider radiation, which may reveal itself important for high porosity at the surface, where conduction is reduced to punctual contacts between grains, giving more importance to heat transfer by radiation. Fig.2 presents a temperature overview at Phobos surface, computed from the incident flux map shown in Fig.1, for an inertia of 100J.m-2.s-1/2.K-1 a porosity of 0.9 and a density of 1300kg.m-3. The temperature range computed for the period of observation is similar to the results of [10]. The sub-solar point is clearly visible and reaches 295K, whereas the boreal pole is much cooler at 140K.
In this simulation, the influence of Mars was taken into account.
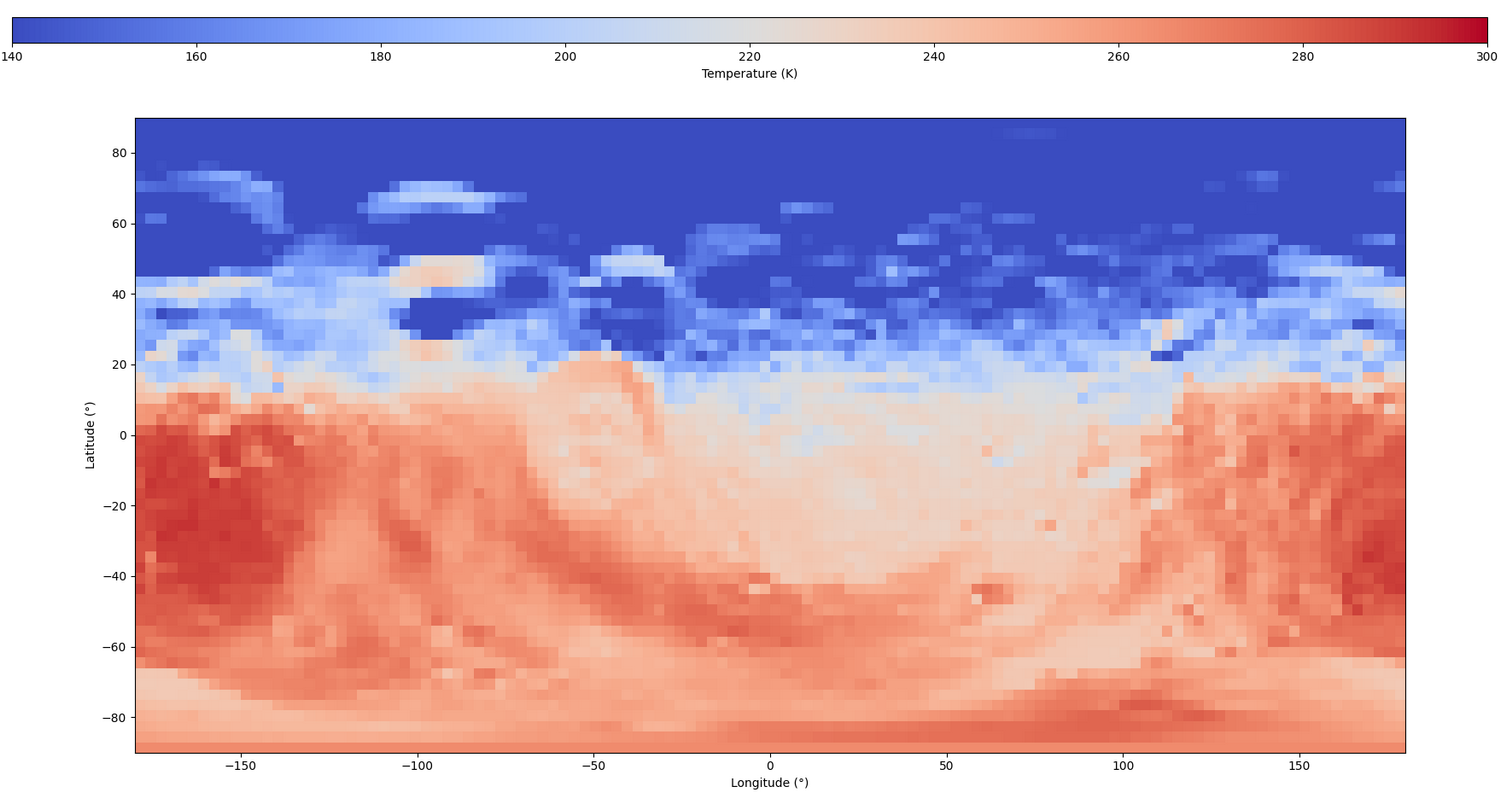
Fig.2: Phobos temperature map surface the same day.
Influence of Mars: the case of Phobos
Computing the surface temperature with and without Mars, allow to determine its influence on Phobos temperature.
Fig.3 illustrates the ΔT-map on Phobos surface on the hemisphere pointing directly to Mars. It results in an increase of almost 3.5K of the surface temperature at the sub-Mars point. This effect is far from negligible, as even this slight temperature variation lead to a significant increase of 26% in the flux emitted by Phobos' surface at 2.5µm, and may be even more important in some configurations where the polar region will be illuminated only by Mars.
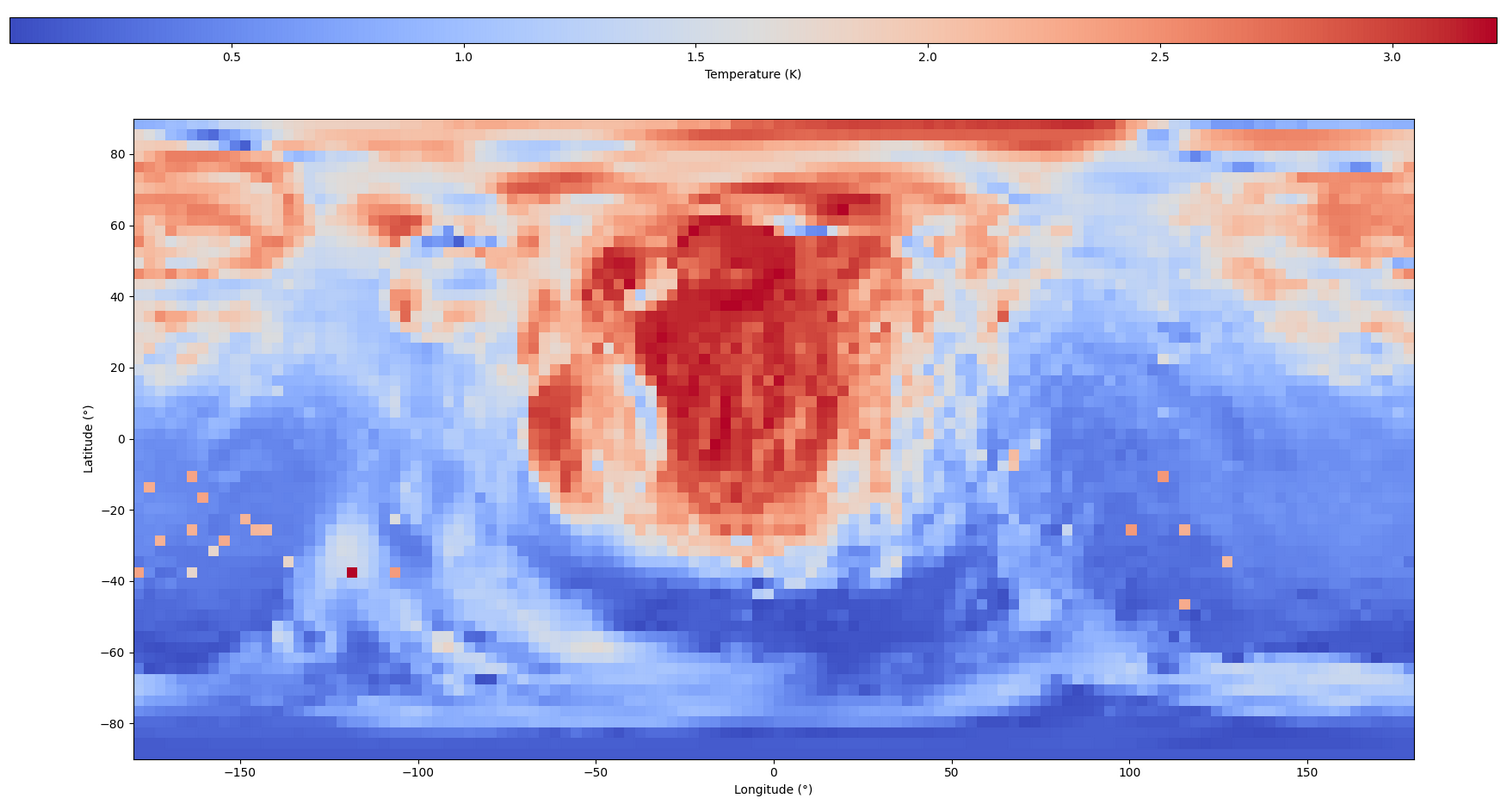
Fig.3: Mars contribution on Phobos surface temperature, up to 3.5K.
Perspectives
We show the importance of a model that takes into account for Mars’s reflection and emission.
However, this model is still under development and currently does not consider the infrared self-heating of the moons. This factor could significantly alter temperatures within craters, which might be crucial for correcting MIRS spectra, particularly in heavily cratered regions.
The temporal albedo variations of Mars (i.e. the dust storms) will also be added in the model as they will completely remove the thermal emission of Mars surface, and increase the albedo.
Acknowledgments
This work is funded by the DIM ORIGIN (Ile de France).
References
[1] Thomas, 1979
[2] Fraeman+, 2012
[3] Fraeman+, 2014
[4] Craddock, 2011
[5] Kuramoto+, 2022
[6] Barucci+, 2021
[7] Ferrari & Leyrat, 2006
[8] Willner+, 2014
[9] Christensen+, 2001
[10] Kuzmin & Zabalueva, 2003
How to cite: Sultana, R., Barucci, A., Leyrat, C., and David, G.: Modelling Martian Moons' Surface Temperature, Europlanet Science Congress 2024, Berlin, Germany, 8–13 Sep 2024, EPSC2024-237, https://doi.org/10.5194/epsc2024-237, 2024.