Unexpected Results from Microwave Sounding of Jupiter’s North Polar Cyclones
- 1Jet Propulsion Laboratory, California Institute of Technology, Pasadena, CA 91109, United States of America (glenn.orton@jpl.nasa.gov)
- 2Michigan Technological University, Houghton, MI, USA
- 3University of Michigan, Ann Arbor, MI, USA
- 4California Institute of Technology, Pasadena, CA, USA
- 5British Astronomical Association, London, UK
- 6Independent scholar, Stuttgart, Germany
- 7Southwest Reserach Institute, San Antonio, TX, United States of America
- 8Planetary Science Institute, Tucson, AZ, USA
- 9University of Leicester, Leicester, UK
- 10INAF/IAPS, Rome, Italy
Introduction
This is a preliminary report on measurements by Juno’s Microwave Radiometer (MWR) of cyclonic vortices in Jupiter’s north polar region. Juno discovered cyclones close to both rotational poles, surrounded by constellations of circumpolar cyclones (CPCs) ~7° from the poles with diameters of ~4000-6000 km (Orton et al. 2017, Adriani et al. 2018). The CPCs move very slowly in longitudes fixed to the interior (System-III) and are stable in their general morphology (‘filled’ vs ‘chaotic’ or ‘spiral’) in the visible or at 5 µm (Tabataba-Vakili et al. 2020, Adriani et al. 2020, Mura et al. 2022). Mura et al. (2021, 2022) noted that the longevity and stability of the CPCs raises questions about their depth. Models range from shallow-water (Li et al. 2020) to deep convection (e.g. Yadav et al. 2020, Garcia et al. 2020, Cai et al. 2021). Credible 3D models require knowledge of their properties at depth.
MWR Observations
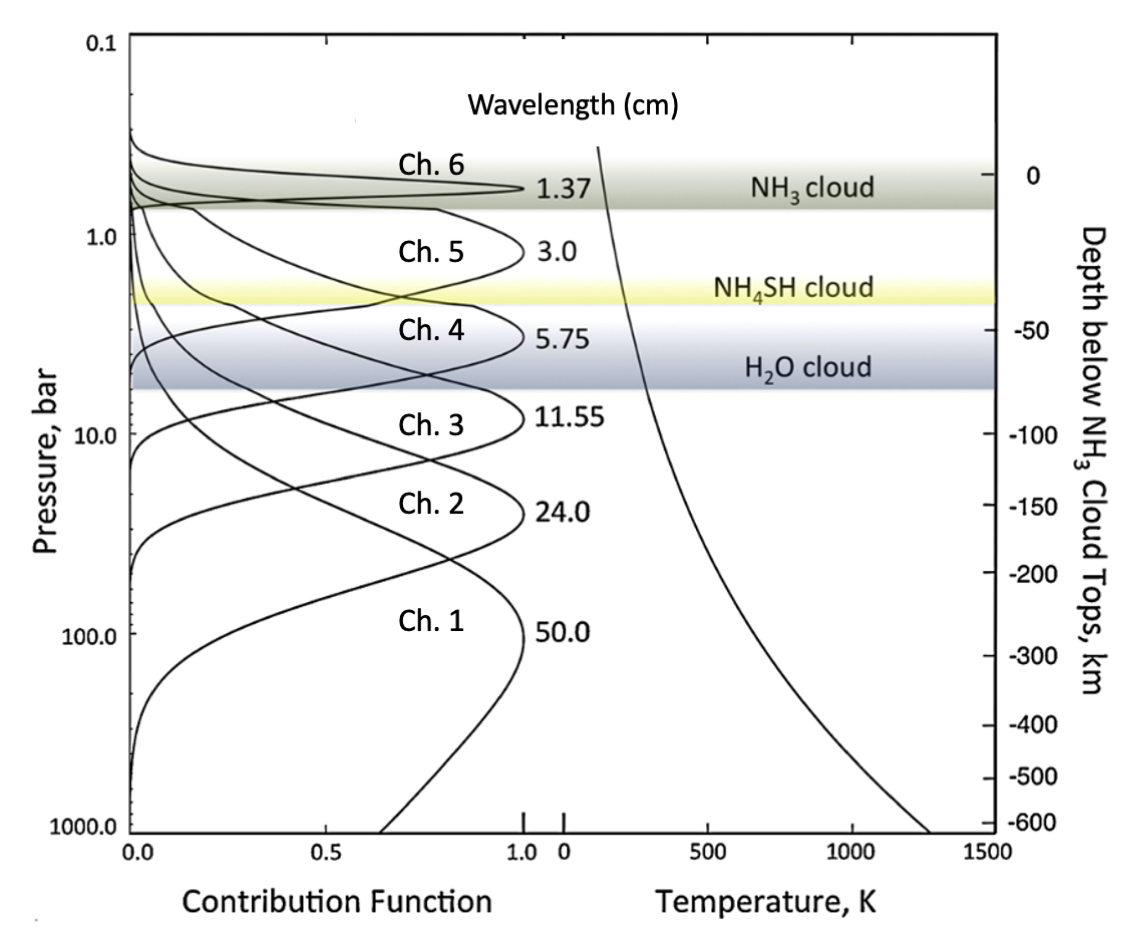
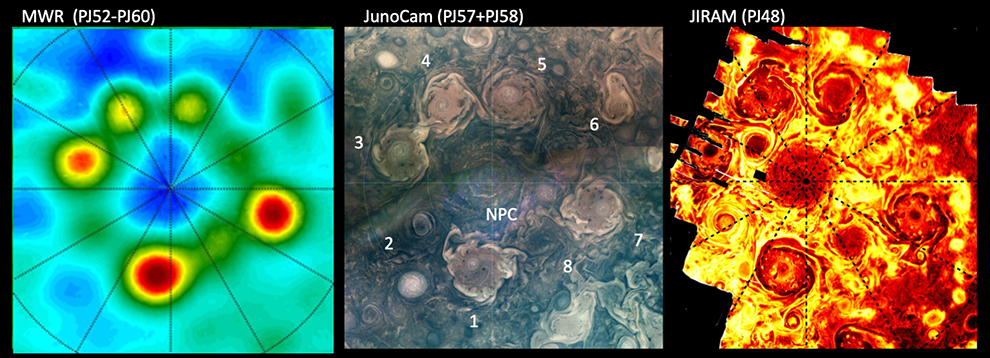
MWR observations, 1.38 - 50 cm in wavelength (Janssen et al. 2017), sense Jupiter at pressures of 0.7 to over 100 bars (Figure 1). Only recently could the MWR resolve the northern CPCs and North Polar Cyclone (NPC), enabled by successive close approaches (“perijoves” or PJs) migrating northward, shortening the distance between the spacecraft and the north polar region. The CPCs are all recognizable in Ch. 6, as relatively bright, with CPCs 2, 6 and 8 much dimmer than the others (Fig. 2). Unlike the CPCs, the NPC has one of the coldest antenna temperatures in the region.
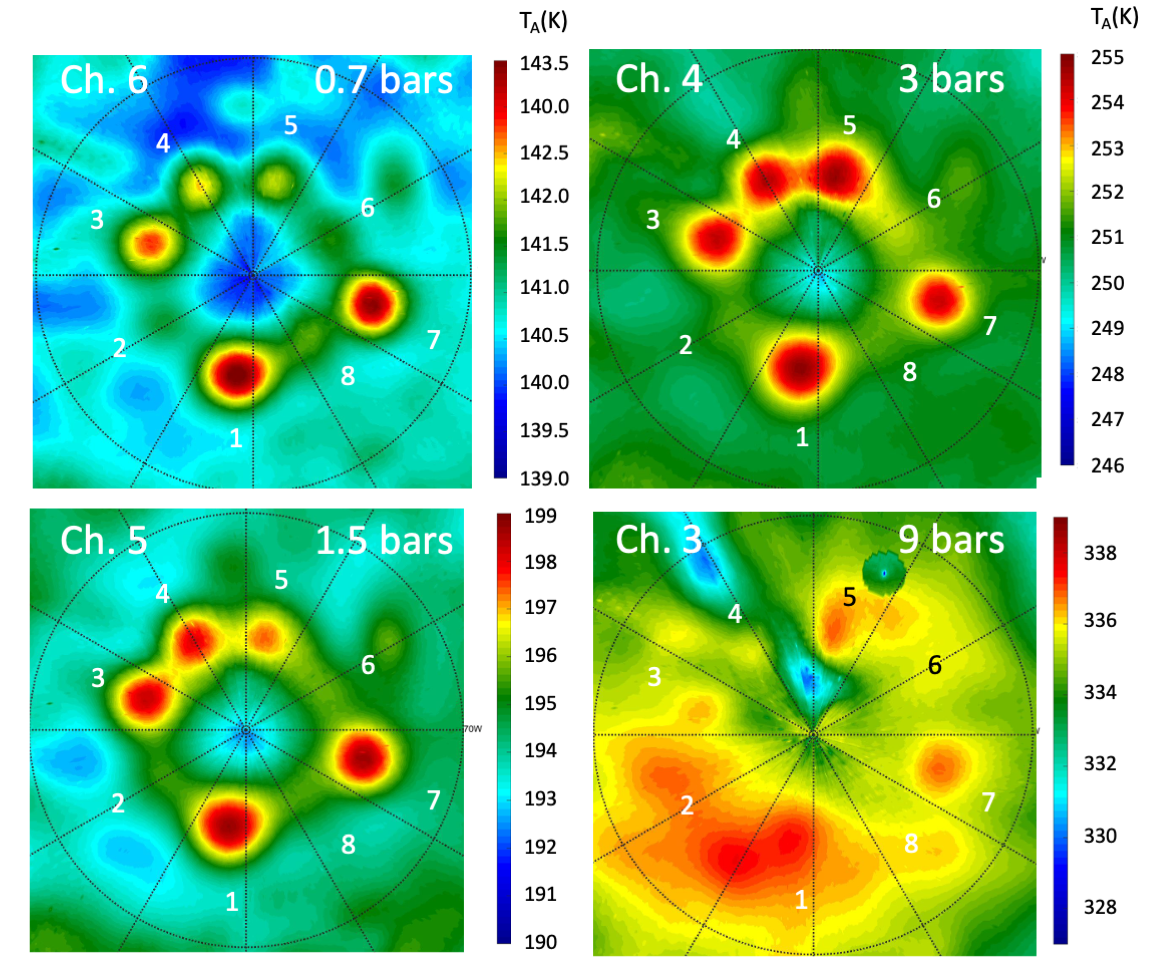
Figure 3 shows that CPCs 1, 3, 4, 5 and 7 are detectable in Ch. 4-6. CPCs 2, 6 and 8 are undetectable in Ch. 3-5. CPCs 3, 5, and 7 are detectable in Ch. 3. A feature associated with CPC 1 could be present but is indistinguishable from a broad, warm background region. The North Polar Cyclone has a relatively colder antenna temperature in all channels.
Discussion
The MWR maps are remarkable. The chaotic or spiral CPCs (2, 6 and 8) are faint, smaller and closer to the rotational pole than the filled CPCs 1, 3, 5 and 7. The strength of all the cyclones (positive for the CPCs and negative for the NPC) diminish with depth. The virtual disappearance of chaotic/spiral CPCs 2, 6 and 8 in channels sensitive to pressures of 1.5 – 3 bars implies that they are probably shallower than the prominent, filled CPCs. The appearance of CPCs in Ch. 3 means they have roots down to at least 9 bars of pressure. MWR observations of a cyclonic vortex at 38°N (Bolton et al. 2021) showed a similar behavior, but its brightness temperature ‘signature’ changed from positive to negative in Ch. 3, implying an inversion around 3-6 bars. An inversion is not evident here for either chaotic/spiral CPCs or the filled CPCs, except possibly for CPC4. Bolton et al. (2021) noted that if the warm brightness temperature is the result of a lower NH3 abundance, a dynamical mechanism is needed to transport ammonia downward from the upper atmospheric layers. A similar mechanism may be responsible for the northern CPCs, with the diversity of their strengths and depth dependences governed by a range of cyclonic vorticities. The cold NPC remains the most puzzling, as it is more similar to anticyclones, e.g. the Great Red Spot and an anticyclone at 19°N (Bolton et al. 2021), requiring higher NH3 abundances or colder temperatures. Separating physical temperatures and NH3 opacity is possible using observations resolving the cyclones over a range of emission angles, an approach successfully used for Jupiter’s equator (Li et al. 2024). We will take advantage of this using MWR measurements of this region at increasing spatial resolution between now and the expected mission end in late 2025.
Some of this research was carried out at the Jet Propulsion Laboratory, California Institute of Technology, under a contract with the National Aeronautics and Space Administration (80NM0018D0004).

Figure 1. Contribution functions of MWR channels. Measurements from Ch. 1 and 2, were not used in this study; their fields of view are twice as large as Ch. 3-6, and they did not resolve the CPCs sufficiently.

Figure 2. The morphologies of the region northward of 78° planetocentric latitude from three Juno instruments. Longitudes are 0° at the bottom and increase clockwise. The MWR map shows composite antenna temperatures for Ch. 6 PJ52-PJ60. The MWR fields of view are about the same size as the CPCs shown at higher resolution by JunoCam and JIRAM. The JunoCam map combines PJ57 and PJ58, and the 5-µm JIRAM map is the last contiguous one of this region. The North Polar Cyclone (“NPC”) and numerical CPC labels are shown in the JunoCam panel. The locations of the CPCs are very similar in each of the maps, due to their very slow longitudinal motion in System III.

Figure 3. MWR maps of antenna temperature from PJ60 observations in Ch. 3-6 with the same orientation as in Fig. 2, together with the pressure of the contribution function maximum of each channel (see Fig. 1). The fields of view of these channels are the same. Numerical identifications of the CPCs are shown. The keys give the respective range of antenna temperature values for each channel.
References
Adriani, A. et al. 2018. Nature 555, 216.
Adriani, A. et al. 2020. J. Geophys. Res. Planets 125, e2019JE006098.
Bolton et al. 2021. Science 374, 968.
Cai, T. et al. 2021. Planet. Sci. J. 2, 81.
Janssen, M. et al. 2017. Space Sci. Rev. 213, 139.
Garcia, F. et al. 2020. Mon. Not. Roy. Astron. Soc. 499, 4698.
Gavriel, N. & Kaspi, Y, 2021. Nature Geosci. 14, 559.
Li, C. et al. 2020. Proc. Nat. Acad. Sci USA 117, 24082.
Li, C. et al. 2024. Icarus 414, 116028 (15 pp).
Mura, A. et al. 2021. Geophys. Res. Lett. 481, 32021GL094235.
Mura, A. et al. 2022. J. Geophys. Res. Planets 127, e2022JJE007241.
Orton, G. S. et al. 2017. Geophys. Res. Lett. 44, 4599.
Tabataba-Vakili, F. et al. 2020. Icarus 335, 113405.
Yadav, R. K. et al. 2020. Sci. Adv. 6, eabb9298.
How to cite: Orton, G., Brown, S., Brueshaber, S., Li, C., Levin, S., Ingersoll, A., Zhang, Z., Rogers, J., Eichstaedt, G., Bolton, S., Momary, T., Hansen, C., Fletcher, L., and Mura, A.: Unexpected Results from Microwave Sounding of Jupiter’s North Polar Cyclones, Europlanet Science Congress 2024, Berlin, Germany, 8–13 Sep 2024, EPSC2024-280, https://doi.org/10.5194/epsc2024-280, 2024.