Spectral imaging of the aerosols, colours and disturbances in the atmospheres of Uranus and Neptune
- 1University of Oxford, Atmospheric, Oceanic and Planetary Physics, Department of Physics, Parks Rd, Oxford OX1 3PU, UK. (patrick.irwin@physics.ox.ac.uk)
- 2University of Bristol, School of Earth Sciences, Wills Memorial Building, Queens Road, Bristol, BS8 1RJ, UK.
- 3University of Leicester, School of Physics & Astronomy, University Road, Leicester, LE1 7RH, UK.
- 4NASA Goddard Space Flight Center, Solar System Exploration Division/690, 8800 Greenbelt Rd, Greenbelt, MA 20771, USA.
- 5University of California - Berkeley, Center for Integrative Planetary Science, Berkeley, CA 94720-3411, USA.
- 6Jet Propulsion Laboratory, California Institute of Technology, 4800 Oak Grove Drive, Pasadena, CA 91109, USA.
- 7Instituto Nacional de Técnica Aeroespacial (INTA), E-28850, Torrejón de Ardoz, Madrid, Spain.
- 8University of the Basque Country UPV/EHU, E-48013 Bilbao, Spain.
Spectroscopic imaging observations of Uranus and Neptune from ground- and space-based telescopes in the last few years have revolutionised our understanding of the atmospheres of the “Ice Giants”. In spectroscopic imaging observations, such as those achieved with Integral Field Unit (IFU) spectrometers, each pixel in the resolved image of the planet contains a continuous spectrum, which can be used to probe gaseous abundances and the vertical distribution of scattering particles to a precision and reliability far exceeding that achievable by filtered imaging alone, where the planet is observed in several individual spectral filters. Observations made near 800 nm with the STIS instrument on the Hubble Space Telescope in 2002 – 2003 have shown that the abundance of methane varies strongly with latitude in both these atmospheres, with the abundance at polar latitudes found to be roughly half that detected at equatorial latitudes. At longer wavelengths (near 1.5 micron), observations made with the NIFS IFU instrument at the Gemini-North telescope in Hawai’i in 2009 – 2010 allowed the first unambiguous detection of hydrogen sulphide in these atmospheres, and also tantalising hints of its latitudinal variation (Irwin et al., 2018, 2019).
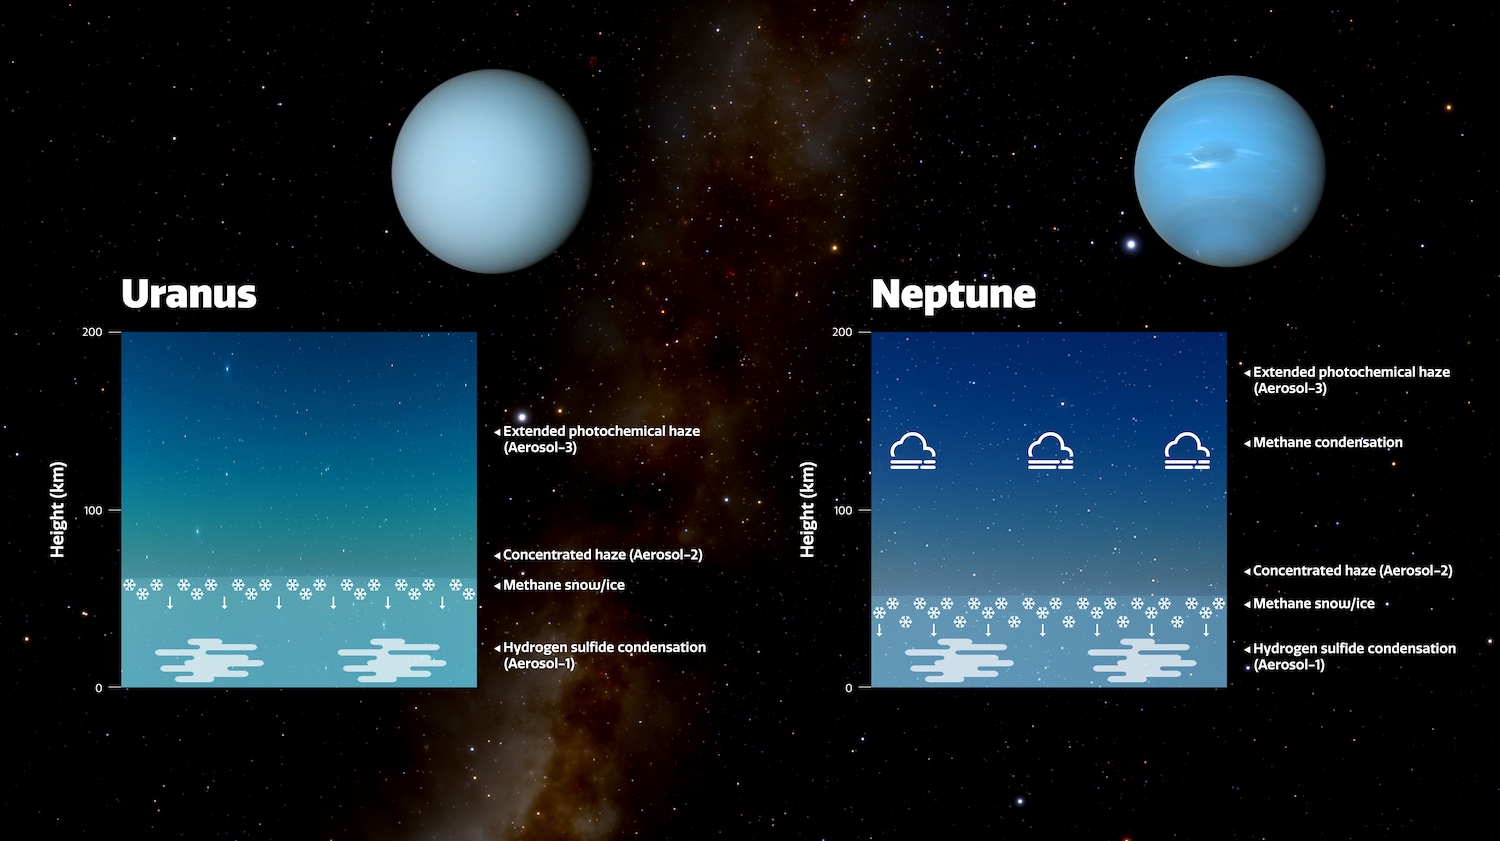
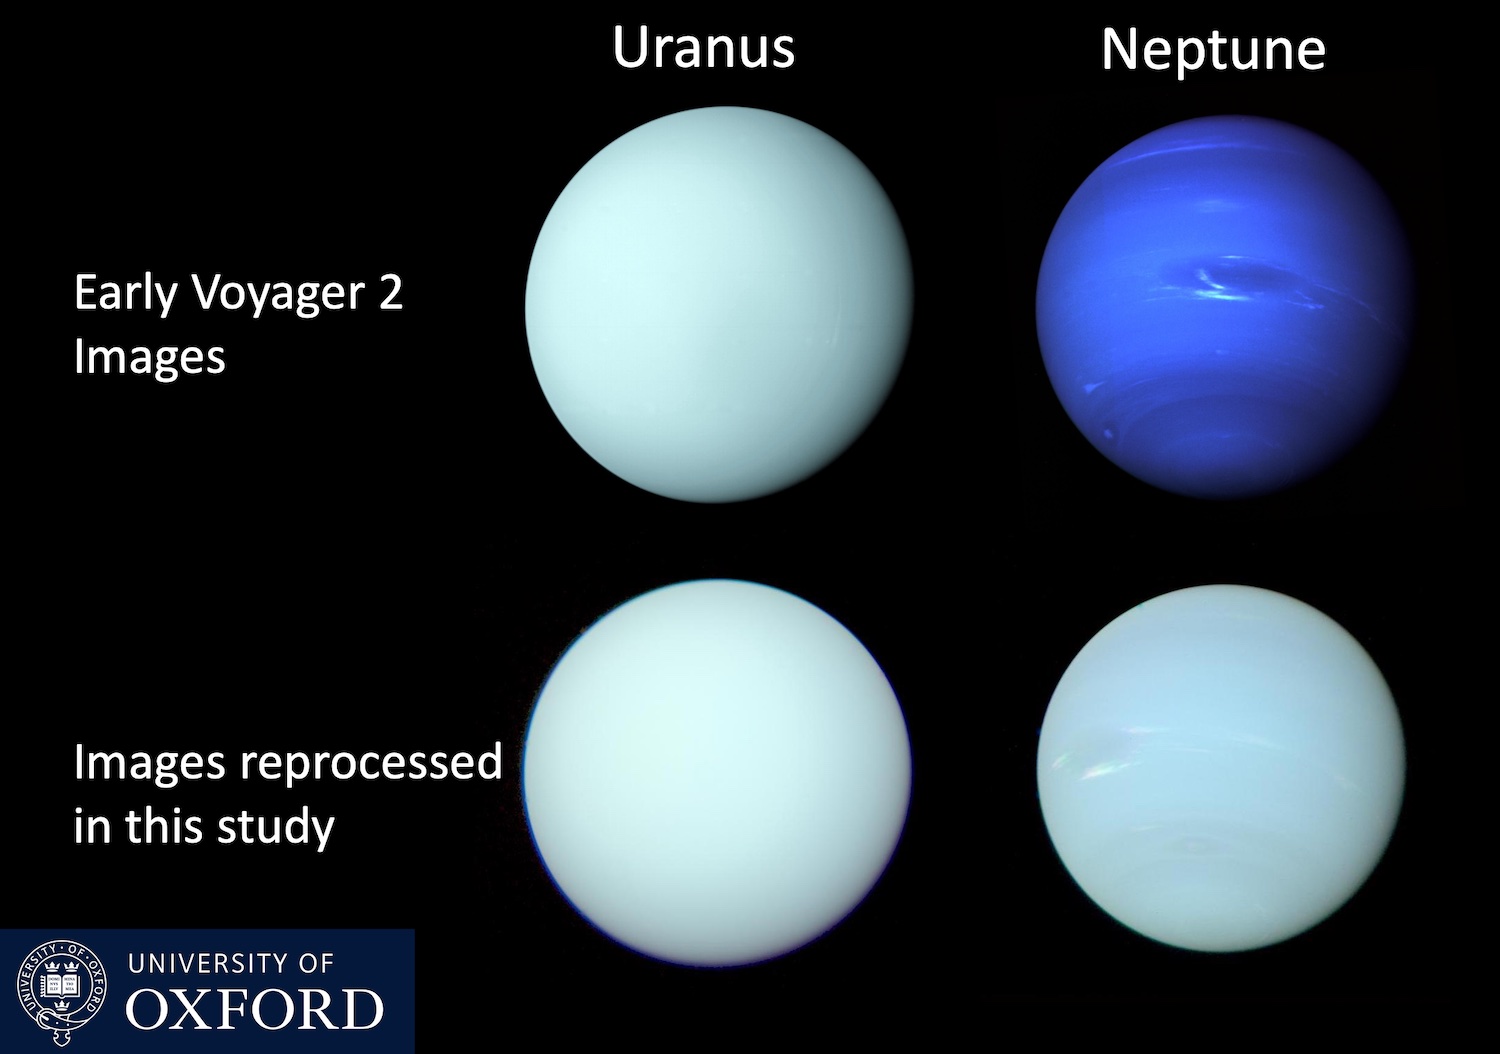
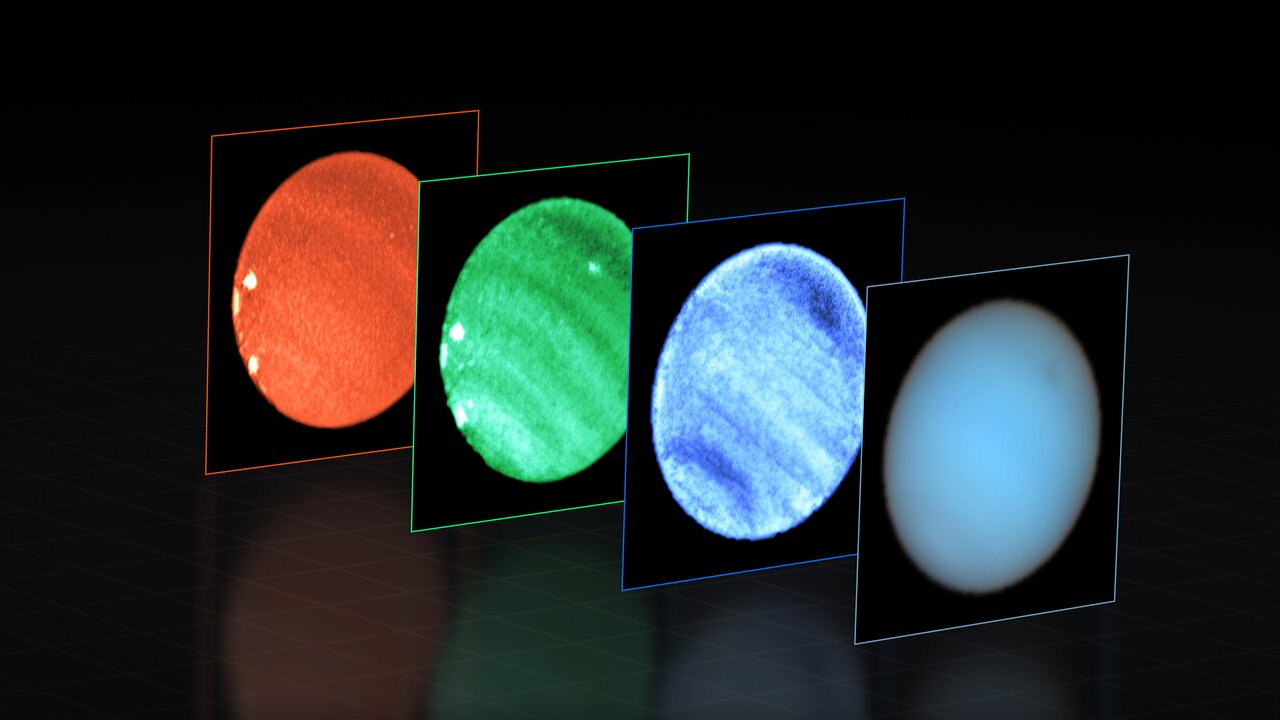
Here, we will highlight recent advances made with spectral imaging observations, using HST/STIS and also the MUSE (Multi Unit Spectroscopic Explorer) instrument at the European Southern Observatory’s Very Large Telescope (VLT) in Chile. Using our NEMESIS radiative transfer and retrieval model, we have developed a method of analysing the latitudinal dependence of the limb-darkening spectra of these planets, enabling us to develop a ‘holistic’ model of the aerosol structure of the Ice Giants. On both planets the weight of evidence supports an atmospheric aerosol structure comprised of: 1) a deep layer of aerosol/H2S ice near the H2S condensation level at p > 5 bar; 2) a middle layer of aerosol/CH4-ice near the CH4 condensation level at p = 1 – 2 bar; and 3) an upper layer of photochemical haze (Fig. 1) (Irwin et al., 2022). Variation in the opacity and scattering properties of the middle aerosol layer near 1 – 2 bar is found to be responsible for the bulk difference in colour between Uranus and Neptune, and also for the seasonal cycle of Uranus’s colour during its 84-year orbit about the Sun (Irwin et al., 2024). While the colour of Uranus varies significantly during its orbit, appearing brighter and slightly greener at solstice, the difference in colour is much less than is commonly perceived from initial Voyager 2 press release images of these planets (Fig. 2). Meanwhile, variation in the reflectivity of the particles in the deep layer at ~5 bar is found to be responsible for the dark spots seen in Neptune’s (and occasionally Uranus’s) atmosphere, and Neptune’s dark South Polar Wave near 60°S (Irwin et al., 2023a). Detecting the NDS-2018 dark spot in our VLT/MUSE observations, made in 2019, was made possible by the adaptive optics system of VLT, combined with a newly develop image deconvolution technique, “Modified-Clean” (Fig. 3). In addition, a new class of deep bright cloud was identified in Neptune’s atmosphere, adjacent to the NDS-2018 dark spot, which hints at deep, vigorous convection, perhaps associated with darker features. The deepness of this cloud feature was only recognised from the narrow width of its spectral signature in the MUSE/IFU observations; the cloud would have been indistinguishable from the widespread upper clouds in filtered imaging, underlining the uniquely important contribution that spectral imaging observations can make. Elsewhere, a previously unrecognised latitudinal variation (~25°) in the reflectivity of the deep Aerosol-1 layer at ~5 bar was determined (Fig. 3) (Irwin et al., 2023b), providing new constraints on the composition and atmospheric circulation at these deeper pressure levels.
It is vital that HST/STIS and VLT/MUSE observations of Uranus and Neptune continue in order to capture and characterise seasonal variations, but also to ‘catch’ ephemeral features such as dark spots and deep convective clouds, which are bound to occur again, but which cannot be forecast. The OPAL giant planet imaging program has demonstrated the science yield of long-term monitoring, in part by enabling the discovery of NDS-2018 on Neptune (Simon et al. 2015, 2019, 2023). Community support for regular outer planet observations with future large telescopes in the USA and Europe (e.g., E-ELT) is strong (e.g., Wong et al. 2019). Our work with MUSE data establishes a methodology to provide key insights into the circulations of Uranus and Neptune based on a long-term spectroscopic time-series campaign at the VLT.
Finally, the James Webb Space Telescope has recently observed both Uranus and Neptune using the NIRSpec instrument in IFU mode at even longer wavelengths from 1.6 to 5.2 microns. These observations will advance even further our understanding of these distant worlds.
References
Irwin et al. (2024) DOI: 10.1093/mnras/stad3761; Irwin et al. (2023a) DOI: 10.1038/s41550-023-02047-0; Irwin et al. (2023b) DOI: 10.1029/2023JE007980; Irwin et al. (2022) DOI: 10.1029/2022JE007189; Irwin et al. (2019) DOI: 10.1016/j.icarus.2018.12.014; Irwin et al. (2018) DOI: 10.1038/s41550-018-0432-1; Simon et al. (2015) DOI: 10.1088/0004-637X/812/1/55; Simon et al. (2019) DOI: 10.1029/2019GL081961; Simon et al. (2023) DOI: 10.3390/rs14061518; Wong et al. (2019) DOI: 10.48550/arXiv.1903.06321
Figures

Figure 1. Holistic Aerosol model of Irwin et al. (2022) for both Uranus and Neptune, described in the abstract.

Figure 2. Voyager 2/ISS images of Uranus and Neptune released shortly after the Voyager 2 flybys in 1986 and 1989, respectively (top row), compared with a reprocessing of the individual filter images by Irwin et al. (2024) (bottom row).

Figure 3. VLT/MUSE observations of Neptune in 2019. The image to the right combines all colours captured by MUSE into a “natural” view of Neptune, where a dark spot can be seen to the upper-right. To the left are three ‘slices’ at wavelengths: 551 nm (blue), 831 nm (green), and 848 nm (red); note that the colours are only indicative, for display purposes. The dark spot is most prominent at shorter (bluer) wavelengths. Right next to this dark spot is a small, deep bright cloud, only visible in the middle slice at 831 nm.
How to cite: Irwin, P., Dobinson, J., Teanby, N., Fletcher, L., Roman, M., Simon, A., Wong, M., Orton, G., Toledo, D., and Perez-Hoyos, S.: Spectral imaging of the aerosols, colours and disturbances in the atmospheres of Uranus and Neptune, Europlanet Science Congress 2024, Berlin, Germany, 8–13 Sep 2024, EPSC2024-325, https://doi.org/10.5194/epsc2024-325, 2024.