OPS6 | Ice Giant System Science and Exploration

OPS6

Ice Giant System Science and Exploration
Convener: Vincent Hue | Co-conveners: Thibault Cavalié, Emma Dahl, Leigh Fletcher, Ravit Helled, Mark Hofstadter, Adrienn Luspay-Kuti, Elias Roussos
Orals
| Thu, 12 Sep, 08:30–12:00 (CEST)|Room Sun (Auditorium)
Posters
| Attendance Tue, 10 Sep, 14:30–16:00 (CEST) | Display Tue, 10 Sep, 08:30–19:00|Poster area Level 2 – Galerie
Orals |
Thu, 08:30
Tue, 14:30
This session will cover all aspects of ice giant (IG) systems including (but not limited to) the atmospheric structure and composition, magnetospheres, interiors, satellites, and rings of the IGs. Interdisciplinary, crosscutting themes of ice giant planet exploration, such as the relationship to exoplanetary science and connections to heliophysics will also be considered in the session. The session will comprise a combination of solicited and contributed oral and poster presentations on new, continuing, and future studies of the ice giant systems and the importance of the ice giants to models of the formation and evolution of the giant planets and solar systems. We welcome abstracts that:
• Address the current understanding of ice giant systems, including atmospheres, interiors, magnetospheres, rings, and satellites including Triton.
• Advance our understanding of the ice giant systems in preparation for future exploration, both by remote sensing and in situ.
• Discuss what the ice giants can tell us about solar system formation and evolution leading to a better understanding of the current structure of the solar system and its habitable zone as well as extrasolar systems.
• Address outstanding science questions requiring future investigations including from spacecraft, remote sensing, theoretical, and laboratory work necessary to improve our knowledge of the ice giants and their relationship to the gas giants and the solar system.
• Present concepts of missions, instruments and investigations relevant to future exploration of the ice giant planetary systems.

Session assets

Discussion on Discord

Orals: Thu, 12 Sep | Room Sun (Auditorium)

Chairpersons: Michael Roman, Affelia Wibisono, Vincent Hue
08:30–08:40
|
EPSC2024-246
|
On-site presentation
Stefano Maffei

Uranus and Neptune are the most underexplored planetary bodies of our Solar System , with in-situ observations limited to the Voyagers' fly-bys over three decades ago. This is to be contrasted with the existence of past and present dedicated orbital missions around Jupiter and Saturn.

In contrast with this paucity of observations, a number of studies have attempted at placing constraints on the internal composition, structure and long-term evolution of Uranus and Neptune. In particular, various internal structure models have been proposed to explain the difference in luminosity between the two ice giants and their markedly non-dipolar magnetic fields. Interior structures and compositions vary significantly among these models. This is particularly true for Uranus, for which various scenarios have been proposed to explain its surprisingly low luminosity, in near equilibrium with the solar input.

The internal state of a planet shapes its convective dynamics, including the dynamo processes that generate planetary magnetic fields. For example, some scenarios proposed to explain Uranus low luminosity, invoke stable stratification that would hinder convective dynamics in some regions of the planet’s interior. It is therefore of great interest to explore how the choice of internal structure and composition, influences the internal dynamics of the ice giants. One way of achieving this is by making use of numerical dynamo simulations, which are widely used to characterise the internal dynamics, magnetic fields and surface winds of Jupiter and Saturn. However, a limited number of studies is dedicated to the study of the convective dynamics and dynamo mechanism of ice giants. Therefore, very few internal structure models have been tested in a dynamical framework. One reason for this is the difficulty in performing realistic simulations of the ice giants’ interiors. The turbulent flows that are expected to develop in the extreme parameters regime that characterise the rapidly rotating interiors of Uranus and Neptune are indeed highly multi-scale in nature. The computational cost of performing dynamo simulations in these regimes is enormous, and only becomes higher when complex internal structure models are considered.

In this study we present results from a numerical study targeted at exploring the effect that different internal structure models have on the generation of magnetic fields, on the surface winds and on the luminosity of Uranus and Neptune. We performed highly turbulent numerical simulations with the MagIC numerical code. Banking on the capabilities of modern supercomputer architectures, we considered various background states in which we have varied the electrical conductivity, density and entropy profiles.

Preliminary results indicate that the dynamo processes and radial variations in the electrical conductivity have a limited effect on the dynamical state determined by the internal convective processes. Ongoing and future work involves estimating the effect of density, composition and entropy background profiles, including the effect of internal stratification. Based on previous studies, these are expected to have an important impact on the resulting dynamical state, but the exact impact on the highly turbulent regimes we are focussed on, is currently unclear.

The suite of numerical simulations computed in the course of our investigation will be helpful in establishing a reference for the interpretation of the result of future satellite missions to the ice giants.

How to cite: Maffei, S.: Geodynamo simulations of internal dynamics and magnetic fields of ice giants, Europlanet Science Congress 2024, Berlin, Germany, 8–13 Sep 2024, EPSC2024-246, https://doi.org/10.5194/epsc2024-246, 2024.

08:40–08:50
|
EPSC2024-944
|
On-site presentation
Marina Cano Amoros, Nicola Tosi, and Nadine Nettelmann

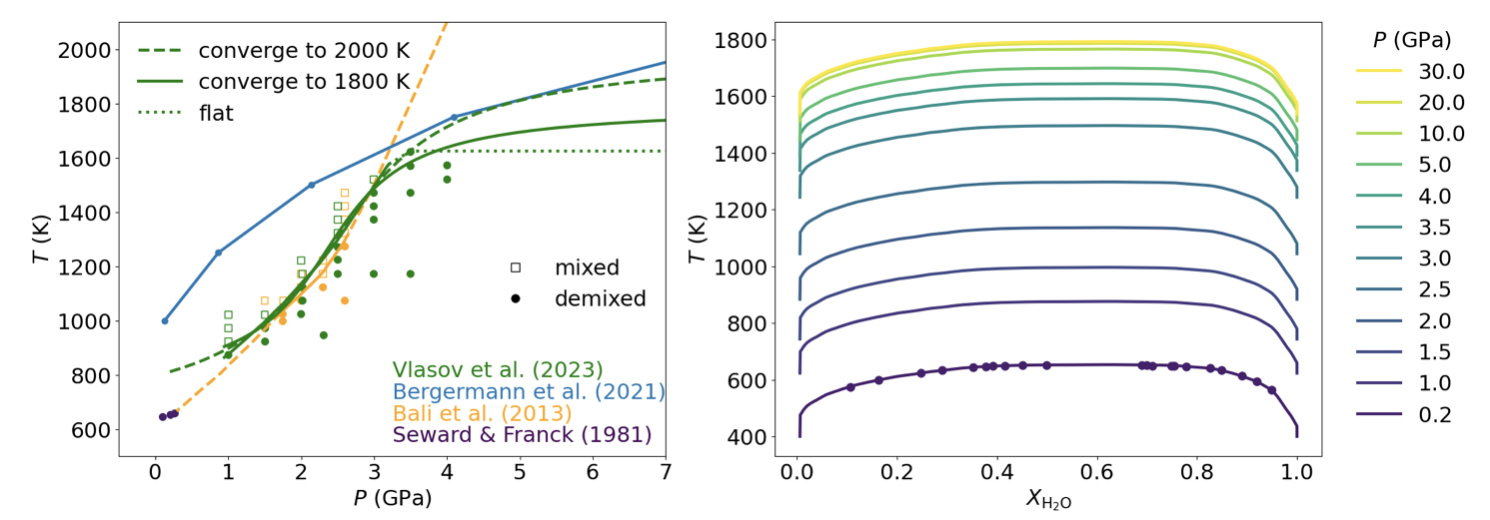
Linking the interior and atmospheric abundances of giant planets is a crucial step in understanding their formation, interior structure, and evolution [1]. In the case of Uranus and Neptune, there are still major uncertainties regarding their bulk composition and distribution of elements. In this work, we present predictions of the atmospheric water abundance of the ice giants, which can reveal important insights into their internal structures. Interior models constrained by the observed gravitational harmonics J2 and J4 indicate that the interiors are composed of a H/He-rich envelope atop an ice/rock-rich interior [2]. To explain such a structure, the phase separation of the two major constituents, water and molecular hydrogen, has been proposed as a possible explanation for this structure [3]. In this scenario, the demixing of hydrogen and water would lead to rain-out of water, leaving the atmosphere depleted of water over time. Here, we employ H2-H2O phase diagrams constrained by experimental data up to 4 GPa [4,5,6] (Figure 1) to predict the atmospheric water abundance over the planets’ evolution (Figure 2). We simulate the process of demixing by applying mass conservation and show that phase separation can occur over a wide range of assumed initial bulk water abundances and may have started already billions of years ago, with higher initial water abundances leading to colder interiors and earlier onsets of demixing. We find that water rain-out can substantially reduce the atmospheric water abundance down to levels between 0.05-0.15wt% whilst the deep water abundance remains essentially primordial.

We also compare the gravity field of our ice giant models to the observed J2 and J4 values [7], noting that the latter also include a contribution from the winds. We compute J2, and J4 both for the models constrained by the H2-H2O phase diagrams and for unconstrained models where the Z-poor/Z-rich transition is variable. We find a preference for models with a water-poor/water-rich transition at 5-15 GPa. For the constrained model, this could imply that the water-poor/water-rich transition could be gradual, or that further transitions perhaps in the C-H system play a role, or that J4 is substantially reduced by zonal winds.

This work connects volatile abundances to gravity field and interior structure of the ice giants, and in light of the exciting Uranus Flagship mission, we stress the importance of obtaining gravity field data as well as in-situ abundance measurements from an atmospheric probe coupled with remote sensing. Such measurements could provide important constraints for the deep water abundance.

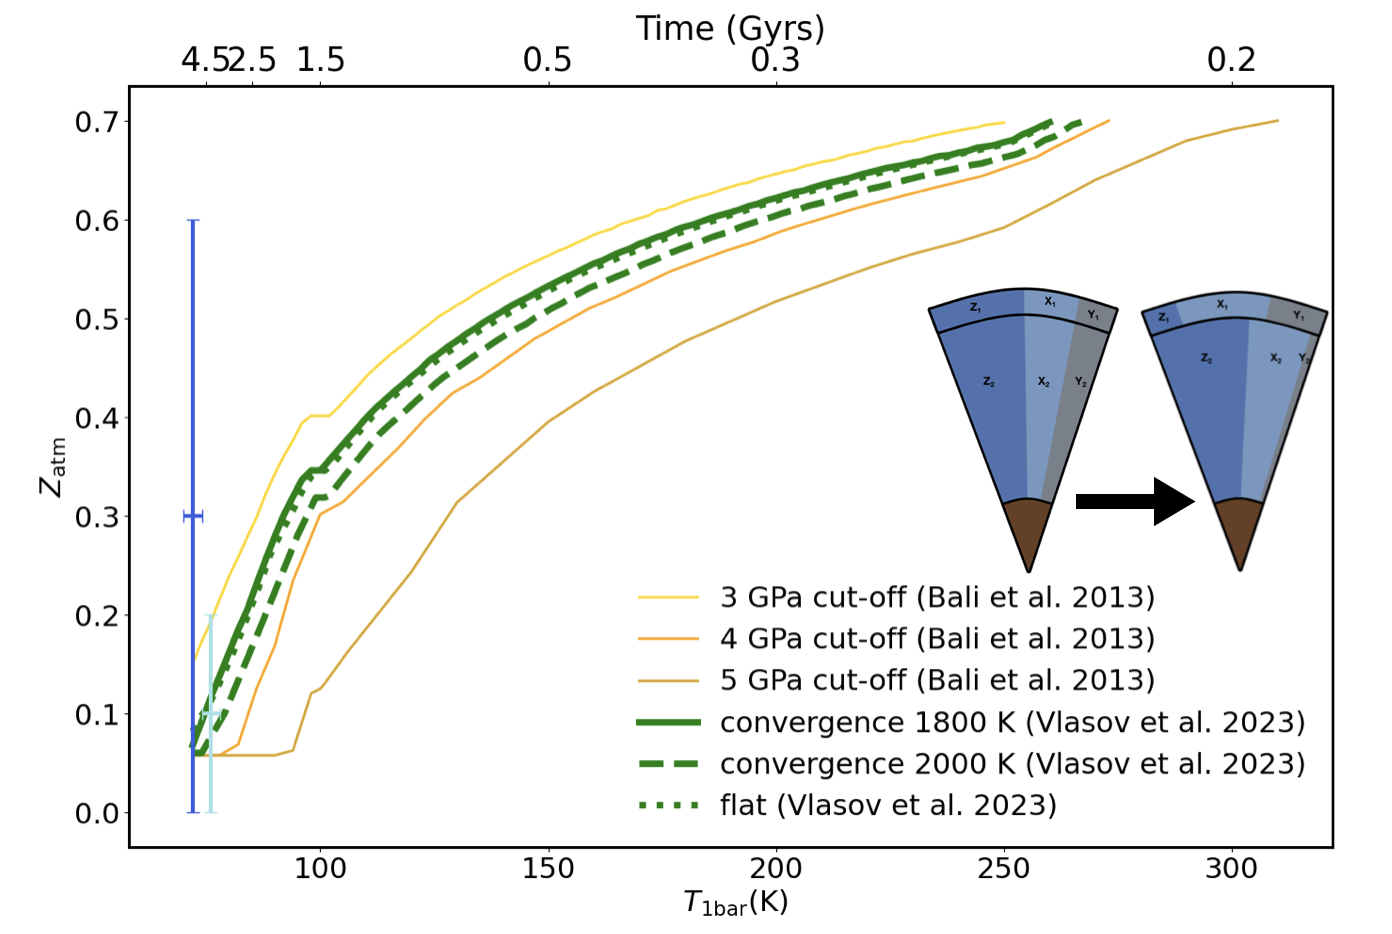
Figure 1: (Left): Experimental and computational data points for H2-H2O miscibility from [4] (purple), [5] (yellow), [6] (green) and [8] (blue). Filled symbols correspond to the coexistence of two phases and empty squares to complete mixing of H2 and H2O. The lines indicate different fits to the data points. A linear extrapolation of the data by [5] to 4 and 5 GPa is shown by the dashed yellow line. Three different extensions above 3.5 GPa for the [6] data (flat, convergence to 1800 K and 2000 K) are shown by green dotted, solid and dashed lines, respectively. (Right): Phase diagram based on the shape of the 0.2 GPa curve from [4] (original data: purple dots). Higher isobars are obtained by shifting the 0.2 GPa curve to match the respective 1:1 critical curves in T-P space.

Figure 2: Predicted atmospheric water abundance as a function of the atmospheric temperature at 1 bar for the different phase diagrams used. The older the planet, the colder the adiabat as specified by T1bar, and the more water rains down, depleting the atmosphere. In our simulation, the planet starts completely mixed with homogeneous envelopes and ends with a water-depleted top envelope. For comparison, the atmospheric water abundances determined from structure models are included together with standard Neptune evolution curves from [2] on the top x-axis.


[1] National Academies of Sciences, Origins, Worlds, and Life: A Decadal Strategy for Planetary Science and Astrobiology 2023-2032. (2023), The National Academies Press

[2] Nettelmann N., Helled R., Fortney J., Redmer R., (2013), Planet. Space Sci., 77, 143

[3] Bailey E., Stevenson D. J., (2021), Planet. Sci. J., 2, 64

[4] Seward T., Franck E., (1981), Berichte der Bunsengesellschaft für physikalische Chemie, 85, 2

[5] Bali E., Audétat A., Keppler H., (2013), Nature, 495, 220

[6] Vlasov K., Audétat A., Keppler H., (2023), Contrib. Mineral. Petrol., 178, 36

[7] Helled R., Fortney J.J., (2020), Philos. Trans. R. Soc. Lond. Ser. A, 378, 20190474

[8] Bergermann A., French M., & Redmer R. (2021), Phys. Chem. Chem. Phys., 23, 12637, 23, 12637

How to cite: Cano Amoros, M., Tosi, N., and Nettelmann, N.: Atmospheric water abundance of the ice giants - a H2/H2O phase separation approach, Europlanet Science Congress 2024, Berlin, Germany, 8–13 Sep 2024, EPSC2024-944, https://doi.org/10.5194/epsc2024-944, 2024.

08:50–09:00
|
EPSC2024-818
|
On-site presentation
Daniel Toledo, Pascal Rannou, Patrick Irwin, Bruno de Batz de Trenquelléon, Victor Apestigue, Michael Roman, Ignacio Arruego, and Margarita Yela

Voyager 2 radio occultation measurements of Uranus and Neptune revealed a layer approximately 2-4 km thick near 1.2 and 1.6 bars, respectively, wherein the atmospheric refractivity exhibited a slope variation (1, 2). These findings were interpreted as indicating a region where methane gas was undergoing condensation, forming an ice cloud centered around this pressure level. While the formation of this putative cloud would explain the observed decrease in methane abundance with height above 1.2 and 1.6 bars, or the banded structure of Uranus through latitudinal variations in the opacity of this cloud, several recent works and observations do not provide direct evidence in favor of this cloud (3): (i) radiative transfer models show an enhancement in the scattering opacity at pressures near 4-6 bars, more consistent with the presence of H2S ice (4, 5); (ii) observations from ground-based telescopes (or observations from telescopes in orbit around the Earth) of methane clouds indicate cloud tops near 0.4 bars in both planets (6), approximately a scale height above the base of the putative methane cloud.

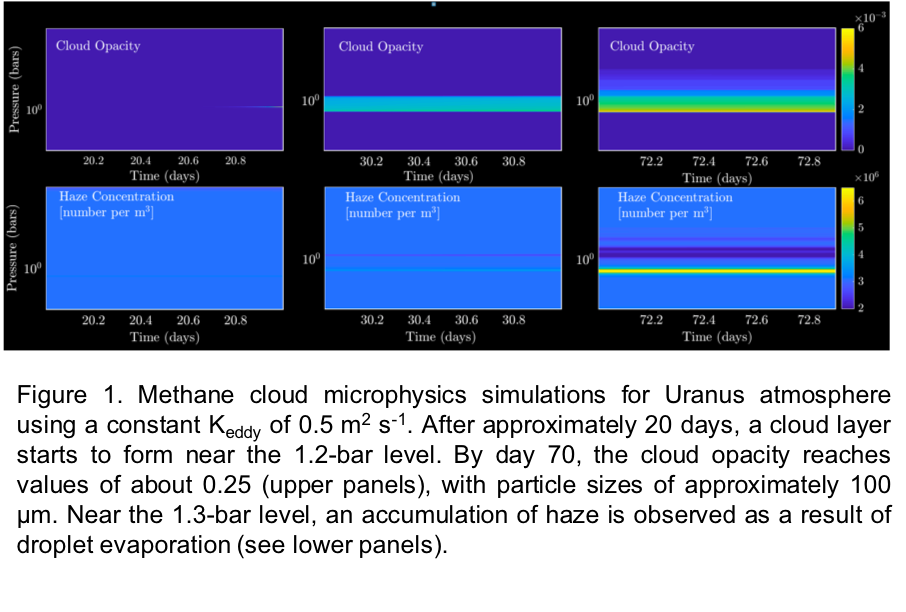
To investigate the formation of methane clouds in the atmospheres of the Ice Giants, we employed a one-dimensional cloud microphysical model originally developed for Titan and Mars (7,8). This model includes the processes of nucleation, condensation, coagulation, evaporation, precipitation, and coalescence. In the model, vertical transport is parameterized using an eddy diffusion profile (Keddy). Figure 1 illustrates, as example, cloud microphysics simulations carried out for the atmosphere of Uranus, assuming a constant Keddy in the troposphere and a concentration of haze particles (cloud condensation nuclei-CCN) of 3 particles per cm3. For this scenario, the model indicates the formation of a cloud layer near the 1.2-bar level with high precipitation rates and haze scavenging.

In this work, we will discuss the different scenarios that may lead to the formation of methane clouds in the Ice Giants, as well as the cloud properties (e.g., precipitation rates, particle radius, and opacity) derived from the model. These results will be compared against observations and previous works, and we will evaluate the differences with respect to the methane clouds observed in Titan’s atmosphere, focusing on parameters such as lifetime or particle radius.


References: [1] G. F. Lindal, et al., Journal of Geophysical Research: Space Physics 92, 14987 (1987). [2] G. Lindal, et al., Geophysical Research Letters 17, 1733 (1990). [3]. L. Sromovsky, P. Fry, J. H. Kim, Icarus 215, 292 (2011). [4] P. G. Irwin, et al., Nature Astronomy 2, 420 (2018). [5] P. G. Irwin, et al., Icarus 321, 550 (2019). [6]. E. Karkoschka, Science 280, 570 (1998). [7] P. Rannou, F. Montmessin, F. Hourdin, S. Lebonnois, science 311, 201 (2006). [8] F. Montmessin, P. Rannou, M. Cabane, Journal of Geophysical Research: Planets 107, 4 (2002).

How to cite: Toledo, D., Rannou, P., Irwin, P., de Batz de Trenquelléon, B., Apestigue, V., Roman, M., Arruego, I., and Yela, M.: Microphysical modeling of methane ice clouds in the atmospheres of the Ice Giants., Europlanet Science Congress 2024, Berlin, Germany, 8–13 Sep 2024, EPSC2024-818, https://doi.org/10.5194/epsc2024-818, 2024.

09:00–09:10
|
EPSC2024-1130
|
On-site presentation
Jack Dobinson and Patrick Irwin

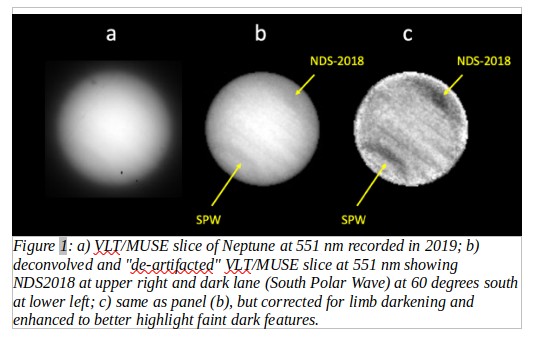
In 2018, observations revealed a dark spot on Neptune’s disc (NDS-2018) (Simon et. al., 2019), other darks spots have previously been observed (Hammel et. al. 1995) and their transient nature implies they are indicative of dynamic processes in Neptune’s atmosphere. However, observing these features from the ground poses substantial challenges. The point spread function (PSF) of ground based observations, even those using adaptive optics (AO), reduced the contrast between NDS-2018 and its brighter surrounding regions, complicating the detection and analysis of this phenomenon by causing “bleeding” of spectral information from the surrounding regions into NDS-2018 (Fig. 1). Traditional deconvolution techniques, such as the Lucy-Richardson (LR) algorithm (Richardson, 1972; Lucy, 1974; Wakker, 1988; Starck et. al., 2002), even with regularisation techniques e.g. Tikhonov regularization or methods to transform the problem into a more point-like deconvolution problem (Sromovsky et. al., 2001), were ineffective at improving the spatial resolution without introducing artifacts. Artifacts which, in the case of LR deconvolution for example, manifested as spurious bright and dark “mottling” with contrast levels similar to those of NDS-2018 and its adjacent disk, undermining the data quality and interpretability.


To address these challenges, we explored a modified version of the CLEAN algorithm, traditionally used in radio astronomy but seldom applied in visible or infrared observations (Keel, 1984). The CLEAN algorithm works by iteratively identifying and subtracting the strongest point sources in the data, effectively deconvolving the image (Högbom, 1974). The MODIFIED CLEAN (MC) algorithm adapts this approach to iteratively subtract extended bright regions, which eliminates much of the non-physical stippling seen when using the traditional CLEAN algorithm (Steer 1984). Like conventional methods, MC is sensitive to parameter choice, especially how the regions to be subtracted are selected. However, failure modes of MC are obviously non-physical, and automated tuning of parameters is possible. We provide a comprehensive overview of MC, including input, processing stages, and output examples, demonstrating its superior ability to enhance image quality and reveal details of NDS-2018 (Irwin et. al. 2022) and other Integral Field Unit (IFU) observations.


To support the deconvolution process, we also developed a Singular Spectrum Analysis (SSA) (Golyandina et. al., 2001; Golyandina et. al., 2013) based method to detect artifacts in the input data. This was required as Integral Field Unit (IFU) images, which capture data across hundreds to thousands of frequencies, present additional complexities in artifact detection. While small, stationary artifacts can often be managed through interpolation or median filtering, large or mobile artifacts, which shift unpredictably across frequencies, pose significant challenges. During deconvolution artifacts can introduce non-physical distortions and edge effects, corrupting the output far beyond their immediate vicinity. Manual identification is feasible for single images or stationary artifacts but becomes impractical for large IFU datasets with varying artifact positions. Thus, there is a need for automated techniques to identify and manage artifacts to ensure the integrity of deconvolution processes.

[Simon et. al., 2019] https://doi.org/10.1029/2019GL081961


[Hammel et. Al 1995] Hammel HB, Lockwood GW, Mills JR, Barnet CD. Hubble Space Telescope Imaging of Neptune's Cloud Structure in 1994. Science. 1995 Jun 23;268(5218):1740-2. doi: 10.1126/science.268.5218.1740. PMID: 17834994.


[Högbom 1974] Högbom, J.A. (1974). Aperture Synthesis with a Non-Regular Distribution of Interferometer Baselines, Astronomy and Astrophysics Supplement, 15, 417.


[Irwin et. al., 2022] https://doi.org/10.1029/2022JE007189


[Keel, 1984] https://doi.org/10.1086/132871


[Lucy 1974] Lucy, L. B. (1974). "An iterative technique for the rectification of observed distributions". Astron. J.,79 (6): 745–754.


[Richardson 1972] Richardson, W.H. (1972). "Bayesian-Based - Iterative Method of Image Restoration". J. Opt. Soc. America, 62(1), 55.


[Sromovsky et. al., 2001] https://doi.org/10.1006/icar.2000.6562


[Starck et. al., 2002] https://doi.org/10.1086/342606


[Steer 1984] Steer, D.G., et. al. (1984). Enhancements to the deconvolution algorithm ‘CLEAN’. A&S, 137, 159–165.


Wakker 1988] Wakker, B.P., & Schwarz, U.J. (1988) The Multi-Resolution CLEAN and its application to the short-spacing problem in interferometry. A&A, 200, 312–322.


[Golyandina et. al., 2001] Golyandina, N., Nekrutkin, V., & Zhigljavsky, A.A. (2001). Analysis of Time Series Structure - SSA and Related Techniques. Monographs on statistics and applied probability.


[Golyandina et. al.,2013] doi:10.48550/arXiv.1309.5050

How to cite: Dobinson, J. and Irwin, P.: Enhancing Observation Quality of Low Contrast Features of Ice Giants using MODIFIED CLEAN Algorithm and SSA-Based Artifact Detection, Europlanet Science Congress 2024, Berlin, Germany, 8–13 Sep 2024, EPSC2024-1130, https://doi.org/10.5194/epsc2024-1130, 2024.

09:10–09:15
09:15–09:25
|
EPSC2024-325
|
On-site presentation
Patrick Irwin, Jack Dobinson, Nicholas Teanby, Leigh Fletcher, Michael Roman, Amy Simon, Michael Wong, Glenn Orton, Daniel Toledo, and Santiago Perez-Hoyos

Spectroscopic imaging observations of Uranus and Neptune from ground- and space-based telescopes in the last few years have revolutionised our understanding of the atmospheres of the “Ice Giants”. In spectroscopic imaging observations, such as those achieved with Integral Field Unit (IFU) spectrometers, each pixel in the resolved image of the planet contains a continuous spectrum, which can be used to probe gaseous abundances and the vertical distribution of scattering particles to a precision and reliability far exceeding that achievable by filtered imaging alone, where the planet is observed in several individual spectral filters. Observations made near 800 nm with the STIS instrument on the Hubble Space Telescope in 2002 – 2003 have shown that the abundance of methane varies strongly with latitude in both these atmospheres, with the abundance at polar latitudes found to be roughly half that detected at equatorial latitudes. At longer wavelengths (near 1.5 micron), observations made with the NIFS IFU instrument at the Gemini-North telescope in Hawai’i in 2009 – 2010 allowed the first unambiguous detection of hydrogen sulphide in these atmospheres, and also tantalising hints of its latitudinal variation (Irwin et al., 2018, 2019).  

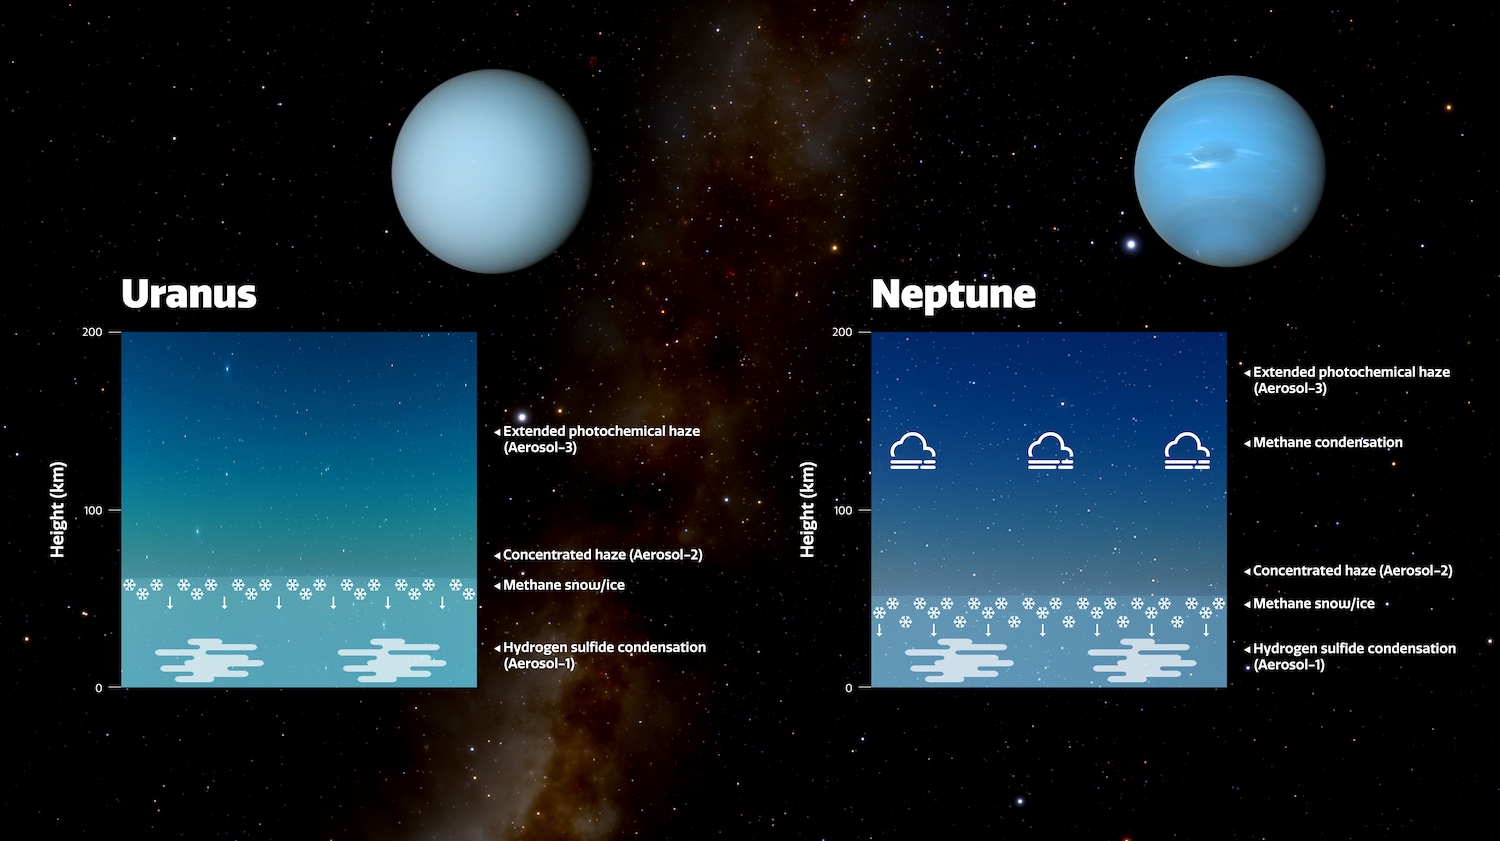
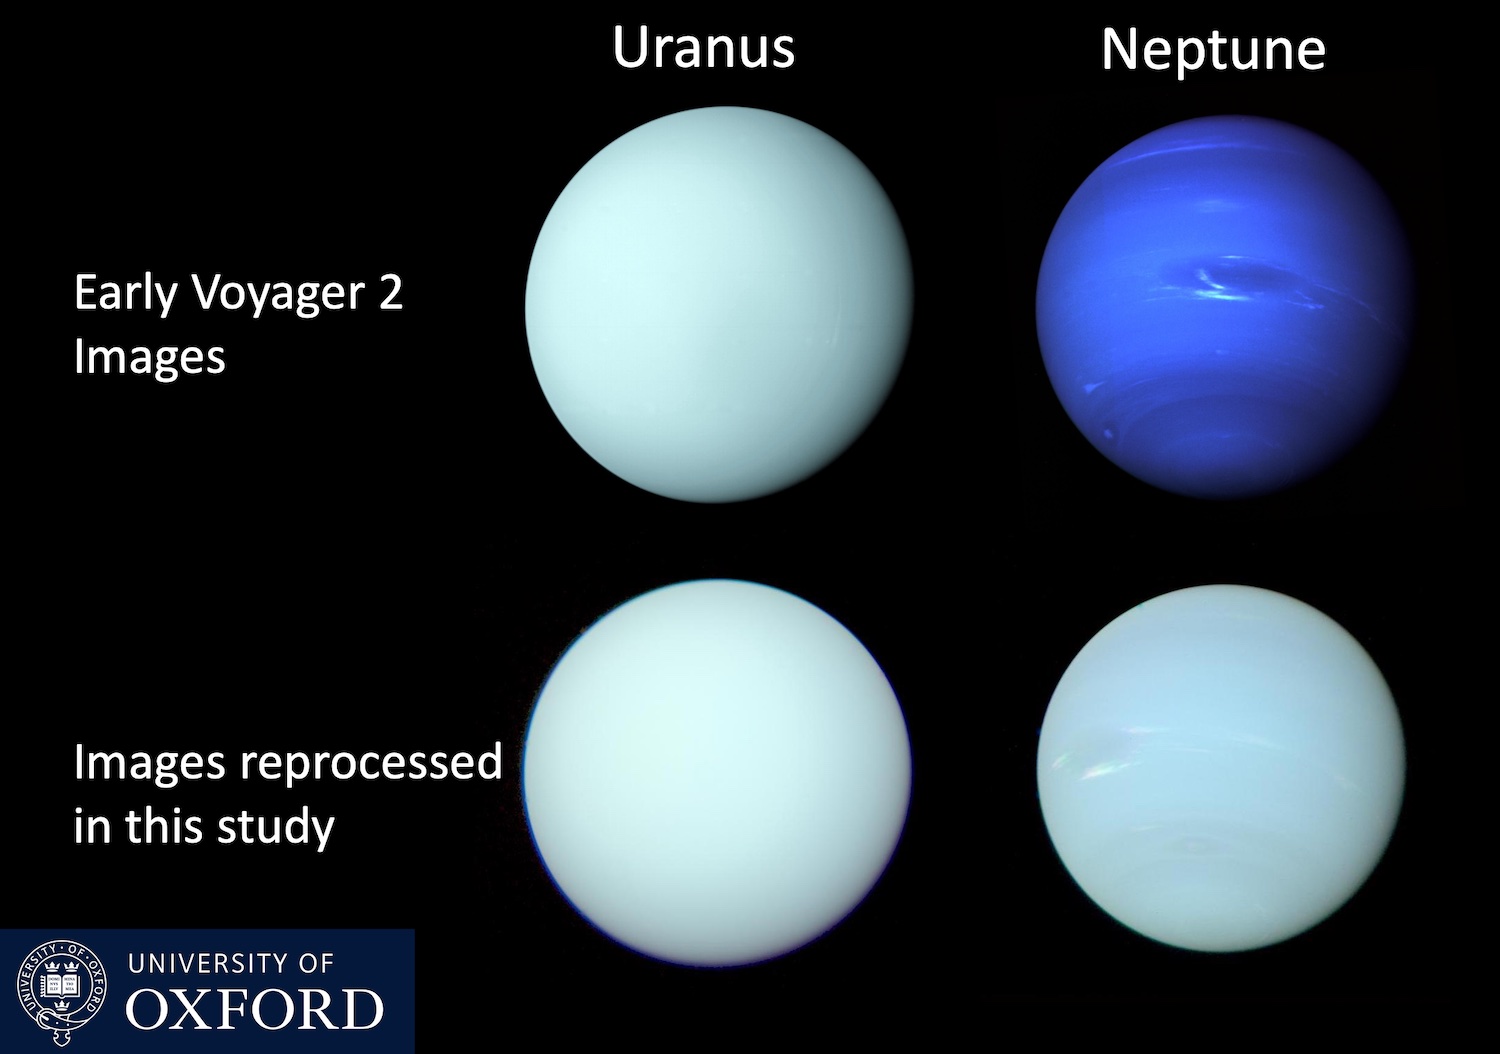
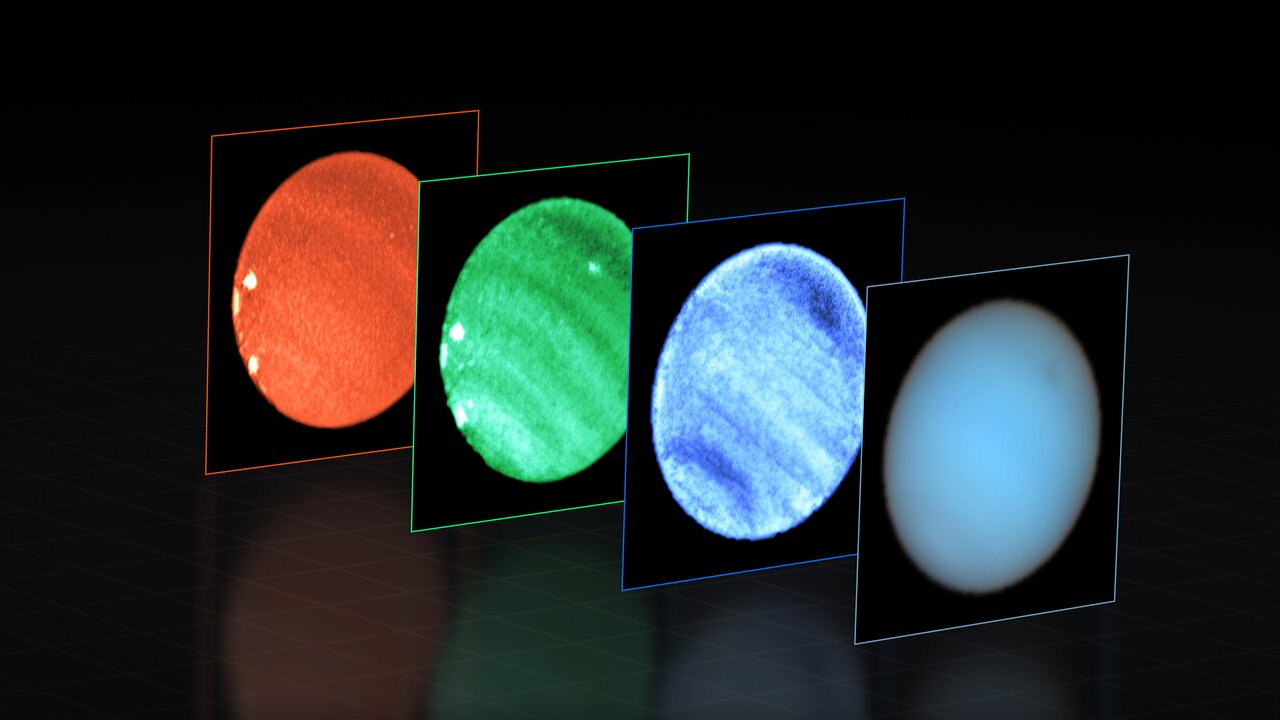
Here, we will highlight recent advances made with spectral imaging observations, using HST/STIS and also the MUSE (Multi Unit Spectroscopic Explorer) instrument at the European Southern Observatory’s Very Large Telescope (VLT) in Chile. Using our NEMESIS radiative transfer and retrieval model, we have developed a method of analysing the latitudinal dependence of the limb-darkening spectra of these planets, enabling us to develop a ‘holistic’ model of the aerosol structure of the Ice Giants. On both planets the weight of evidence supports an atmospheric aerosol structure comprised of: 1) a deep layer of aerosol/H2S ice near the H2S condensation level at p > 5 bar; 2) a middle layer of aerosol/CH4-ice near the CH4 condensation level at p = 1 – 2 bar; and 3) an upper layer of photochemical haze (Fig. 1) (Irwin et al., 2022). Variation in the opacity and scattering properties of the middle aerosol layer near 1 – 2 bar is found to be responsible for the bulk difference in colour between Uranus and Neptune, and also for the seasonal cycle of Uranus’s colour during its 84-year orbit about the Sun (Irwin et al., 2024). While the colour of Uranus varies significantly during its orbit, appearing brighter and slightly greener at solstice, the difference in colour is much less than is commonly perceived from initial Voyager 2 press release images of these planets (Fig. 2). Meanwhile, variation in the reflectivity of the particles in the deep layer at ~5 bar is found to be responsible for the dark spots seen in Neptune’s (and occasionally Uranus’s) atmosphere, and Neptune’s dark South Polar Wave near 60°S (Irwin et al., 2023a). Detecting the NDS-2018 dark spot in our VLT/MUSE observations, made in 2019, was made possible by the adaptive optics system of VLT, combined with a newly develop image deconvolution technique, “Modified-Clean” (Fig. 3). In addition, a new class of deep bright cloud was identified in Neptune’s atmosphere, adjacent to the NDS-2018 dark spot, which hints at deep, vigorous convection, perhaps associated with darker features. The deepness of this cloud feature was only recognised from the narrow width of its spectral signature in the MUSE/IFU observations; the cloud would have been indistinguishable from the widespread upper clouds in filtered imaging, underlining the uniquely important contribution that spectral imaging observations can make. Elsewhere, a previously unrecognised latitudinal variation (~25°) in the reflectivity of the deep Aerosol-1 layer at ~5 bar was determined (Fig. 3) (Irwin et al., 2023b), providing new constraints on the composition and atmospheric circulation at these deeper pressure levels.

It is vital that HST/STIS and VLT/MUSE observations of Uranus and Neptune continue in order to capture and characterise seasonal variations, but also to ‘catch’ ephemeral features such as dark spots and deep convective clouds, which are bound to occur again, but which cannot be forecast. The OPAL giant planet imaging program has demonstrated the science yield of long-term monitoring, in part by enabling the discovery of NDS-2018 on Neptune (Simon et al. 2015, 2019, 2023). Community support for regular outer planet observations with future large telescopes in the USA and Europe (e.g., E-ELT) is strong (e.g., Wong et al. 2019). Our work with MUSE data establishes a methodology to provide key insights into the circulations of Uranus and Neptune based on a long-term spectroscopic time-series campaign at the VLT.

Finally, the James Webb Space Telescope has recently observed both Uranus and Neptune using the NIRSpec instrument in IFU mode at even longer wavelengths from 1.6 to 5.2 microns. These observations will advance even further our understanding of these distant worlds.

References

Irwin et al. (2024) DOI: 10.1093/mnras/stad3761; Irwin et al. (2023a) DOI: 10.1038/s41550-023-02047-0; Irwin et al. (2023b) DOI: 10.1029/2023JE007980; Irwin et al. (2022) DOI: 10.1029/2022JE007189; Irwin et al. (2019) DOI: 10.1016/j.icarus.2018.12.014; Irwin et al. (2018) DOI: 10.1038/s41550-018-0432-1; Simon et al. (2015) DOI: 10.1088/0004-637X/812/1/55; Simon et al. (2019) DOI: 10.1029/2019GL081961; Simon et al. (2023) DOI: 10.3390/rs14061518; Wong et al. (2019) DOI: 10.48550/arXiv.1903.06321

Figures

Figure 1. Holistic Aerosol model of Irwin et al. (2022) for both Uranus and Neptune, described in the abstract.


Figure 2. Voyager 2/ISS images of Uranus and Neptune released shortly after the Voyager 2 flybys in 1986 and 1989, respectively (top row), compared with a reprocessing of the individual filter images by Irwin et al. (2024) (bottom row).


Figure 3. VLT/MUSE observations of Neptune in 2019. The image to the right combines all colours captured by MUSE into a “natural” view of Neptune, where a dark spot can be seen to the upper-right. To the left are three ‘slices’ at wavelengths: 551 nm (blue), 831 nm (green), and 848 nm (red); note that the colours are only indicative, for display purposes. The dark spot is most prominent at shorter (bluer) wavelengths. Right next to this dark spot is a small, deep bright cloud, only visible in the middle slice at 831 nm.

How to cite: Irwin, P., Dobinson, J., Teanby, N., Fletcher, L., Roman, M., Simon, A., Wong, M., Orton, G., Toledo, D., and Perez-Hoyos, S.: Spectral imaging of the aerosols, colours and disturbances in the atmospheres of Uranus and Neptune, Europlanet Science Congress 2024, Berlin, Germany, 8–13 Sep 2024, EPSC2024-325, https://doi.org/10.5194/epsc2024-325, 2024.

09:25–09:35
|
EPSC2024-875
|
ECP
|
On-site presentation
Arthur Le Saux, Sandrine Guerlet, Aymeric Spiga, Gwenaël Milcareck, Noé Clément, and Jérémy Leconte

Uranus and Neptune, also known as the ice giants of the solar system, have received less attention from the scientific community compared to other planets. Their atmospheric dynamics are very different from those of other gas giants, due to their size, composition, rotation period and greater distance from the Sun. For example, Neptune has the strongest zonal wind observed in the solar system, and Uranus has similar mid-latitude zonal jets as Neptune despite its very different seasonal forcing and absence of internal heat. In addition, their study will provide new insights into planet formation and evolution, as well as the general dynamics of planetary atmospheres, but also beyond our solar system, since they are considered the archetype of most exoplanets.

In this talk, I will present a sophisticated general circulation model (GCM), known as the DYNAMICO Generic Planetary Climate Model, which we use to study the complex weather phenomena and climate of planetary atmospheres. Recently successfully adapted to Jupiter and Saturn, we are extending its application to Uranus and Neptune (see also Milcareck et al. 2024). Compared to the simulations of Milcareck et al., we investigate the role of small scale convective processes in the upper troposphere. Indeed, convection is a crucial driver of atmospheric circulation, as it has a significant impact on energy transport and the distribution of chemical species in the atmosphere. In this context, our aim is to provide answers to the two main mysteries linked to ice giants: equatorial subrotation and the transport of heat and chemical species in hydrogen atmospheres.

One of the unique aspects of our study lies in the inclusion of methane condensation in the convection parameterization scheme based on a thermal plume model originally developed for the Earth's atmospheric boundary layer (Rio & Hourdin 2008). This convection parameterization allows for the vertical transport of heat, chemical species and angular momentum by small-scale processes that are not resolved by the GCM. Moreover, methane is the third most abundant species in the troposphere, with a vertical gradient in composition. Unlike on Earth, this condensable species is heavier than the surrounding atmosphere, composed mainly of hydrogen and helium. This phenomenon has been suggested as a powerful driver of the intermittent storm activity detected in the atmospheres of ice giants (Guillot 2022). To model realistic transport by thermal plumes, we adjust our model parameters using the 3D cloud-resolving model of Clément et al. (in review), which resolves local storms in the atmospheres of Neptune and Uranus.

We first characterized how convection occurs in 1D simulations (occurrence frequency of convective plumes, their associated vertical wind speed, etc…) before running 3D global simulations. We will present these 3D simulations obtained with and without this sub-grig scale parametrization of convection. The improved fidelity of our GCM simulations offers valuable implications for interpreting observational data and refining our understanding of the atmospheric processes governing these enigmatic outer planets. These results come at just the right time to prepare the scientific objectives of the Uranus Flagship mission, scheduled for the early 2030s.

How to cite: Le Saux, A., Guerlet, S., Spiga, A., Milcareck, G., Clément, N., and Leconte, J.: Exploring the atmospheric dynamics of the Ice Giants: A General Circulation Model Approach with a Parametrization of Convection, Europlanet Science Congress 2024, Berlin, Germany, 8–13 Sep 2024, EPSC2024-875, https://doi.org/10.5194/epsc2024-875, 2024.

09:35–09:50
|
EPSC2024-859
|
ECP
|
solicited
|
On-site presentation
Gwenaël Milcareck, Sandrine Guerlet, Jérémy Leconte, Franck Montmessin, Aymeric Spiga, Déborah Bardet, and Ehouarn Millour

Flyby of Uranus and Neptune by Voyager 2 in 1986 and 1989 have shown intense zonal circulation and unexpected meteorological activity. Characterized by a prograde jet at mid-latitude in each hemisphere and a retrograde jet centred on the equator, the zonal structure of the wind is similar on these two planets despite very different seasonal radiative forcing. Understanding atmospheric circulation in gas and ice giant planets, with comparative planetology aspects that could be relevant to the exoplanet community is one of the major current challenges in the physics of planetary atmospheres.

To reproduce the zonal jets as well as the strong meteorological activity on Uranus and Neptune, 1° resolution numerical simulations have been performed with a Global Climate Model (GCM) named DYNAMICO Ice Giants Planetary Climate Model. 

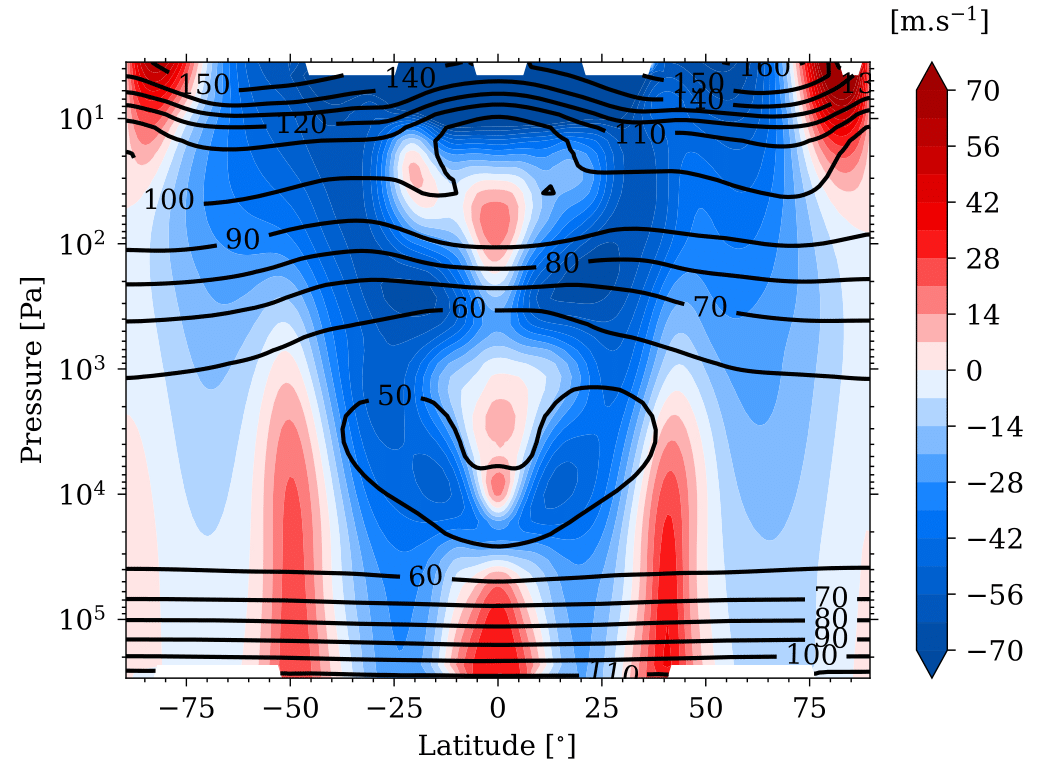
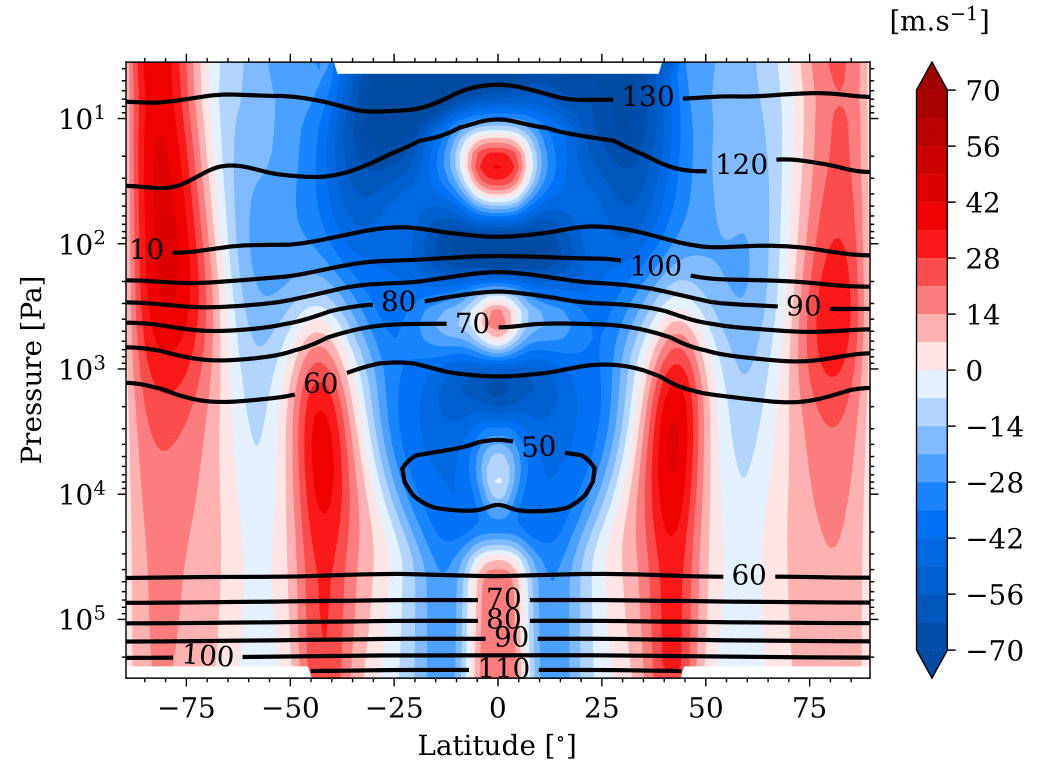
According to our GCM, the zonal wind has a complex structure in altitude on Uranus and Neptune. At the tropopause level (100 hPa), the zonal-mean zonal wind speed averaged over the whole year shows a retrograde jet centred near the equator and a prograde jet at mid-latitudes in each hemisphere on both planets (figure 1 and 2). Although the structure of the jets is qualitatively similar to that observed, the intensity of the jets is much less intense than the values obtained by cloud tracking since the Voyager 2 era. On Neptune, the equatorial retrograde jet observed at -400 m/s only reaches around -50 m/s in our simulations. We also note that the simulated prograde jets are narrower than those observed and that they are incorrectly positioned in latitude. On both planets (particularly Uranus), an equatorial migration of the jets also takes place in our simulations. 

The low intensity of the simulated jets is very similar to that obtained by previous simulations. This similarity between simulations indicates that one or more forcings are missing from these models. One of the forcings currently under investigation is the tropospheric methane meridional gradient which can influence the zonal wind and the thermal structure.

At the same time, we identified an equatorial oscillation on Uranus with a period of one year on average. Temperature anomalies of ~5 to 10 K are observed in connection with this oscillation. On Uranus, the vertical temperature profile obtained looks similar to that obtained from observations at the equator. We identify the local extrema observed on this profile as being possibly the temperature anomalies caused by the equatorial oscillation. 

The meridional thermal structure at higher latitudes is very different from that obtained with a radiative-convective model. Seasonal variations are greatly attenuated by atmospheric dynamics. The meridional and temporal variations observed on Neptune are qualitatively similar to those simulated by our model. 

A meridional circulation has been identified using the Transformed (TEM) and Classical Eulerian Mean (CEM) formalism. In the classical case, a circulation very similar to that deduced from the observations has been reproduced on Uranus. It takes the form of a subsidence at the equator and poles and an upwelling at mid-latitudes. But on Neptune, no coherent circulation cell has been identified using this formalism. In the TEM case, only one direct thermal circulation cell is present on each hemisphere for both planets.


 Figure 1: Vertical cross-section of the zonal-mean zonal wind speed averaged over one year on Uranus. The black lines represent the isotherms.


Figure 2: Same as figure 1 but for Neptune.

How to cite: Milcareck, G., Guerlet, S., Leconte, J., Montmessin, F., Spiga, A., Bardet, D., and Millour, E.: Zonal and meridional circulation on Uranus and Neptune reproduced by a Global Climate Model, Europlanet Science Congress 2024, Berlin, Germany, 8–13 Sep 2024, EPSC2024-859, https://doi.org/10.5194/epsc2024-859, 2024.

09:50–10:00
Coffee break
Chairpersons: Arthur Le Saux, Vincent Hue, Leigh Fletcher
10:30–10:40
|
EPSC2024-1038
|
On-site presentation
Michael Roman, Leigh Fletcher, Heidi Hammel, Patrick Irwin, Oliver King, Naomi Rowe-Gurney, Glenn Orton, Julianne Moses, Henrik Melin, Imke de Pater, and Stefanie Milam

We present observations and analysis of Neptune’s atmosphere from JWST, providing new constraints on hydrocarbon abundances, cloud properties, and temperature structure across the planet’s disk.  Spatially-resolved spectra from JWST NIRSpec (1.6–5.2 µm) and MIRI (4.9–28.5 µm) were acquired in June 2023 and amount to the most comprehensive infrared observations Neptune’s atmosphere since Voyager 2.  We compare these observations and results to similar observations of Uranus made six months prior.

From the ground, spatially resolved observations of Neptune’s mid-infrared emission are limited to imaging targeting the brighter regions of the infrared spectrum (i.e. 8-µm emission from stratospheric methane, 12-µm emission from stratospheric ethane, and 17-25 µm thermal emission from the hydrogen continuum). From space, Voyager provided infrared spectroscopy of Neptune at close proximity in 1989 (after similarly observing Uranus 3 years earlier), but lacked the sensitivity needed to adequately measure mid-infrared emission from stratospheric hydrocarbons.  Between 2004 and 2006, the Spitzer Space Telescope observed both planets' mid-infrared spectra between 7 and 36 µm, but Spitzer lacked the spatial resolution necessary to resolve potential thermal and chemical structure across the disk.

Now, with its exceptional sensitivity and outstanding spatial and spectral resolution, JWST reveals Neptune's stratospheric temperature and chemistry with exquisite new detail, placing new constraints on hydrocarbon abundances, cloud properties, and temperature structure across the disk. In this talk, we introduce these new data along with results of an initial radiative transfer analysis.  We briefly compare and contrast these finding with those of our recent similar analysis of Uranus.

With a projected lifetime of over a decade, JWST promises to continue providing exciting new insights into the atmospheric structure, composition, and variability of the ice giants for years to come.


How to cite: Roman, M., Fletcher, L., Hammel, H., Irwin, P., King, O., Rowe-Gurney, N., Orton, G., Moses, J., Melin, H., de Pater, I., and Milam, S.: Temperature Structure, Chemistry, and Clouds in the Atmosphere of Neptune Revealed by JWST, Europlanet Science Congress 2024, Berlin, Germany, 8–13 Sep 2024, EPSC2024-1038, https://doi.org/10.5194/epsc2024-1038, 2024.

10:40–10:50
|
EPSC2024-992
|
ECP
|
On-site presentation
Óscar Carrión-González, Raphael Moreno, Emmanuel Lellouch, Thibault Cavalié, Sandrine Guerlet, Gwenaël Milcareck, Aymeric Spiga, Noé Clément, Jérémy Leconte, and Arthur Le Saux

Remote-sensing monitoring of Neptune has revealed temperature variations in the atmosphere of the planet [1,2,3,4] since the flyby of Voyager 2 [5]. These variations are not uniform in latitude or pressure level, with the Southern polar region and the stratospheric pressure levels showing higher levels of activity. In this work we present the analysis of ALMA observations of Neptune at the CO(3-2) line at 345.8GHz. These measurements were recorded in 2016 with a spatial resolution of about 0.37” on Neptune’s 2.24” disk. We find that this spectral range is sensitive to Neptune’s upper troposphere and lower stratosphere, probing between about 1 and 10-3 bar.

We developed an MCMC retrieval methodology coupled to a pre-existing radiative transfer code [6] to derive Neptune’s temperature fields and constrain the atmospheric abundance of CO. We explored the correlation between both parameters by carrying out simultaneous retrievals to the temperature and CO abundance, both on disk-averaged and spatially-resolved data. We then explored the latitudinal variations of temperature and derived temperature maps of the planet. We compare these results with previous works in the literature, and discuss the latitudinal variability measured with ALMA.


[1] Orton et al. 2007, A&A 473, L5
[2] Lellouch et al. 2010, A&A 518, L152
[3] Fletcher et al. 2014, Icarus 231, 146–167
[4] Roman et al. 2022, Planet. Sci. J. 3:78
[5] Conrath et al. 1998, Icarus 135, 2, 501–517
[6] Moreno et al. 2017, A&A 608, L5


How to cite: Carrión-González, Ó., Moreno, R., Lellouch, E., Cavalié, T., Guerlet, S., Milcareck, G., Spiga, A., Clément, N., Leconte, J., and Le Saux, A.: Measuring Neptune's temperature maps and CO abundance with ALMA, Europlanet Science Congress 2024, Berlin, Germany, 8–13 Sep 2024, EPSC2024-992, https://doi.org/10.5194/epsc2024-992, 2024.

10:50–11:00
|
EPSC2024-788
|
ECP
|
Virtual presentation
William Saunders, Kunio Sayanagi, Paul Withers, Michael Person, Richard French, and Justin Garland

Background: UV occultations measured by Voyager 2 during its flyby of Uranus in 1986 detected a warm stratosphere and extremely hot thermosphere [1, 2], far in excess of solar irradiance [3, 4] or internal heating [5]. These measurements imply that Uranus has the coldest lower stratosphere and yet the hottest thermosphere of any Solar System planet [6] (see Figure 1, dashed line). Uranus has the weakest internal heat of any of the giant planets [5]. The fundamental lack of understanding about the energy balance of Uranus is an example of the “giant planet energy crisis” [7].

Furthermore, the Voyager 2 UV occultation measurements and models were in stark tension with Earth-based stellar occultations observed between 1977 and 1996. In [8] and [9], we present the results of reprocessing 26 archival occultations using modern techniques. While stratospheric tensions have decreased, thermospheric tensions remain, calling into question the Voyager 2 findings. In [9], we present a new 1-D atmospheric model that successfully reproduces these results.


Aims: We present a new representative temperature-pressure profile for the atmosphere of Uranus from reprocessed stellar occultation observations and 1-D atmospheric modeling [8, 9]. We discuss the energy inputs to the thermosphere, circulation necessary to explain the new profiles, and the significant, potential magnetosphere-ionosphere-thermosphere interactions at Uranus. We describe critical measurements from a likely Uranus Orbiter and Probe (UOP) mission as well as from Earth beforehand that would enable the study of the energy inputs to Uranus.


Prior Results & Conclusions: We reprocessed 26 archival Uranus stellar occultations, which produced temperature-pressure profiles inconsistent with Voyager 2 UVS profiles [8, 9]. A 1-D atmospheric model comprised of radiative-convective and conduction models was developed for Uranus based on these reprocessed profiles. The model reproduces the profiles and suggests a heat sink exists in the lower thermosphere. Figure 1 shows the new reference temperature-pressure profile for Uranus in comparison to the Voyager 2 profile and profiles for other planets.

We conclude that the mesopause of Uranus is likely significantly higher in altitude (~10-4 mbar) than suggested from Voyager 2 profiles (~1 mbar), consistent with the mesopause levels of the other giant planets [9, 10]. We find that the stratosphere of Uranus likely contains a nearly isothermal region, again, consistent with those of the other giant planets [9, 10]. Last, we find that the required thermospheric energy flux is tens of times the solar EUV flux, underscoring the energy crisis and motivating detailed study of energy sources in the Uranian system.


Ongoing Work: Measurements of Jupiter and Saturn have identified an energy crisis similar to that of Uranus. The emerging solution involves gravity waves activity that facilitates heating of the thermospheres by inducing Rayleigh drag in the polar regions. This breaks down the Coriolis force and enables meridional transport of strong auroral [11, 12] heating. While it is likely that Uranus has significant gravity wave activity [13, 14], it is possible that the auroral inputs to Uranus occur around the entire planet and are not limited to the poles [15, 16]. Much work is underway to better understand the shape and behavior of the magnetosphere of Uranus. Gravity waves may also provide the dynamical transport needed to create the heat sink observed in our new 1-D model.

Therefore, additional observations of the prevalence and properties of gravity waves are critical to extending recent modeling work from Jupiter and Saturn to Uranus. While UOP may make many such observations in the 2050s, we outline Earth-based observations that can be made prior.


Upcoming Stellar Occultations: In [17], we predicted Uranus and Neptune occultations 2025 – 2035 that could be observed from the ground and/or from low-Earth orbit. Additional predictions can be found in [18]. The most promising Uranus events occur in 2025, 2031, and 2032. We will describe how we intend to observe the 2025 occultation from ground-based and airborne assets, as well as other upcoming observing campaigns. We will present simulated results for temperature profiles of Uranus as well as gravity wave detections.


The Shadow Chaser: In [17], we outlined the case for a low-Earth orbit small satellite to observe stellar occultations to better constrain the temperature and density profiles of the upper atmosphere of Uranus and to detect gravity waves. This mission concept, called the Shadow Chaser, is being explored at NASA Langley Research Center. By observing above the atmosphere, the Shadow Chaser could observe during the day and would not be impacted by scintillation, greatly increasing signal-to-noise. We will present simulations showing the Uranus profiles that would result from the Shadow Chaser observing the 2031 Uranus event, during which Uranus will occult a 4th magnitude K-band star.


References: [1] Herbert, F. et al. (1987). JGR. [2] Stevens, M. et al. (1993). Icarus. [3] Marley, M. & McKay, C. (1999). Icarus. [4] Li, C. et al. (2018). JQRST. [5] Pearl, J. et al. (1990). Icarus. [6] Young, L. et al. (2001). Icarus. [7] Melin, H. (2020). Nat Astron. [8] Saunders, W. et al. (2023). PSJ. [9] Saunders, W. et al. (2024, under review). PSJ. [10] Mueller-Wodarg et al. (2008). Space Sci Rev. [11] Mueller-Wodarg et al. (2019). Nat Astron. [12] Melin et al. (2020). GRL. [13] French et al. (1982). Icarus. [14] Young et al. (1997). Science. [15] Cohen et al. (2023). GRL. [16] Turner et al. (2024, in review). [17] Saunders, W. et al. (2022). P&SS. [18] French, R. & Souami, D. (2023). PSJ.

How to cite: Saunders, W., Sayanagi, K., Withers, P., Person, M., French, R., and Garland, J.: Revised Upper Atmospheric Temperatures and the Need to Understand Magnetosphere-Ionosphere-Thermosphere Interactions at Uranus , Europlanet Science Congress 2024, Berlin, Germany, 8–13 Sep 2024, EPSC2024-788, https://doi.org/10.5194/epsc2024-788, 2024.

11:00–11:15
|
EPSC2024-1059
|
ECP
|
solicited
|
On-site presentation
Affelia Wibisono, Will Dunn, Graziella Branduardi-Raymont, Bryn Parry, Jenny Carter, Laurent Lamy, Jan-Uwe Ness, Leigh Fletcher, Caitriona Jackman, Sean McEntee, and Henrik Melin

After the discovery that Jupiter’s and Saturn’s atmospheres scatter solar X-rays, it was postulated that Uranus would follow a similar behaviour (Ness & Schmitt 2000). However, Uranian X-rays remained elusive until a few years ago. A 30-ks-long (~0.5 Uranus rotation) observation in 2002 by the Chandra X-ray Observatory (CXO) revealed a statistically significant, but low signal detection of 5 ± 2.2 X-ray photons in the energy range 0.5-1.2 keV (Dunn et al., 2021). The flux measured during this observation was also higher than what models had predicted if these emissions were only due to solar scattering. Chandra’s unrivalled spatial resolution also showed that some of the Uranian X-ray photons may coincide with the planet’s rings. Two further CXO campaigns from 2017 each lasting ~25 ks (~0.3 Uranus rotation) resulted in non-detections of Uranus, however, there were hints of temporal variability in the data. The excess in X-ray flux, timing variability, and location of the X-ray photons suggest that Uranus may have a higher X-ray albedo than its Giant Planet cousins, and/or there are other X-ray production mechanisms at play, such as auroral emissions and ring fluorescence. Both have been witnessed at Jupiter (aurora) and Saturn (ring fluorescence).

A set of three observations were taken by XMM-Newton in August 2022, January 2023 and February 2023. These were much longer in duration than CXO’s with each being 114-126 ks (~1.8-2.0 Uranus rotations) long. After reprocessing the data to Uranus-centric coordinates, the same method as previously used on the CXO dataset (Dunn et al., 2021) and on Saturn X-ray studies (Ness & Schmitt 2000; Weigt et al., 2021) were used to compare the number of Uranian X-ray photons with energies between 0.4-1.0 keV with the background counts. In chronological order, each observation gave counts of 35 ± 5.9, 62 ± 7.9, and 21 ± 4.6 and were 5.0, 6.0, and 2.0 median absolute deviations away from the median of the respective background counts.

Despite soft proton events significantly contaminating 50% of the total exposure time, spectra and ligthtcurves from XMM-Newton’s European Photon Imaging Camera (EPIC) instrument were extracted from each observation.  We present our initial results of the XMM-Newton dataset and highlight whether the European Space Agency’s flagship X-ray observatory’s superior sensitivity and spectral resolution can constrain the atomic composition of the Uranian rings and upper atmosphere and through detecting Solar Wind Charge Exchange X-rays, explore whether the Uranian aurorae are from the planet’s cusps.

How to cite: Wibisono, A., Dunn, W., Branduardi-Raymont, G., Parry, B., Carter, J., Lamy, L., Ness, J.-U., Fletcher, L., Jackman, C., McEntee, S., and Melin, H.: Characterising the X-ray Emissions from Uranus, Europlanet Science Congress 2024, Berlin, Germany, 8–13 Sep 2024, EPSC2024-1059, https://doi.org/10.5194/epsc2024-1059, 2024.

11:15–11:20
11:20–11:30
|
EPSC2024-119
|
On-site presentation
Víctor Apéstigue, Daniel Toledo, and Ignacio Arruego and the UMR Team

The present understanding of Uranus and Neptune has been derived primarily from terrestrial observations and observations conducted using space telescopes. Furthermore, a brief flyby conducted by the Voyager 2 spacecraft nearly three decades ago has contributed to our knowledge of these celestial bodies. Recently, the Decadal Survey [1] has identified a mission to Uranus as a high-priority objective for NASA's space exploration program and its ongoing missions to Mars and Europa.

The main mission study [2] establishes the scientific priorities for an orbiter, including analyzing the planet's bulk composition and internal structure, magnetic field, atmosphere circulation, rings, and satellite system. On the other hand, the mission includes a descent probe, whose primary mission is obtaining data on the atmospheric noble gas abundances, noble gas isotope ratios, and thermal structure using a mass spectrometer and a meteorological package.

Investigation of the vertically distributed aerosols (hazes and clouds) and their microphysical and scattering properties is required to comprehend the thermal structure and dynamics of Uranus' atmosphere. These aerosols play a crucial role in the absorption and reflection of solar radiation, which directly influences the planet’s energy balance. In this work, we present a lightweight radiometer instrument [3] to be included in the descent probe for studying the aerosols in the first km of the Uranus’ atmosphere.

The UMR, the Uranus Multi-experiment Radiometer, takes its heritage from previous missions for Mars exploration [4-6], where its technology, including mixed-signal ASICs radiation hardened by design [7-8], has demonstrated its endurance for extreme environments of operation, using limited resources in terms of power consumption, mass and volume footprints, and data budget. These characteristics make this instrument a valuable probe’s payload for studying Uranus’ atmosphere with a high scientific return.

In this contribution, we will present the actual design of the instrument and the future perspective before a possible announcement of opportunity.


References:[1] National Academies of Sciences, Engineering, and Medicine 2022. Origins, Worlds, and Life: A Decadal Strategy for Planetary Science and Astrobiology 2023-2032 [2] Simon et al. [3] Apéstigue et al 2024. Space Science Reviews. [4] I. Arruego et al. DREAMS-SIS. ASR 2017. 60 (1): 103-120. [5] Apestigue, V. et al 2022. Sensors [6] Pérez-Izquierdo, J., Sebastián, E, et al. 2018 [7] S. Sordo-Ibáñez et al 2016. [8] S. Sordo-Ibáñez et al 2015.


How to cite: Apéstigue, V., Toledo, D., and Arruego, I. and the UMR Team: The UMR: Uranus Multi-Experiment Radiometer for Haze and Clouds Characterization, Europlanet Science Congress 2024, Berlin, Germany, 8–13 Sep 2024, EPSC2024-119, https://doi.org/10.5194/epsc2024-119, 2024.

11:30–11:40
|
EPSC2024-235
|
On-site presentation
Olivier Mousis and the GEPP team

The international consortium GEPP has been set to conceptualize probe designs with appropriate payloads that would remain within the typical budget allocated for ESA M-class missions (currently 500 M€). The aims of the consortium are i) to conceptualize a line of generic planetary entry probes, ii) to make the international science community, ESA and its member states, conscious that there is an opportunity to supply a series of entry probes as part of future international collaborations, and iii) to demonstrate that an M-class budget could possibly fund several entry probes with well-prioritized science objectives. A line of conceptualized generic planetary entry probes could be targeted to the giant planets with very few modifications, and collaborations could include the future NASA flagship mission towards Uranus (Uranus Orbiter Probe) or to any future NASA-led mission to the outer planets for an affordable budget. The model payload capabilities of each concept will be defined according to a carefullydesigned science traceability matrix. Two extreme concepts shall be investigated by the GEPP Consortium, namely a highly capable parachute-descent probe including a typical payload of 30 kg of scientific instruments down to 10 bars, and a smaller parachute-descent probe designed to address top priority science objectives with selected key measurements that would address the ESA Voyage 2050 science objectives. This presentation will detail the scientific objectives for each entry probe concept design, as well as the content, organization and planning of the study, which is assumed to be completed by the end of 2025.


How to cite: Mousis, O. and the GEPP team: Generic Entry Probe Program (GEPP) – an international initiative promoting the development of European descent modules dedicated to the in situ exploration of giant planets, Europlanet Science Congress 2024, Berlin, Germany, 8–13 Sep 2024, EPSC2024-235, https://doi.org/10.5194/epsc2024-235, 2024.

11:40–11:50
|
EPSC2024-667
|
ECP
|
On-site presentation
Christopher Mankovich, Jim Friedson, Marzia Parisi, Mark Hofstadter, Stephen Markham, and Matthew Hedman
The detection of Uranus normal mode oscillations would provide hugely valuable diagnostics for ice giant interior structure. Since oscillation modes are generally sensitive to fluid stability, and low angular degree modes reach deep into the interior, their frequencies can deliver powerful information independent of that from the improved gravity field measurements we expect from radio tracking of the spacecraft1. Here we explore two methodologies for seismology of Uranus by an orbiting spacecraft.

First, ring seismology uses stellar occultation or imaging data to uncover resonances between non-radial planetary normal modes and ring orbits. This has been successful at Saturn, where the planet's oscillating gravity field generates waves near epicyclic (Lindblad) or vertical resonances2-8. For Uranus's system of predominantly narrow (1-10 km scale) rings, ring seismology would entail the search for m-lobed standing patterns on Uranus's narrow rings that betray the influence of gravitational forcing near a resonance. The resonant shepherding of the Epsilon ring by the moons Cordelia and Ophelia is a striking example of confinement of a narrow Uranian ring9, but the mechanism confining up to 8 other rings is unknown10, and a rich spectrum of Uranian oscillations may be partly responsible.

Uranus interior models that satisfy all available data predict that the narrow rings overlap with Uranian fundamental modes and internal gravity modes11, as well as inertial modes. We model the mode spectrum in a set of new Uranus interior models to quantify the constraining power than one or two ring seismology detections in the Uranian rings would have for Uranus interior structure.

Second, Doppler imaging seismology would produce a time series of radial velocity maps of the Uranian photosphere, from which frequencies of normal modes could be extracted. The radial velocity signal is likely dominated by the higher frequency pressure (p) modes, i.e., trapped sound waves, the type of mode responsible for the 5-minute oscillation in the sun. We show how frequency measurements for a set of p modes with consecutive radial order can be used to construct an échelle diagram, where deviations from constant frequency spacing are sensitive diagnostics of composition or sound speed interfaces in the planetary interior.

The modest requirements of ring seismology stand in contrast to Doppler imaging's requirement for dedicated instrumentation (in the form of an interferometer or magneto-optical filter design) and more substantial payload. This will need to be weighed against the advantage that p modes offer for localizing features in the planetary interior (especially when combined with inversion techniques12) and synergies with other science areas, especially atmospheric dynamics13.

Further insights into the Uranian normal mode spectrum may be obtainable from direct gravitational seismology, i.e., the detection of modes through their gravitational influence on the trajectory of the spacecraft itself14,15. This builds on the tentative evidence for Jupiter and Saturn seismicity in the Doppler tracking of the Juno and Cassini spacecraft16,17.
 
References:
[1] Parisi et al. 2024, PSJ; doi:10.3847/PSJ/ad4034
[2] Marley & Porco 1993, Icarus; doi:10.1006/icar.1993.1189
[3] Hedman & Nicholson 2013, AJ; doi:10.1088/0004-6256/146/1/12
[4] Hedman & Nicholson 2014, MNRAS; doi:10.1093/mnras/stu1503
[5] French et al. 2019, Icarus; doi:10.1016/j.icarus.2018.10.013
[6] Hedman et al. 2019, AJ; doi:10.3847/1538-3881/aaf0a6
[7] French et al. 2021, Icarus; doi:10.1016/j.icarus.2021.114660
[8] Hedman et al. 2022, PSJ; doi:10.3847/PSJ/ac4df8
[9] Porco & Goldreich 1987, AJ; doi:10.1086/114354
[10] French et al. 2024, Icarus; doi:10.1016/j.icarus.2024.115957
[11] A'Hearn et al. 2022; doi:10.3847/PSJ/ac82bb
[12] Jackiewicz et al. 2012, Icarus; doi:10.1016/j.icarus.2012.06.028
[13] Schmider et al. 2024, PSJ; doi:10.3847/PSJ/ad3066
[14] Friedson 2020, Ph. Tr. R. Sc. A; doi:10.1098/rsta.2019.0475
[15] Parisi et al. 2024, in preparation
[16] Durante et al. 2022, Nat. Co.; doi:10.1038/s41467-022-32299-9
[17] Markham et al. 2020, PSJ; doi:10.3847/PSJ/ab9f21

How to cite: Mankovich, C., Friedson, J., Parisi, M., Hofstadter, M., Markham, S., and Hedman, M.: Ring and Doppler Imaging Seismology from a Uranus Orbiter: Promise and Challenges, Europlanet Science Congress 2024, Berlin, Germany, 8–13 Sep 2024, EPSC2024-667, https://doi.org/10.5194/epsc2024-667, 2024.

11:50–12:00

Posters: Tue, 10 Sep, 14:30–16:00 | Poster area Level 2 – Galerie

Display time: Tue, 10 Sep, 08:30–Tue, 10 Sep, 19:00
Chairperson: Vincent Hue
P71
|
EPSC2024-990
|
ECP
|
On-site presentation
Thomas Thévenet, Sandro Scandolo, Alexis Markovits, and Flavio Siro Brigiano

Little is known about the chemical transformations occurring within the interiors of Uranus and Neptune, the two icy giants of our solar system. Indeed, the extreme pressure and temperature conditions, reaching millions of atmospheres and thousands of kelvins respectively, make spacecraft exploration impossible. It is believed that between the atmosphere and the rocky core of these planets lies a dense fluid predominantly composed of a planetary mixture of water, methane, and ammonia, with pressures ranging from 1 to 1000 GPa and temperatures from 1000 to 8000 K. Understanding the transformations underlying the chemistry of the planetary mixture in extreme conditions could provide valuable insights for rationalizing some of the physical properties of these planets. In this regard, an intriguing hypothesis, known as the "diamonds in the sky hypothesis," suggests that the formation of diamonds and superionic water from the planetary mixture could provide a rationalization for the unusual magnetic field and luminosity of icy giants.

This hypothesis has been supported by numerous experimental works based on Laser Heated Diamond Anvil Cells (LHDAC) techniques, which have provided evidences of nanodiamond formation from various C/H/O mixtures in extreme conditions. Additionally, theoretical studies based on ab initio molecular dynamics have provided insights into the physical properties of the planetary mixtures, such as the lifetime of chemical bonds, bandgap, and Hugoniot curves. However, the limited accessible timescale in the case of ab initio MD and the challenges in characterizing the process "in situ" from experiments have hindered the exploration of the mechanisms and free energies underlying the transition from C/H/O/N and C/H/O planetary mixtures to nanodiamond.

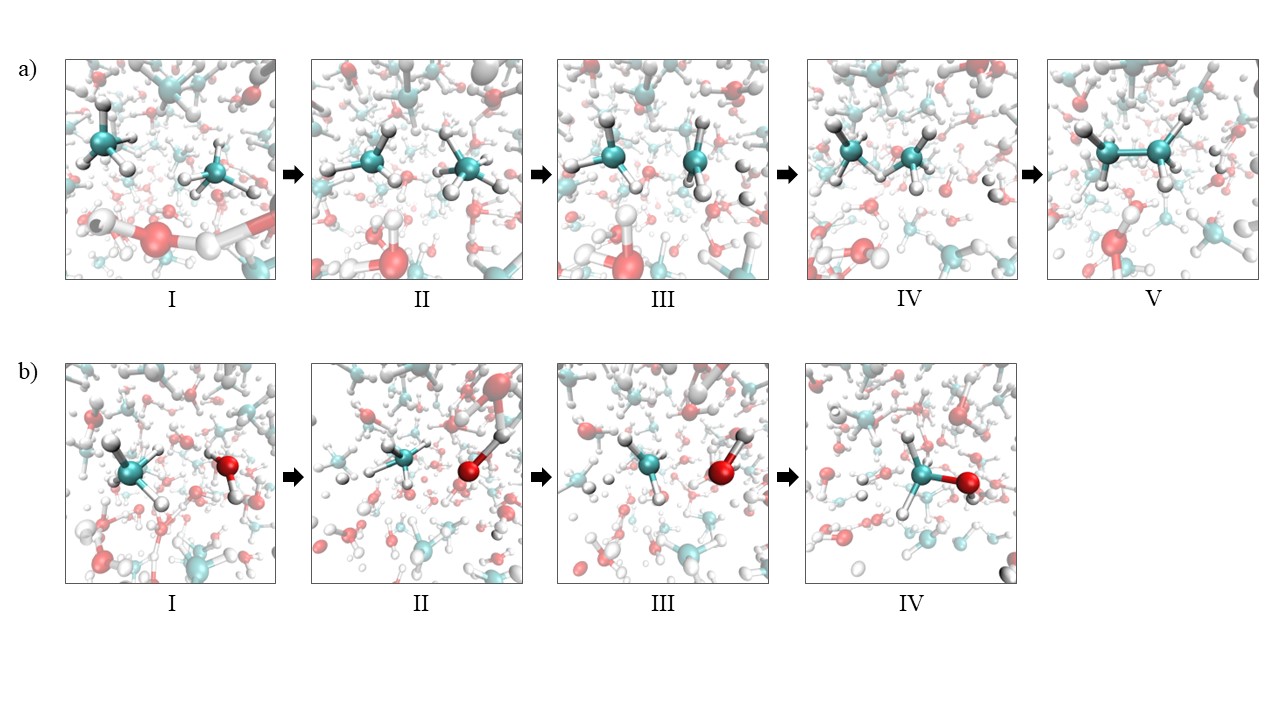
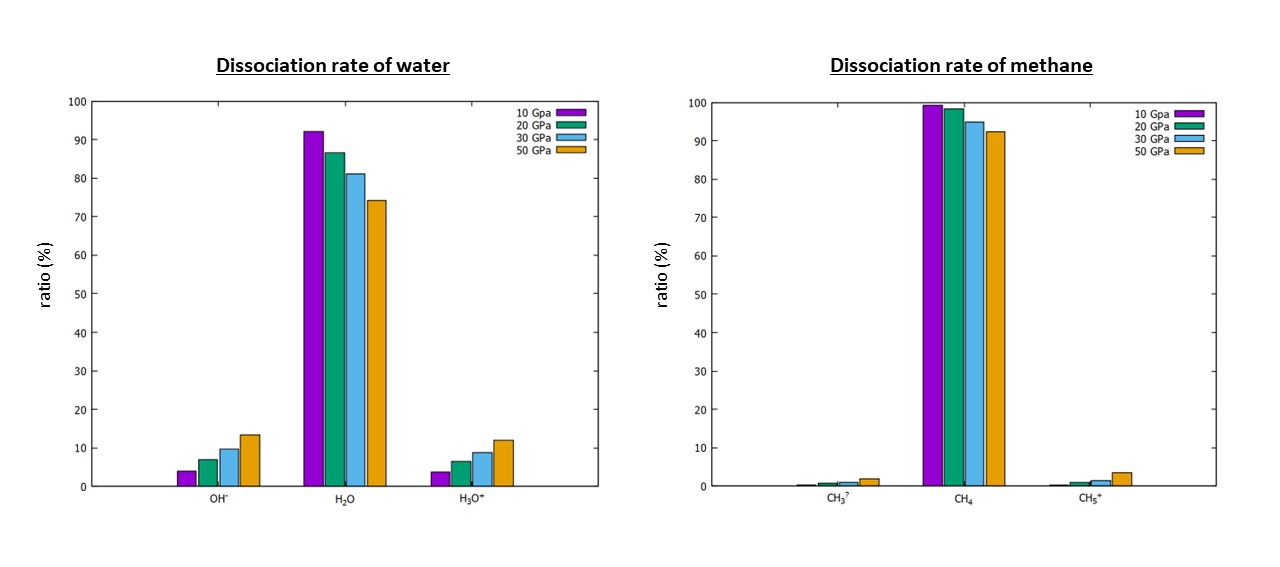
In the poster, I will present the results of our computational study on characterizing the reaction pathways starting from water/methane mixtures and leading to diamond clusters, from both a mechanistic and thermokinetic perspective. To achieve this, we developed a computational protocol combining ab initio MD, enhanced sampling techniques (metadynamics, umbrella sampling), and shooting techniques (committor analysis). The enhanced sampling techniques allowed us to explore the reactivity of the planetary mixture, overcoming current limitations in time-scale and directly considering the effects of pressure and temperature on the computed mechanism and associated free energies. Analysis of the shooting trajectories, along with electronic topological descriptor analysis (ELF and Wannier analysis), refined the transition pathways and characterized the structure and electronic properties of the transition states. Numerous simulations were conducted to cover the P-T thermodynamics diagram of the planetary mixture in the 5-90 GPa and 1500-3500 K ranges. Observation of unbiased MD trajectories and free energy estimations revealed that diamond cluster formation from CH4/H2O is possible above 3000 K and 30 GPa. Under these conditions, as carbon growth progresses, the formation of alcohols and hydrocarbons of increasing complexity is observed through reactions of chain elongation, branching, and cyclization. These reactions are predominantly dictated by a carbocation chemistry, involving the formation of transient (highly reactive) carbocation intermediates and the production of molecular hydrogen. Our simulations reveal that water plays a key role in this process. Specifically, the formation of reactive carbocation intermediates, directly responsible for the observed carbon growth, is facilitated by a proton transfer from a hydronium ion (H3O+) to the carbon of a hydrocarbon or alcohol species. We find that the ease of such exotic C-O proton transfer is directly related to the degree of water dissociation in such extreme conditions.

Fig1. Panel a : Snapshots of reactive structures along the observed formation of ethane. The methyl cation CH3+ (structure III), formed by the dissociation of the intermediate CH5+ ion (structure II) with release of an H2 molecule, reacts with a methane molecule (structure IV) to formed ethane with release of an H+ ion (structure V). Panel b : Snapshots of reactive structures along the observed formation of methanol. The methyl cation CH3+ (structure III), formed directly with release of an H2 molecule, reacts with a water molecule to formed methanol with release of an H+ ion (structure IV).


Fig2. Effect of pressure on the dissociation rate of both water and methane from 10 GPa to 50 GPa at 3000 K.

How to cite: Thévenet, T., Scandolo, S., Markovits, A., and Siro Brigiano, F.: Early Stages of Diamond Rain formation in Icy Giants, Europlanet Science Congress 2024, Berlin, Germany, 8–13 Sep 2024, EPSC2024-990, https://doi.org/10.5194/epsc2024-990, 2024.

P72
|
EPSC2024-319
|
On-site presentation
Olivier Mousis, Antoine Schneeberger, Thibault Cavalié, Kathleen Mandt, Artyom Aguichine, Jonathan Lunine, Tom Benest Couzinou, Vincent Hue, and Raphael Moreno

This study aims to predict the bulk volatile compositions of Uranus and Neptune, aligning with the preparatory framework for the Uranus Orbiter Probe mission. We employ a protoplanetary disk model to trace the evolution of volatile species through vapor, dust, and pebble transport. It is assumed that both planets formed near the CO iceline in the protosolar nebula, in a way consistent with interior models reconciling heavy element abundances with measured atmospheric D/H ratios.

The time-dependent abundances of primary volatile species are calculated at the CO iceline location, gradually evolving inward. This yields abundance ratios of key elements, including heavy noble gases, within Uranus and Neptune's feeding zones. Predictions for their deep compositions are formulated, assuming negligible compositional gradients in the envelope.

Despite potential interior heterogeneity, estimates of the Xe/Ar or Kr/Ar abundance ratios prove valuable for evaluating our model. This is due to the absence of known differentiation mechanisms among these noble gases while they remain in vapor form within the atmospheres.

How to cite: Mousis, O., Schneeberger, A., Cavalié, T., Mandt, K., Aguichine, A., Lunine, J., Benest Couzinou, T., Hue, V., and Moreno, R.: Elemental Composition of Uranus and Neptune: Insights from Building Blocks, Europlanet Science Congress 2024, Berlin, Germany, 8–13 Sep 2024, EPSC2024-319, https://doi.org/10.5194/epsc2024-319, 2024.