
Ter-diurnal Thermal Tide on Mars
 1,1,4,
- 1Finnish Meteorological Institute, Finland (joonas.leino@fmi.fi)
- 2NASA Ames Research Center, Moffett Field CA, USA
- 3Cornell University, Cornell Center for Astrophysics and Planetary Science, Ithaca, NY, USA
- 4Space Science Institute, Boulder, CO, USA
- 5Centro de Astrobiologia (INTA-CSIC), Madrid, Spain
- 6Institute for Atmospheric and Earth System Research, Helsinki, Finland
Introduction
Cyclic absorption of solar radiation generates oscillations in atmospheric fields. These oscillations are called atmospheric or thermal tides, which are furthermore modified by topography, surface properties, and atmospheric absorber concentration. This leads to a complex mix of sun-synchronous and non sun-synchronous tides that propagate around the planet eastward and westward. A major aspect of the study is to obtain some global insight into the Martian atmospheric ter-diurnal oscillations seen at a very small collection of lander sites using a Mars Climate Database (MCD) General Circulation Model (GCM).
Observations and Methods
Here we used hourly binned surface pressure observations by Mars Science Laboratory (MSL), InSight, Viking Lander (VL) 1, and VL2 to calculate harmonic components with a Fast Fourier Transform (FFT) for each location. A window of three sols was used to get at least one observation for each hour. The binned value was averaged in case of multiple observations per hour. Amplitudes and phases were then calculated for the middle sol of the three-sol window. The analysis was performed for each station by sliding the window over all the pressure data that was available for each platform.
For the MCD GCM surface pressure data, we used a similar approach except that one-sol window was used for each location. These global GCM fields allow for mapping of the evolving tide harmonic results and, further, decomposing these into constituent eastward and westward propagating components. That was done by taking a 2D FFT (in time and longitudes) for the diurnal pressure fields. Moreover, we used special GCM simulations with and without the effect of radiative heating by water ice clouds provided by the LMD team.
Results
MSL and InSight showed very similar seasonal cycles with highest ter-diurnal amplitudes at about Ls 60◦ , Ls 130◦ , and Ls 320◦ (Figure 1) . The latest amplitude peak corresponds to a ”C” dust storm and is also visible in the diurnal and semi-diurnal tidal amplitudes. However, during the ”A” dust storm (at about Ls 230◦) neither platforms detected amplitude spikes. Observed VL1 and VL2 ter-diurnal amplitudes seem to be lacking a clear structure, but VL1 showed quite repeatable and similar pattern as MSL and InSight during the first half of the year. In addition, global dust storms during MY 12 (1977b) and 15 were clearly detected by the ter-diurnal tide amplitude. However, ter-diurnal amplitude did not show a clear response during the 1977a planet-encircling dust storm. The global dust storm during MY 34 was visible in the MSL pressure data demonstrating the highest ter-diurnal amplitude during the MSL mission by now.
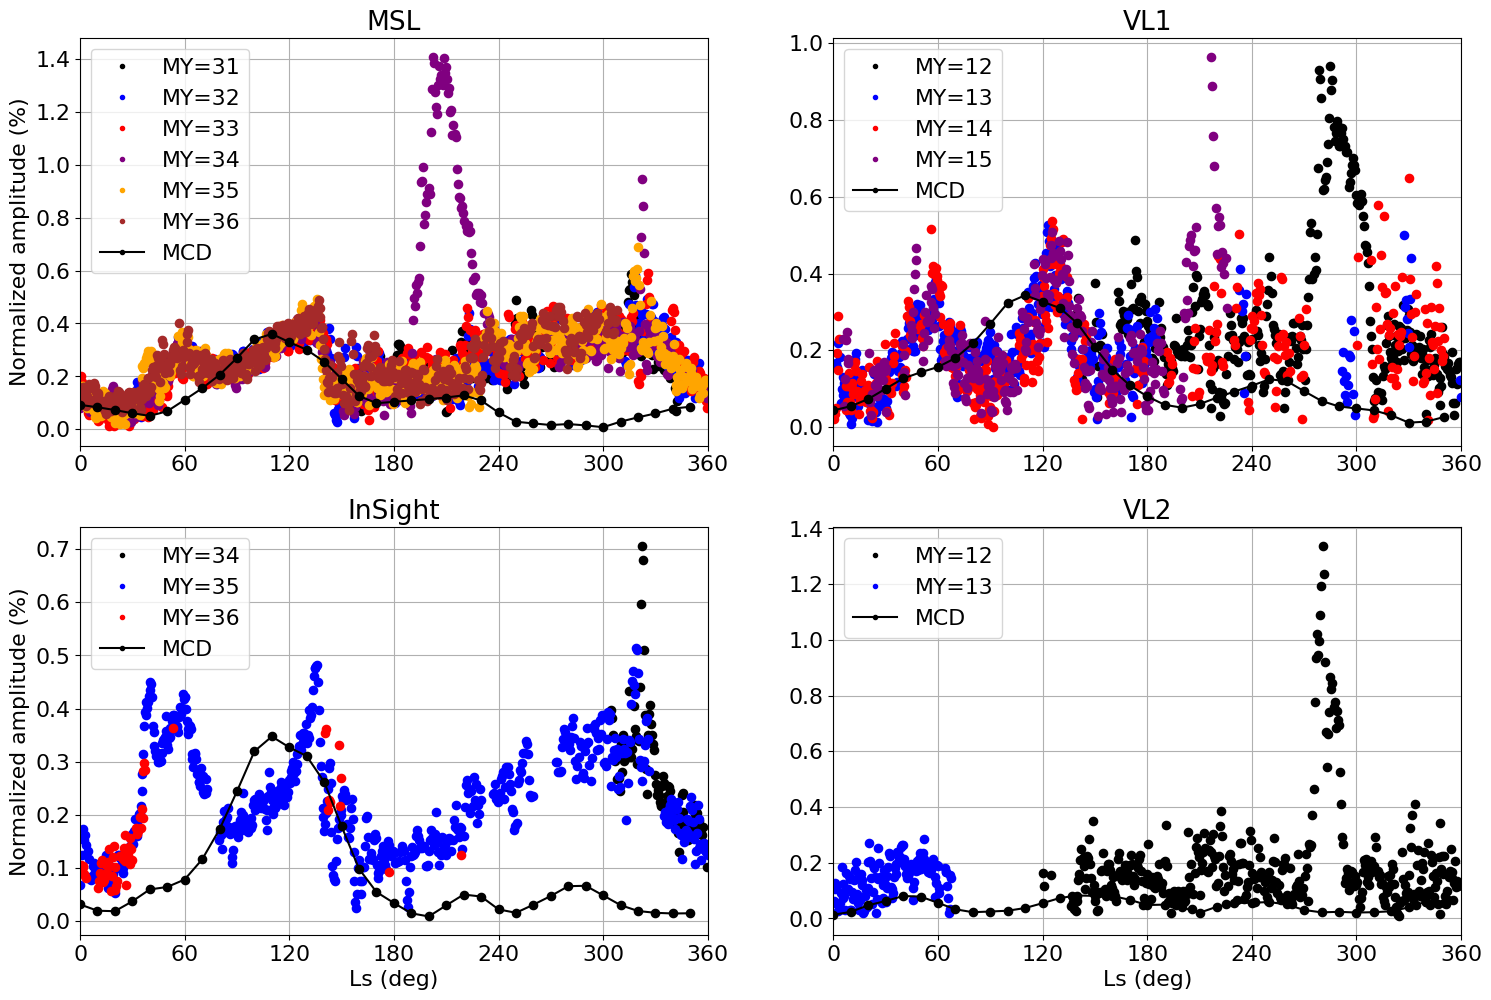 Figure 1: Ter-diurnal amplitudes (normalized by the diurnal mean pressure, %) from the MSL, InSight, VL1, and VL2 observations as well as from MCD as a function of the season (Ls).
MSL and InSight showed very similar pattern in ter-diurnal phases as well, with values between 05-07 LTST most of the year and 08-10 LTST during Ls 60◦-120◦ (Figure 2). Phases observed by the Viking Landers were lacking a clear structure, but VL1 showed some pattern at the start of the year. The phases predicted by the MCD data were in quite good agreement with observations, except for the MSL.
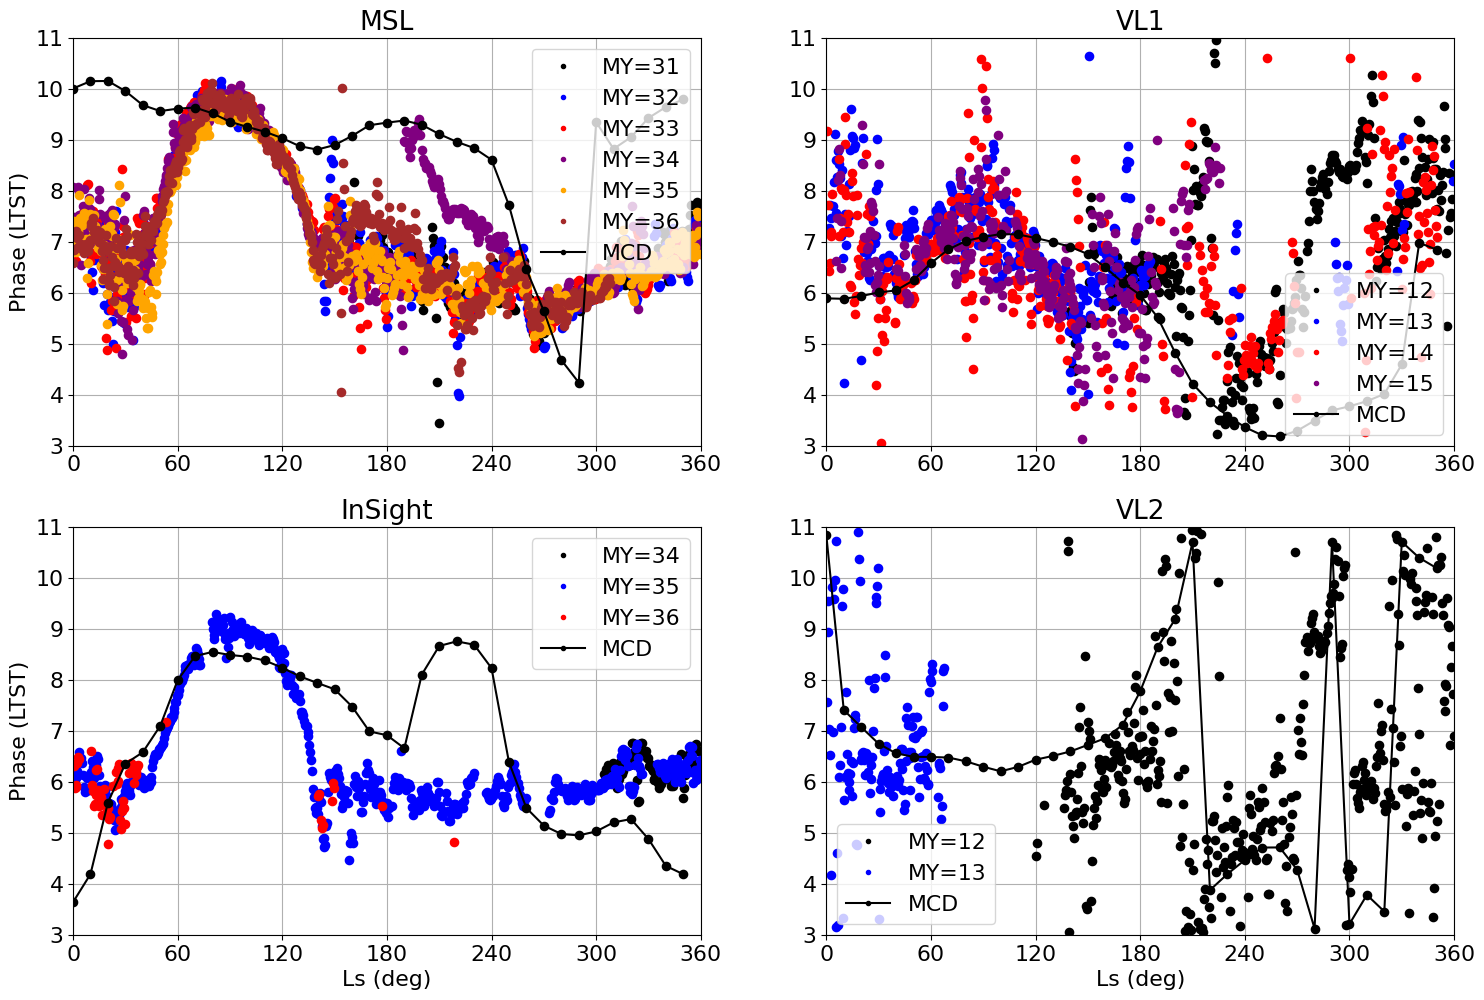
Figure 2: Same as Figure 1 but for the ter-diurnal phases (LTST).
Overall, calculations on MCD pressure data seem to underestimate ter-diurnal amplitudes throughout the year, especially during the dusty season. Globally, MCD predicted weakest amplitudes at the equinoxes, while strongest ones were predicted in summertime for both hemispheres with a clear wavenumber 6 pattern in longitude during northern hemisphere summer (Ls 90◦, Figure 3). During this time, model results suggest that the two most prominent modes are the sun-synchronous ter-diurnal tide (TW3) and an eastward propagating TE3 tide. The meridional structure of TE3 (Figure 4) mode is characteristic of a resonantly-enhanced Kelvin wave, with a uniform latitude structure.
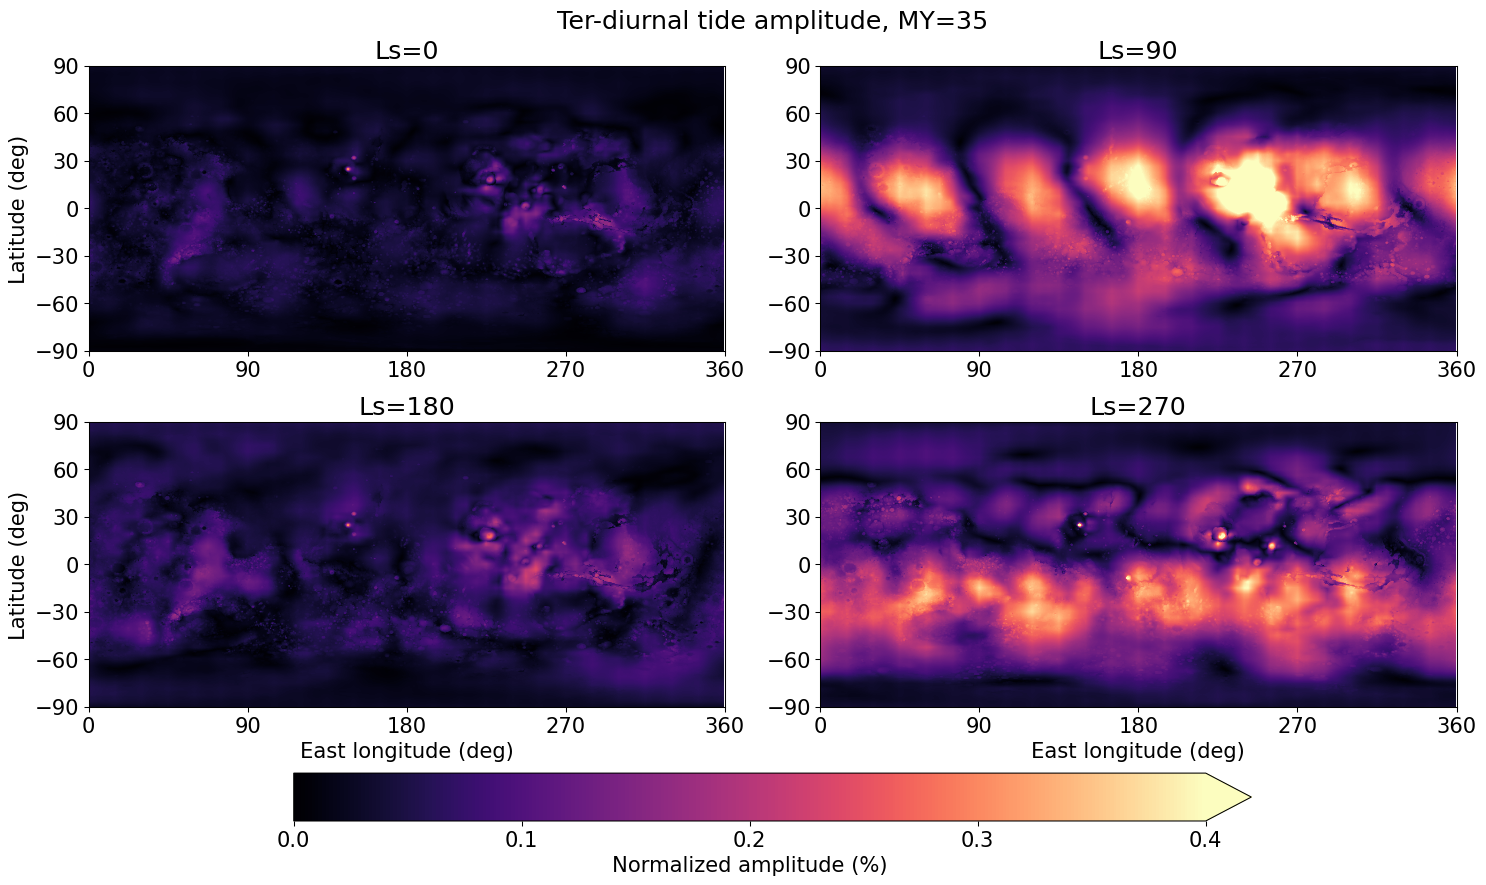
Figure 3: Global ter-diurnal tide normalized amplitudes from the Mars Climate Database for Ls 0◦, Ls 90◦, Ls 180◦, and Ls 270◦.

Figure 4: Ter-diurnal amplitudes for westward (TW) and eastward (TE) propagating zonal wavenumber 1–4 components as a function of latitude from the MCD for each season.
Additional GCM simulations with and without radiative active water ice clouds suggest that TE3 mode amplitude peaks at the equator and is much less prominent without radiatively active water ice clouds (Figure 5). Moreover, the observed delay and advance of the ter-diurnal phase (Figure 2), as well as the amplitude patterns (Figure 1) indicate that the TE3 mode has a characteristic of the resonantly-enhanced ter-diurnal Kelvin wave. This is because MSL/InSight and VL1 are separated by about 180 degrees of longitude, and therefore the phase deviation due to the Kelvin wave would be similar at the 3 locations, as seen in the data. Interaction between solar radiation and zonal wave 6 variations in topography and surface properties (thermal inertia and albedo) may generate this mode. By contrast, TW3 tide was stronger away from the equator and was present for a much longer fraction of the year (Figures 4 and 5). This component may be a result of direct solar forcing or nonlinear interaction between diurnal and semi-diurnal tides.
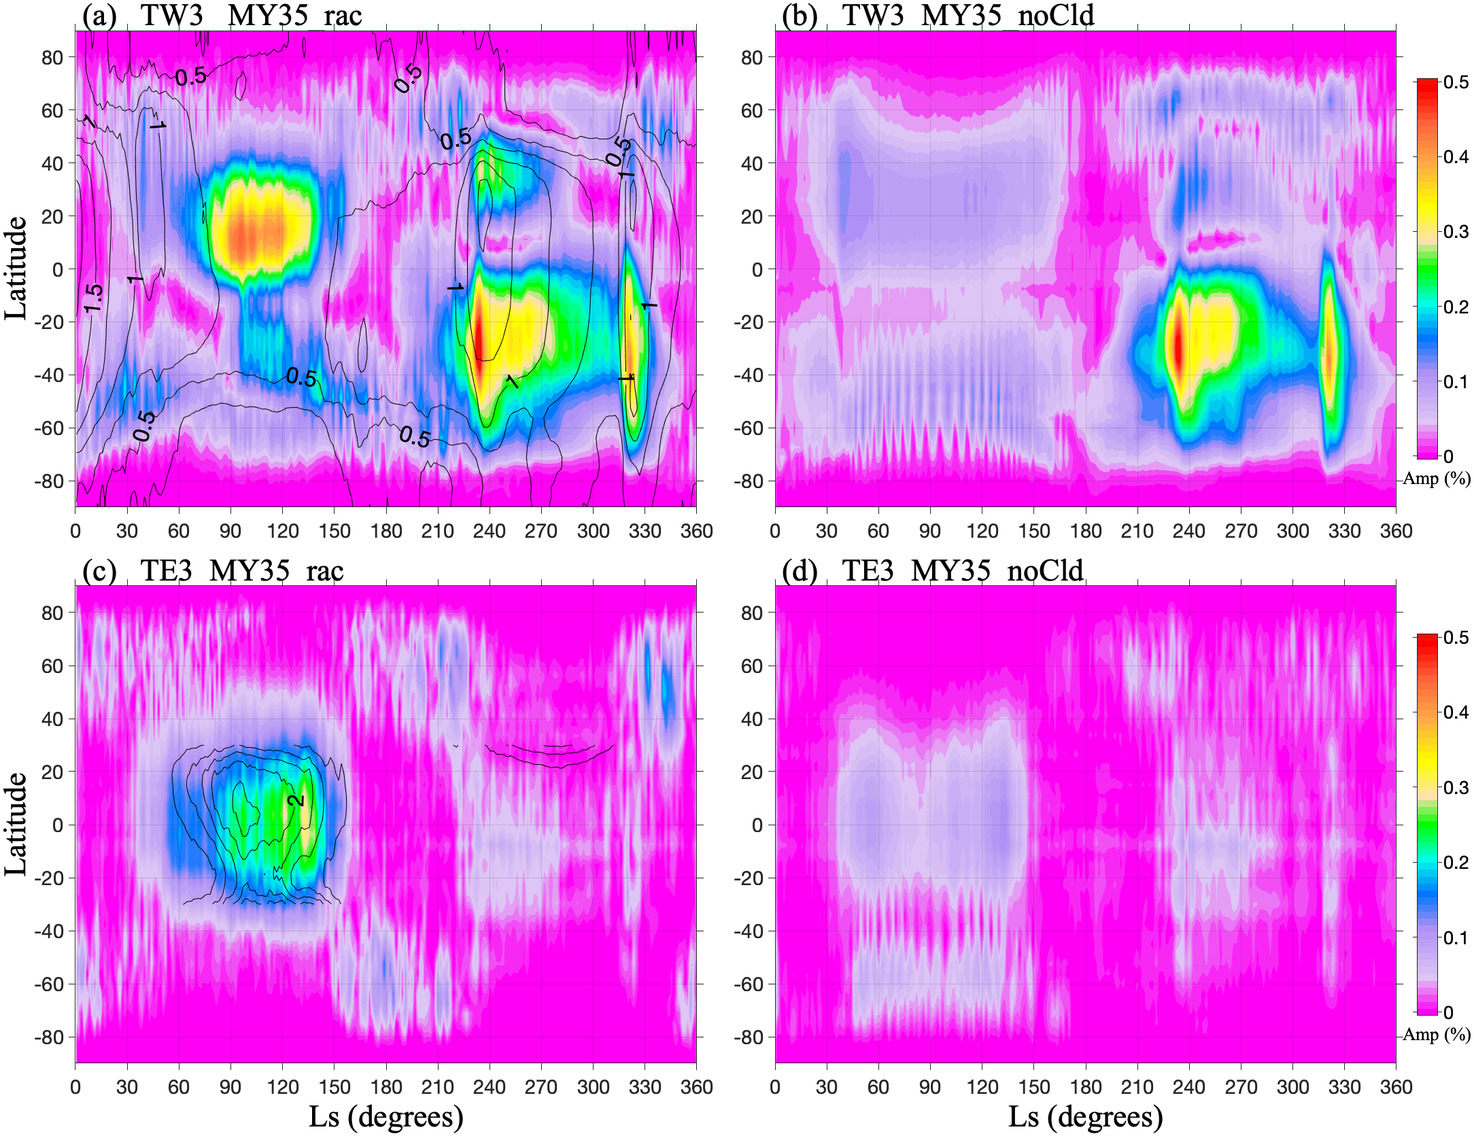
Figure 5: Seasonal normalized amplitude evolution of TW3 and TE3 modes with (left panel) and without (right panel) the effect of radiative heating by water ice clouds from the LMD GCM simulation. Dust column opacity contours are shown on the TW3 field and water ice cloud contours (limited to tropics) are shown on the TE3 field.
Based on this investigation, it seems to be reasonable to infer that ter-diurnal tide has a seasonal cycle at least near the equator, which is strongly influenced by water ice clouds. Nonetheless, the amplitude is typically lower than that for the diurnal and semi-diurnal tides. Definitely more modeling studies are needed to understand the behavior and forcing mechanisms of this important component of the Martian atmospheric tide.
Reference
Joonas Leino, Ari-Matti Harri, John Wilson, et al. Ter-diurnal Atmospheric Tide on Mars. ESS Open Archive . April 26, 2024. DOI: 10.22541/essoar.171415900.05448468/v1
How to cite: Leino, J., Harri, A.-M., Wilson, J., Banfield, D., Lemmon, M., Paton, M., Rodríguez-Manfredi, J., and Savijärvi, H.: Ter-diurnal Thermal Tide on Mars, Europlanet Science Congress 2024, Berlin, Germany, 8–13 Sep 2024, EPSC2024-36, https://doi.org/10.5194/epsc2024-36, 2024.