
Monitoring Martian Atmospheric Dust using Multi-annual, Multi-instrument Orbital Observations
 1,2,3,4,6,2,7,3
- 1Centre for Mars Meteorology Monitoring, Paneureka, Le Bourget-du-Lac, France (lmontabone@paneureka.org)
- 2LMD/IPSL/CNRS/Sorbonne Université , Paris, France
- 3Space Science Institute, Boulder, CO, USA
- 4Department of Astronomy and Planetary Science, Northern Arizona University, Flagstaff, AZ, USA
- 5Jet Propulsion Laboratory/California Institute of Technology, Pasadena, CA, USA
- 6National Space Science & Technology Center, UAE University, Al Ain, UAE
- 7NASA Goddard Space Flight Center, Greenbelt, MD, USA
Introduction: We have currently accumulated over 25 years of continuous satellite data on Martian dust and, generally, on the weather of the Red Planet. By utilizing data from instruments operating in the thermal infrared such as the Thermal Emission Spectrometer (TES, onboard the Mars Global Surveyor satellite), Thermal Emission Imaging System (THEMIS, onboard Mars Odyssey), and Mars Climate Sounder (MCS, onboard the Mars Reconnaissance Orbiter), we have been able to reconstruct diurnal maps of column dust optical depth (CDOD) spanning more than 13 Martian years (MY) from 1999 to the present day [1, 2, 3, 4, 5]. Two types of maps exist: ‘gridded maps’ (the mesh is regular but values are missing where there are no observations) and ‘kriged maps’ (interpolated from the gridded maps using kriging to produce complete maps). These longitude-latitude maps are used as 'dust scenario' in the Mars Climate Database [6], among many other applications. They are routinely updated and made publicly available in NetCDF or FITS formats (see the links to the datasets in the acknowledgments section).
Recent developments: The daily CDOD maps covering MY 24 through part of MY 27 have been recently improved by using revised retrievals of column dust optical depths from TES observations (refer to the link in the acknowledgments section for accessing this updated dataset). The top four panels of Figure 1 (MY 24, 25, 26, 27) show zonal means of these improved CDOD maps normalized to 610 Pa (MY 27 zonal mean is actually a combination of revised TES-based maps and previous THEMIS-based maps).
The arrival of the Emirates Mars Mission (EMM) 'Hope' spacecraft in a low-inclination, high-altitude orbit around Mars has enabled simultaneous monitoring of the full disk of the Martian atmosphere. The CDOD retrievals from the Emirates Mars InfraRed Spectrometer (EMIRS) observations significantly enhance the quality of our dust maps, enabling for the first time quasi-continuous monitoring of storms over multiple local times [7]. The bottom two panels of Figure 1 show zonal means of, respectively, MCS-based maps and EMIRS-based maps for MY 36. Work is in progress to 1) understand the differences, and 2) integrate CDOD information from both MCS and EMIRS to produce combined daily maps.
Moreover, the availability of visible images from the EMM/Emirates Exploration Imager (EXI) on one side [8], and retrievals of CDOD in the visible from TES Emission Phase Function (EPF) observations on the other (refer to the link in the acknowledgments section for access to this novel dataset), enables cross-comparison and validation of the daily gridded dust maps with an unprecedented level of detail.
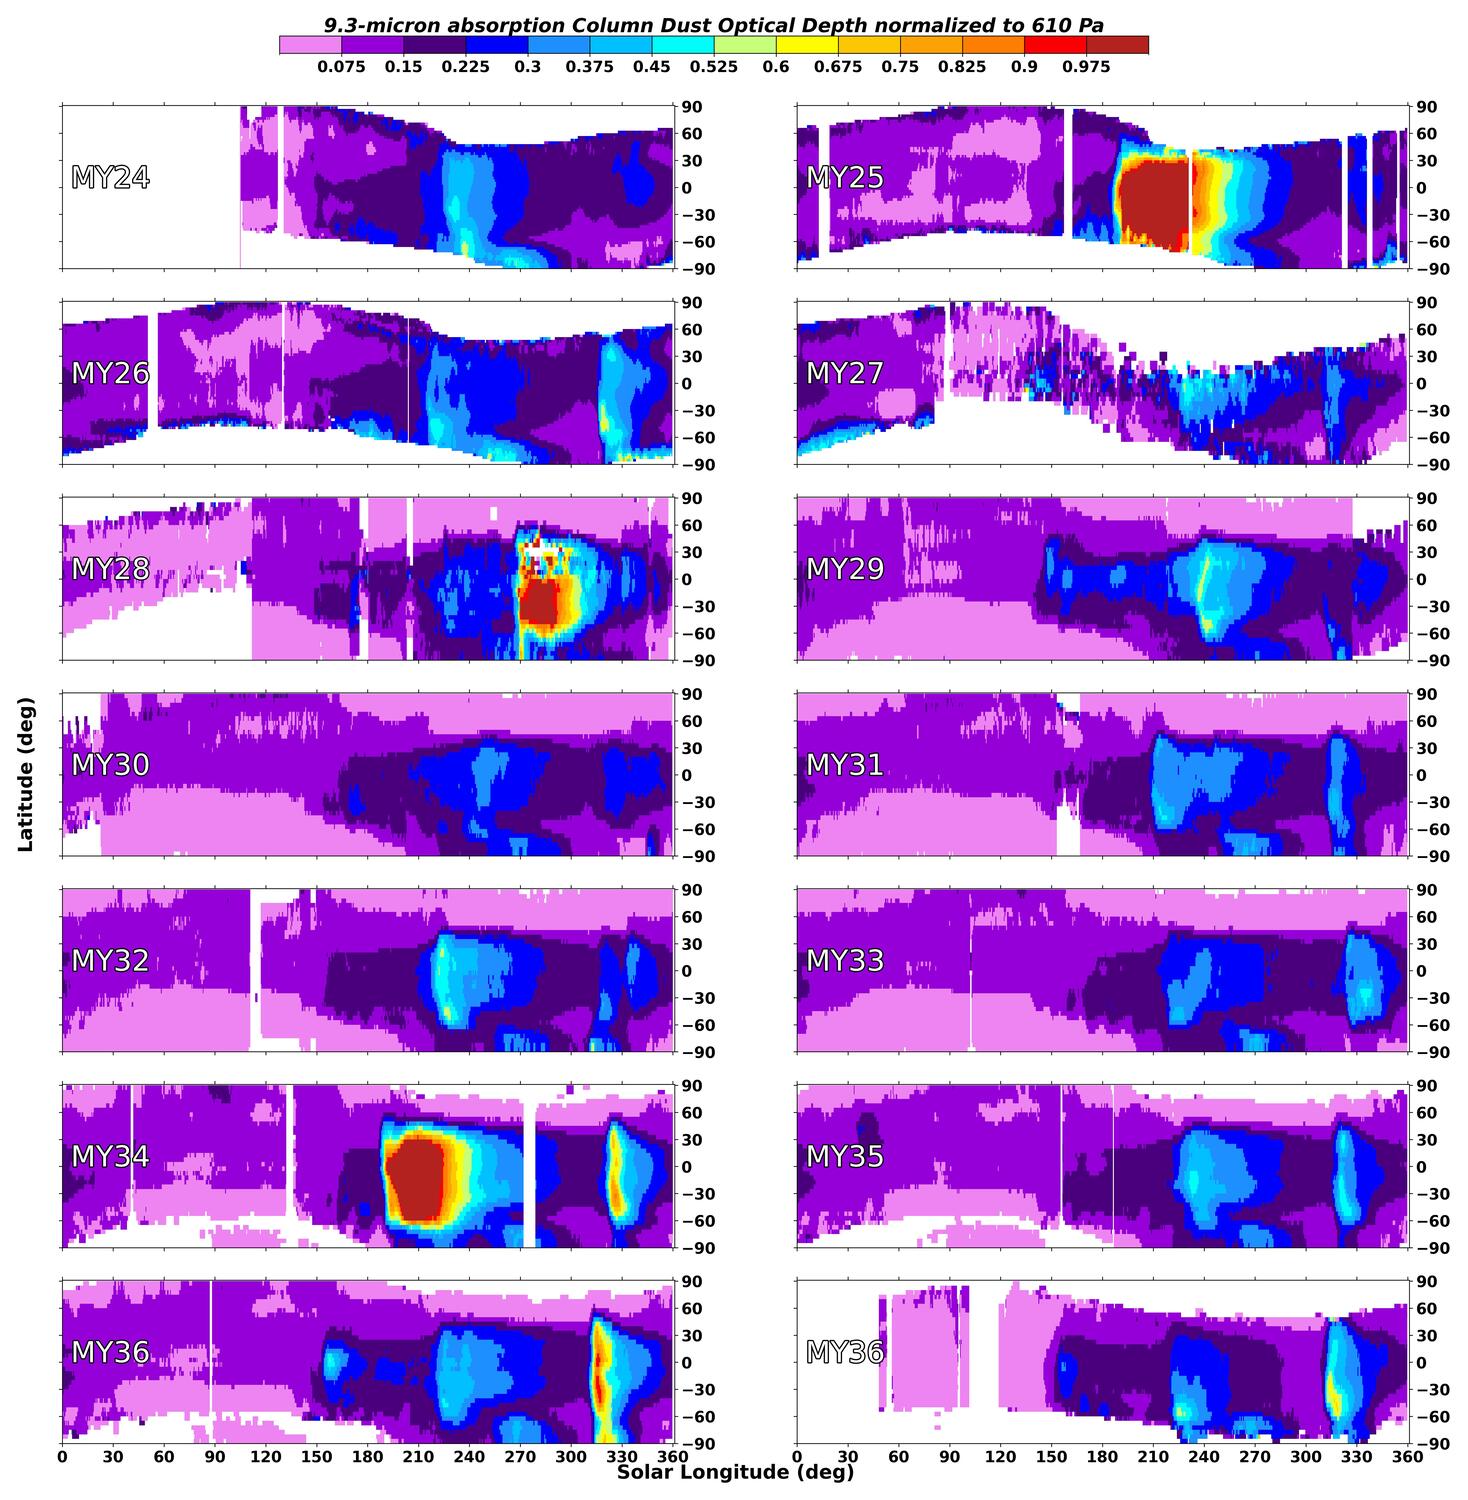
Figure 1: Zonal means of CDOD normalized to 610 Pa for 13 Martian years. The top four panels (MY 24, 25, 26, 27) show zonal means of improved maps using revised TES retrievals. The bottom two panels show zonal means of, respectively, MCS-based maps and EMIRS-based maps for MY 36.
Tracking of dust events: From the daily CDOD maps, it is possible to identify large-scale dust events (“storms”) reaching regional and planetary scales, follow their evolution, and create statistics of their main characteristics such as trajectory, area, and optical depth (see an example in Figures 2 to 5). A new development in progress is the identification and tracking of large-scale dust events using unsupervised machine learning algorithms [9].
A key outcome of this work is the production of a catalog of historic large-scale dust events, which can be routinely updated with new events as new dust maps become available. An important aspect of creating a catalog of dust events is the precise determination of their occurring time. While a Mars calendar based on solar longitude works for many applications, it does not work well for daily maps produced at a discrete number of sols per year. Therefore, we choose to use a sol-based calendar as described in [1, Appendix A]. Each Martian year has either 669 or 668 sols, following a 5-year cycle. The beginning and end of a year is always at midnight at the prime meridian, hence a new year in our sol-based calendar does not necessarily start at LS=0° (see Figure 6).
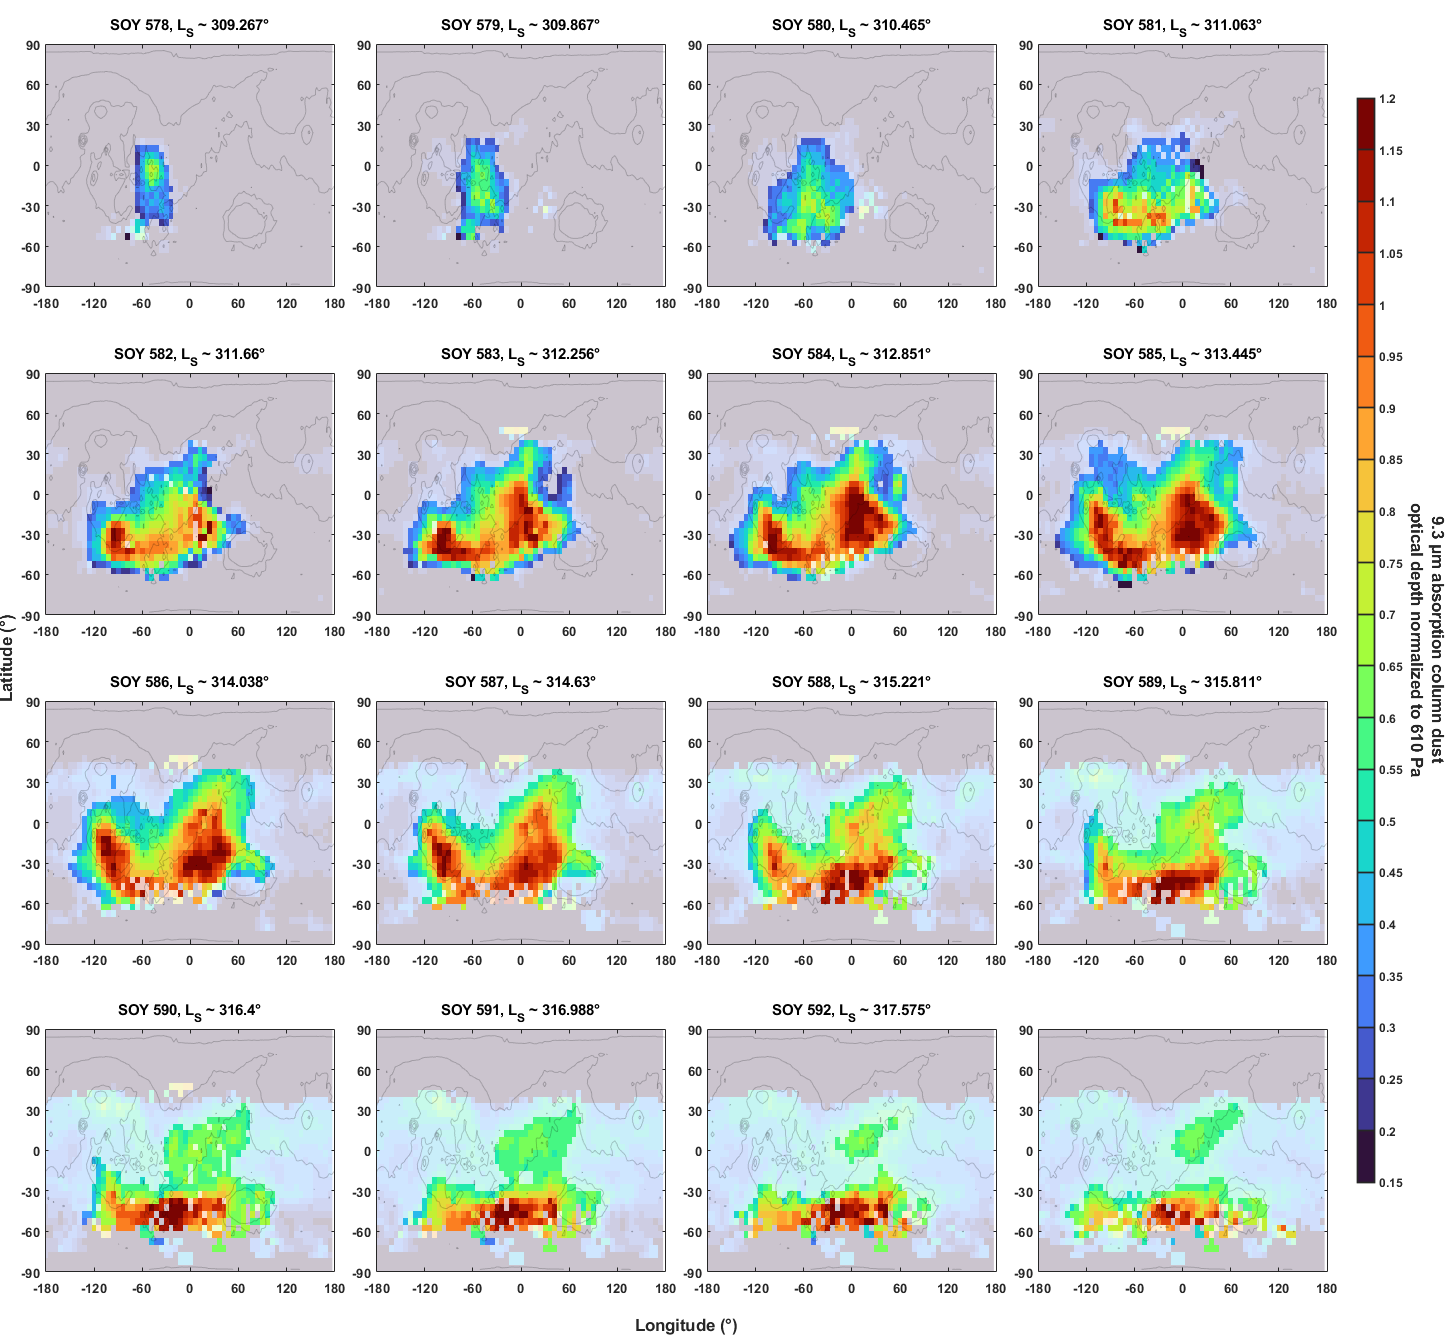
Figure 2: Sol-by-sol identification and tracking of the evolution of a dust sequence (“storm”) in MY 36 between LS=309° and LS=318° from daily EMIRS-based CDOD maps normalized to 610 Pa. The rest of the daily maps is visible in the transparent background.
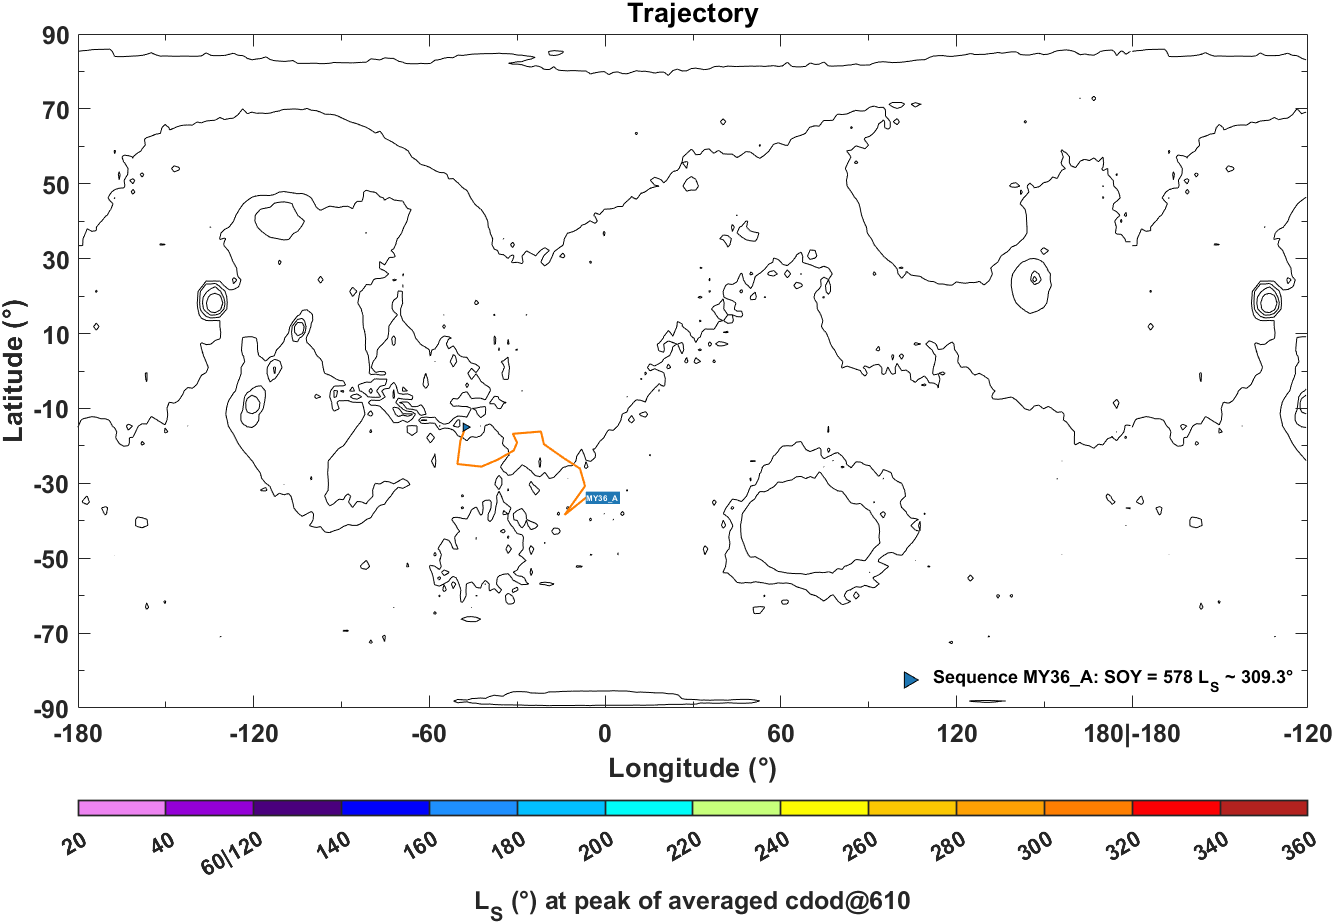
Figure 3: Plot of the trajectory of the centroid of the dust event shown in Figure 2.

Figure 4: Plot of the time evolution of the area of the dust event shown in Figure 2.

Figure 5: Plot of the time evolution of the average and 1-σ envelope of the CDOD normalized to 610 Pa for the dust event shown in Figure 2.
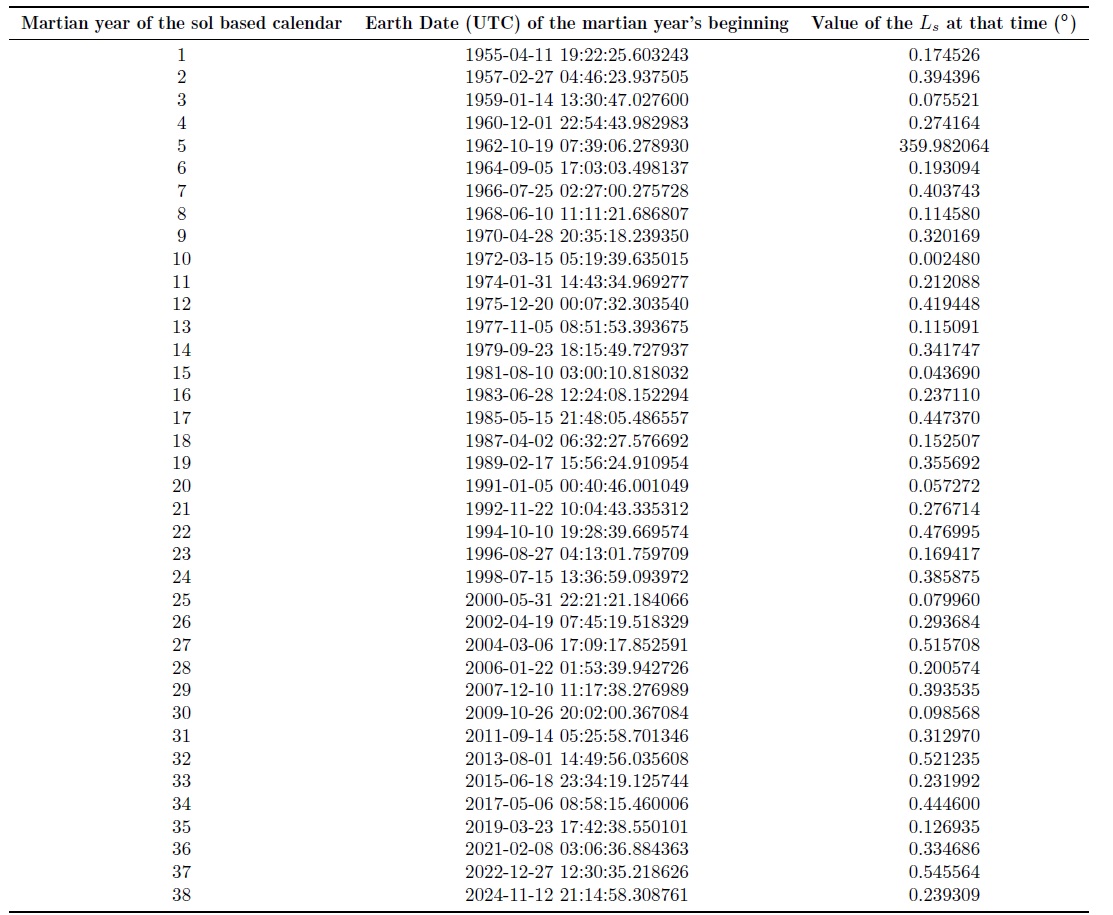
Figure 6: This table shows the Earth UTC dates and Mars solar longitudes of the beginning of Martian years 1 through 38 in our sol-based calendar (see also [1]).
Acknowledgments: LM acknowledges support from CNES and ESA MCD project. BKG was supported by UAE University Grant G00003407. Work at the Jet Propulsion Laboratory, California Institute of Technology, is supported by NASA.
The multi-annual dataset of daily gridded and kriged maps v2.x for MY24 through MY36 is available on the MCD webpage (NetCDF format) at https://www-mars.lmd.jussieu.fr/mars/dust_climatology/ and on the VESPA repository (FITS format) at https://bit.ly/3QMFfIf (shortened link)
The latest v3.0 of the daily gridded maps for MY24 through part of MY27, together with corresponding TES CDOD retrievals in the infrared and in the visible, are available on the NASA PDS (atmosphere node) at:
https://atmos.nmsu.edu/data_and_services/atmospheres_data/MARS/montabone.html
References:
[1] L. Montabone et al., 2015, doi: 10.1016/j.icarus.2014.12.034.
[2] L. Montabone et al., 2020, doi: 10.1029/2019JE006111.
[3] M. D. Smith, 2009, doi: [10.1016/j.icarus.2009.03.027
[4] M. D. Smith, 2004, doi: 10.1016/j.icarus.2003.09.010
[5] A. Kleinboehl et al., 2009, doi: 10.1029/2009JE003358
[6] E. Millour et al., EPSC2022-786, https://doi.org/10.5194/epsc2022-786, 2022.
[7] Smith et al, 2022, doi : 10.1029/2022GL099636
[8] B. K. Guha et al., 2023, doi: 10.1029/2023JE008156
[9] T. Lombard & L. Montabone, 10th International Conference on Mars, 2024
How to cite: Montabone, L., Edwards, C. S., Forget, F., Kass, D., Kleinboehl, A., Guha, B. K., Guyon, V., Lombard, T., Millour, E., Smith, M. D., and Wolff, M. J.: Monitoring Martian Atmospheric Dust using Multi-annual, Multi-instrument Orbital Observations, Europlanet Science Congress 2024, Berlin, Germany, 8–13 Sep 2024, EPSC2024-381, https://doi.org/10.5194/epsc2024-381, 2024.