EPSC Abstracts
Vol. 17, EPSC2024-387, 2024, updated on 03 Jul 2024
https://doi.org/10.5194/epsc2024-387
Europlanet Science Congress 2024
© Author(s) 2024. This work is distributed under the Creative Commons Attribution 4.0 License.

Strong variability of the NO nightglow modelled on Venus
 1,1,2,1
- 1LATMOS, CNRS, Sorbonne Université, Université Versailles St Quentin, Paris, France
- 2Instituto de Astrofísica de Andalucía (IAA-CSIC), Glorieta de la Astronomía s/n, Granada, Spain
Introduction
The NO nightglow is an interesting phenomenon in the Venusian atmosphere. This UV emission occurs on the night side in two bands, δ (190-240 nm) and γ (225-270 nm)[1].
Located at an altitude of around 115 km, the NO emission results from the recombination of nitrogen and oxygen atoms produced on the day side, which are then transported to the night side via the solar-antisolar circulation. However, the peak of the NO nightglow is not located at the anti-solar point as one might think[2] : the NO nightglow is usually shifted towards the morning, with a maximum emission at around 2 a.m. local time[2], [3], [4]. This contrasts with the behaviour of O2(1Δ), whose peak infrared emission at 1.27 μm, located 20 km below, is well-centred on midnight[5]. This suggests a significant change in the dynamical regime of these two regions, which are yet close in altitude. The NO and O2(1Δ) nightglow thus offer a powerful constraint on the three-dimensional transport and chemistry of the nightside of Venus. Until now, only one 3-D modelling study of the NO emission has been performed[6]. Major improvements were brought to the understanding of the origin and characteristics of the NO emission, but few observations were available at that time.
This presentation aims to determine our quantitative understanding of the NO nightglow on Venus, using the full extent (2006-2011) of the published Venus Express-SPICAV dataset and a state-of-the-art general circulation model with photochemistry. The SPICAV measurements constitute the largest observational database concerning the NO nightglow on Venus. These observations document the distribution of the nightglow both in latitude and local time when viewed from nadir[7], and its vertical profile in limb viewing[4]. In addition, over the long period of the Venus Express mission, the SPICAV instrument has provided unique insight into the variability of the NO nightglow (e.g. Royer et al., 2010[8]). The SPICAV data and their variability are here compared to the NO nightglow calculated by our model, and are then interpreted in dynamical terms.
Method
We used the Venus Planetary Climate Model (Venus PCM, formerly known as the IPSL Venus General Circulation Model[9]) in its version extended to the thermosphere[10] and including a description of the clouds and photochemistry[11]. The model extends on a horizontal grid of 96x96 points (3.75°x1.785°) and from the surface up to more than 200 km on 90 vertical levels. For the present work, we have implemented the online computation of photolysis rates and added a comprehensive description of the nitrogen chemistry. We also modified the eddy diffusion coefficient taken from the profile of Van Zahn[12].
Results
The NO nightglow computed by the Venus PCM has been compared to observations of the SPICAV spectrometer on board Venus Express. The SPICAV data were obtained both from limb[7] and nadir[4] measurements. The comparisons with the model show a good general agreement regarding the position of the maximum NO emission. The nightglow peak is shifted about 3h from the anti-solar point towards the morning side, in agreement with previous modelling studies[13]. The vertical distribution of the emission is also in good agreement with the observations. The peak of the modelled NO emission occurs at 115 km, with a difference of less than 10% relative to the SPICAV observations.
Our three-dimensional simulations also reveal spatial and temporal variability at the scale of a few hours, with significantly different patterns from one Earth day to the next. The model often predicts a patchy distribution of the NO nightglow, with filaments extending from the peak area towards higher latitudes or earlier local times. In certain situations, several maxima may coexist. This variability has been observed at similar timescales by both Pioneer Venus and Venus Express. We will present an overview of the NO emission calculated by our GCM, and how it correlates to the horizontal and vertical wind fields on the night side of Venus.
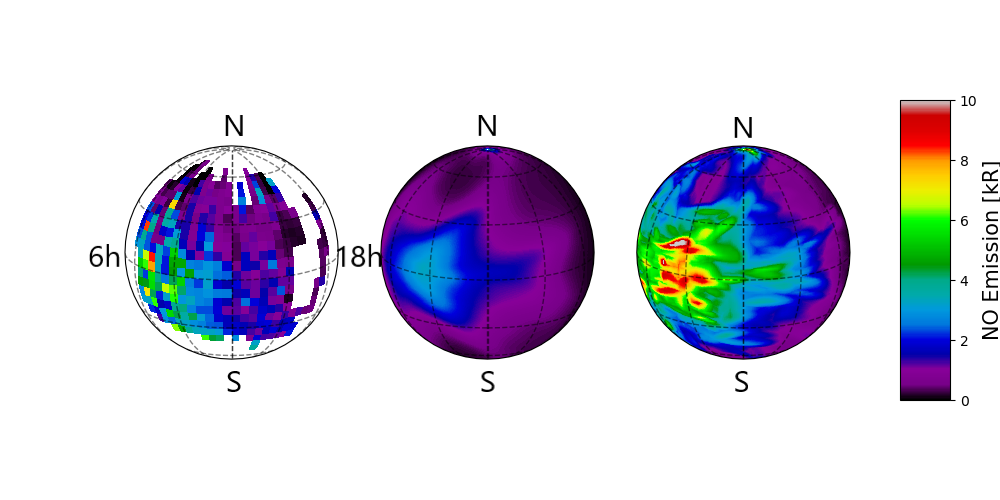
Figure 1: Column-integrated NO nightglow (kR) on Venus. Left: SPICAV nadir observations[7]. The data are averaged over 6 years of measurements. The black colour represents areas where there are no observations. Middle : Venus PCM modelling. Mean emission over one Venus day (117 Earth days) Right: Venus PCM modelling. Only the maximum values of the NO nightglow calculated over one Venus day are represented. Maps are centred at midnight.
References
- P. D. Feldman, H. W. Moos, J. T. Clarke, A. L. Lane, Nature. 279, 221–222 (1979).
- A. I. F. Stewart, J.-C. Gérard, D. W. Rusch, S. W. Bougher, J. Geophys. Res. 85, 7861 (1980).
- J.-C. Gérard et al., J. Geophys. Res., in press, doi:10.1029/2008JE003078.
- A. Stiepen, L. Soret, J.-C. Gérard, C. Cox, J.-L. Bertaux, Icarus. 220, 981–989 (2012).
- D. Crisp et al., Journal of Geophysical Research: Planets. 101, 4577–4593 (1996).
- A. S. Brecht et al., J. Geophys. Res. 116, E08004 (2011).
- A. Stiepen, J.-C. Gérard, M. Dumont, C. Cox, J.-L. Bertaux, Icarus. 226, 428–436 (2013).
- E. Royer, F. Montmessin, J.-L. Bertaux, Planetary and Space Science. 58, 1314–1326 (2010).
- S. Lebonnois, N. Sugimoto, G. Gilli, Icarus. 278, 38–51 (2016).
- G. Gilli et al., Icarus. 281, 55–72 (2017).
- A. Stolzenbach, F. Lefèvre, S. Lebonnois, A. Määttänen, Icarus. 395, 115447 (2023).
- U. Von Zahn et al., J. Geophys. Res. 85, 7829–7840 (1980).
How to cite: Streel, N., Lefèvre, F., Martinez, A., Stolzenbach, A., and Määttänen, A.: Strong variability of the NO nightglow modelled on Venus, Europlanet Science Congress 2024, Berlin, Germany, 8–13 Sep 2024, EPSC2024-387, https://doi.org/10.5194/epsc2024-387, 2024.