
The Venus Climate Database, VCD 2.3
 1,1,5,
- 1CNRS, Laboratoire de Meteorologie Dynamique, Paris cedex 05, France (sebastien.lebonnois@lmd.ipsl.fr)
- 2Instituto de Astrofísica de Andalucia (IAA-CSIC), Glorieta de la Astronomia s/n, Granada, España
- 3IPSL, Paris cedex 05, France
- 4University of Helsinki, Finland
- 5Laboratoire Atmosphères, Milieux, Observations Spatiales (LATMOS), IPSL, Sorbonne Université, Paris, France
- 6European Space Research and Technology Center (ESTEC), ESA, Noordwijk, The Netherlands
Introduction: The Venus Climate Database (VCD) is a free tool designed to be useful for engineers and scientists in need of a reference atmosphere of Venus for mission planning, observations preparation, analysis and interpretation. The VCD atmospheric fields are based on outputs from simulations using the Venus Planetary Climate Model (V-PCM) [1,2]. This project is funded by the European Space Agency, in the frame of the EnVision mission to Venus. The currently distributed VCD is version 2.3.
Overview of the Venus Climate Database: The VCD provides mean values and statistics of the main meteorological variables (atmospheric temperature, density, pressure and winds) as well as atmospheric composition and related physical fields for any given point in space and time. It extends from the surface up to and including the thermosphere (~250km), with extrapolation for higher altitudes.
The database contains high resolution temporal outputs (using 24 hourly bins) enabling a good representation of the diurnal evolution of quantities over a climatological Venusian day.
Several conditions (scenarios) can be chosen from: various Extreme UltraViolet (EUV) input from the Sun (solar minimum, average and maximum, given Earth date, or chosen E10.7 index), combined with different values (minimum, standard or maximum) of the cloud UV albedo to bracket observed variations. An illustrative example of the importance of the EUV input on thermospheric structure is presented in Figure 1.
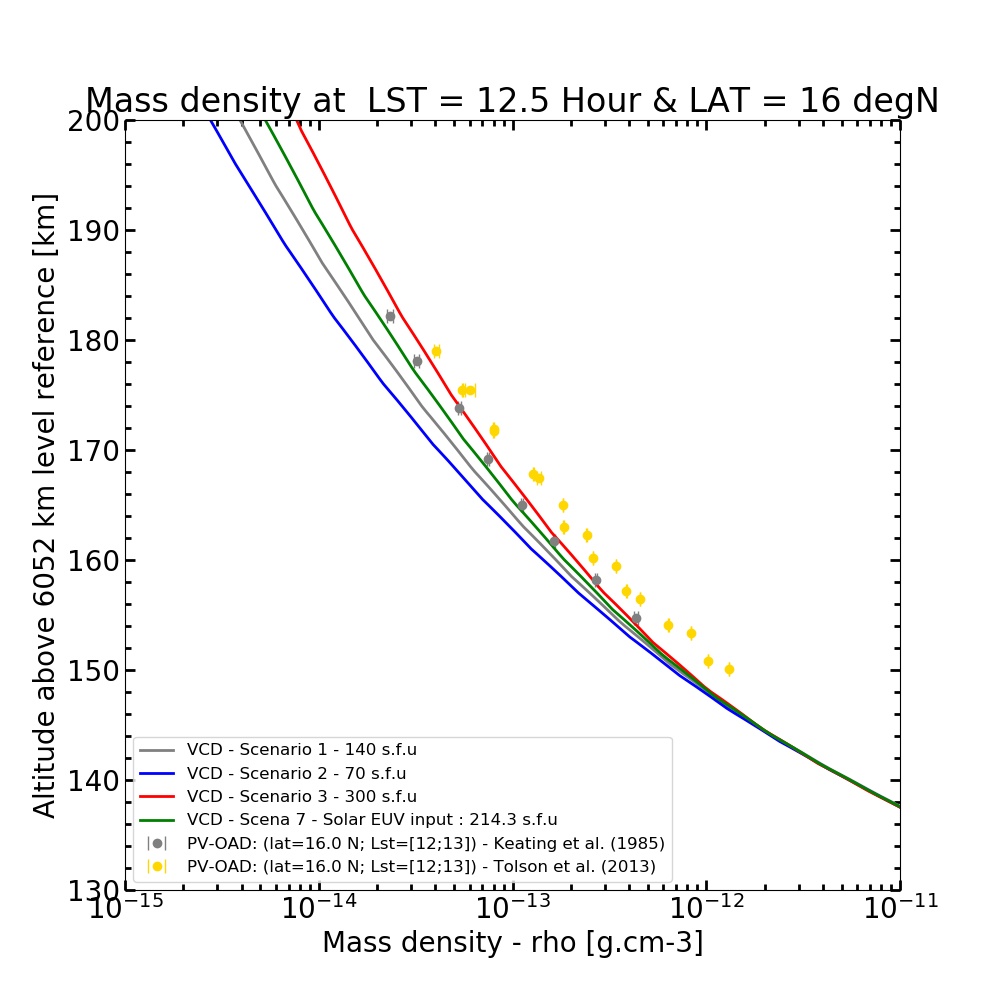
Figure 1: Mass density predicted by the VCD for various EUV solar input, expressed in solar flux units, compared to Pioneer Venus OAD measurements.
In addition to the climatological values, the VCD provides the Venusian intra-hour variability (RMS) of main meteorological variables, as well as the Venusian day-to-day variability thereof, as estimated from the multiple Venus days of V-PCM simulations. Perturbations can also be added to the climatological values as : (i) large-scale perturbations representative of the large-scale waves present in the V-PCM simulations, through use of EOF decomposition as shown in Figure 2; (ii) small-scale perturbations representative of gravity waves, tuned to reproduce available observations (e.g. VeXADE torque measurements), as illustrated in Figure 3.

Figure 2: Illustrative example of the use of the VCD large scale perturbations scheme (purple dots), compared to Magellan aerobraking measurements (green dots). The red dots display VCD climatological (unperturbed) values encompassed with the associated RMS (in orange).
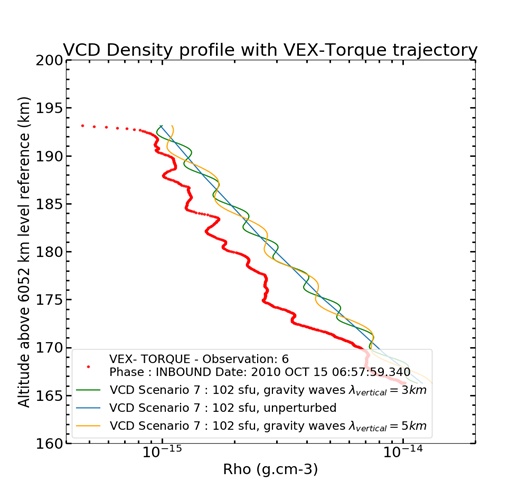
Figure 3: Illustrative example of use of the VCD small scale perturbations scheme (representative of gravity waves of vertical wavelength specified by the user), compared to Venus Express Torque observations.
For deep atmosphere applications, a “high resolution mode” is also available: although the V-PCM simulations have been run at the resolution of a few degrees in longitude and latitude (3.75° x 1.875°), the VCD uses some post-processing and a high resolution topography map (at 23 pixels/degree) to adjust the local pressure (and density) and temperature, as shown in Figure 4.
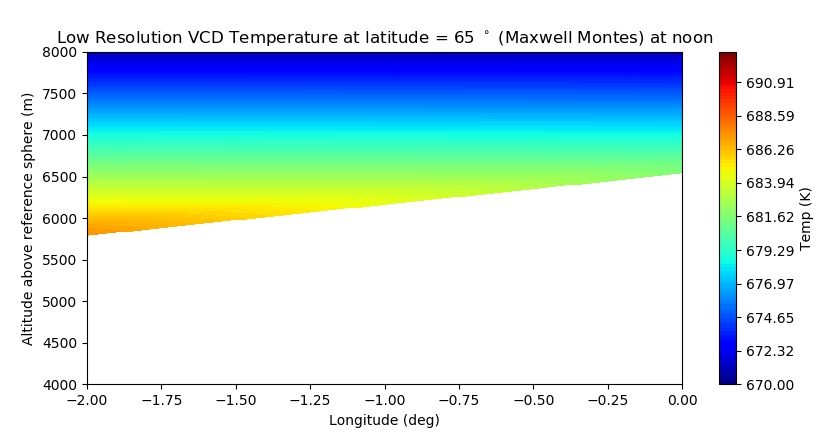
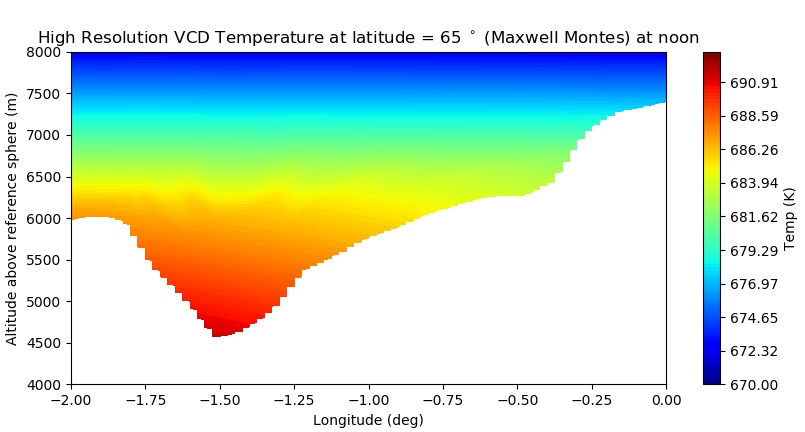
Figure 4: Example of extraction of atmospheric temperatures using the VCD low resolution (top plot), i.e. V-PCM simulation resolution or VCD high resolution (lower plot), i.e. post-processed to ~0.04° effective horizontal resolution.
VCD validation: The VCD has been validated using available datasets from experiments on various missions (Pioneer Venus, Magellan and Venus-Express) enabling some comparisons and investigations in terms of temperature, density and composition. All these are reported in the VCD validation document distributed with the VCD.
Using and Obtaining the VCD: For a quick look users may use the online interface available here : http://www-venus.lmd.jussieu.fr
For more extensive usage, a full (i.e. datafiles and access software) version is available for download from the same website. In practice the software comes as a Fortran subroutine meant to be called by the user’s personal code; examples of interfaces in other programming languages (C,C++, Python, IDL, Matlab) are also given.
References:
[1] Martinez A. et al. (2023) Icarus 389, 115272, 10.1016/j.icarus.2022.115272.
[2] Stolzenbach A. et al. (2023) Icarus 395, 115447, 10.1016/j.icarus.2023.115447.
How to cite: Lebonnois, S., Millour, E., Martinez, A., Boissinot, A., Pierron, T., Bierjon, A., Forget, F., Salminen, J., Lefèvre, F., Chaufray, J.-Y., and Cipriani, F.: The Venus Climate Database, VCD 2.3 , Europlanet Science Congress 2024, Berlin, Germany, 8–13 Sep 2024, EPSC2024-430, https://doi.org/10.5194/epsc2024-430, 2024.