
Laboratory reflectance spectra of enstatite and oldhamite mixtures for comparison with E-type asteroids and implications for Mercury’s surface composition analysis
 1,
1,- 1Universität Münster, Institut für Planetologie, Münster, Germany (kathrin.markus@uni-muenster.de)
- 2DLR, Institute of Planetary Research, Berlin, Germany
- 3Institute of Geosciences, University of Potsdam, Potsdam, Germany
Introduction
Major rock-forming minerals such as pyroxenes are very common in the solar system and show characteristic absorption bands due to Fe2+ in the VIS and NIR [e.g., 1, 2]. The Fe-free endmember enstatite is also probably a common mineral on planetary surfaces such as E-type asteroids and Mercury [3] and a major constituent of meteorites such as aubrites [4] and enstatite chondrites [5]. Reflectance spectra of these meteorites as well as of enstatite-rich or generally Fe-poor asteroids like E-type asteroids and Mercury are often featureless in the VIS and NIR, lacking the absorption features associated with iron incorporated into the crystal structure of silicates, while Fe-bearing orthopyroxenes show diagnostic absorption bands at ~1 µm and ~2 µm [1,2].
For a better understanding of these Fe-poor bodies, the availability of laboratory spectra of Fe-free silicates as analog materials is crucial, but terrestrial samples of enstatite usually contain several mol% of FeO, with pure enstatite being extremely rare. In order to make larger amounts of pure enstatite readily available, we have synthesized nearly FeO-free enstatite [6].
We present 0.3-16 µm reflectance spectra of synthetic enstatite (Mg2Si2O6), synthetic oldhamite (CaS), and of their mixtures [7] for comparison with spectra of E[II]-type asteroids, investigate the spectral behavior of the mixtures with respect to their oldhamite content, and discuss the implications for surface composition analysis of Mercury.
Selection of Samples
All reflectance spectra were collected using a Bruker Vertex 80v FTIR spectrometer at the Planetary Spectroscopy Laboratory of the Institute of Planetary Research at DLR, Berlin [8]. The synthesis of the enstatite sample with the composition En99.6Fs0.0Wo0.4 has been described in detail by [6]. The oldhamite sample was purchased from abcr GmbH (99.95 %, metal basis, CAS #20548-54-3). The average grain size of the enstatite and oldhamite samples are 26 µm and 12 µm respectively [6,7]. Mixtures containing 1, 3, 5, 10, 20, 30, 40, 50, 60, 70, 80, and 90 vol% oldhamite were prepared.
Results
Figure 1 shows the reflectance spectra from 0.3 to 1 µm. The enstatite spectrum shows several weaker absorption bands between 0.4 µm and 1 µm which are due to Fe3+ and possibly Ti and shows a steep red slope in the UV. The spectral slopes in the VIS and NIR are nearly neutral with only a slightly reddish slope in the VIS. The spectrum of synthetic oldhamite shows an absorption band at 0.41 μm with a relative depth of 11.4 %. This band is visible in the spectra of all mixtures, even in the spectrum of the mixture containing only 1 vol% oldhamite. In the MIR, the spectra with ≤10 vol% oldhamite are very similar to the spectrum of the pure enstatite and are generally dominated by the Christiansen feature (CF) and the Reststrahlen bands (RB). The pure oldhamite is significantly brighter than the enstatite spectrum in the MIR and shows several broad and overlapping absorption features (figure 2). Changes in the band depth and reflectance, both in the VIS and MIR, do not occur as a single trend, but follow two distinct trends. One for mixtures with ≤10 vol% of oldhamite, where changes rapidly occur, and another trend for mixtures with ≥20 vol% of oldhamite, where changes occur more slowly.
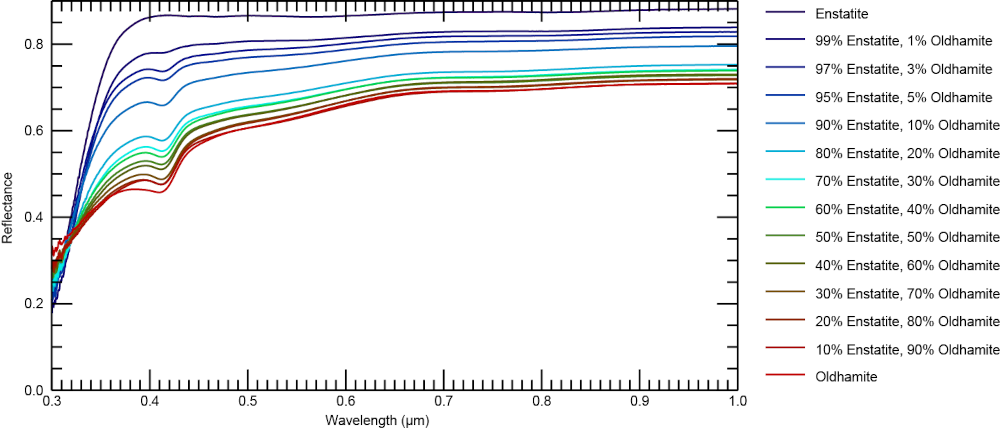
Figure 1. Reflectance spectra of synthetic enstatite, oldhamite, and their mixtures from 0.3 to 1 µm. Compositions are given in vol%.
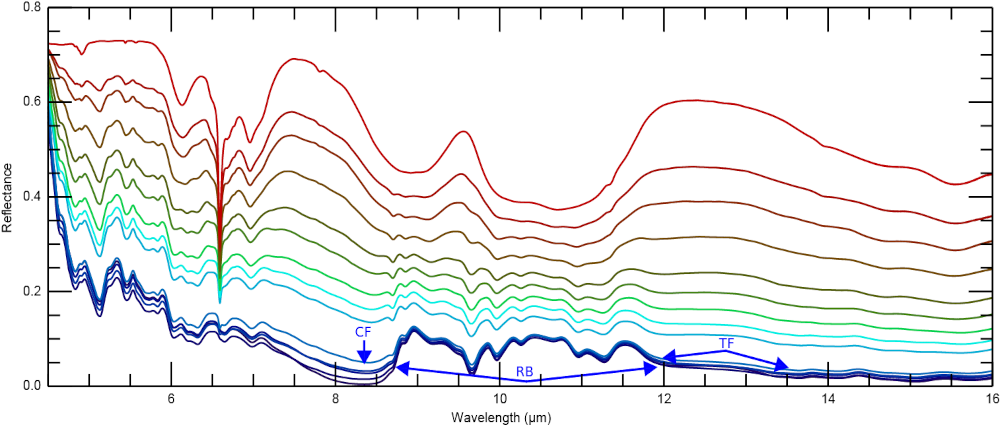
Figure 2. MIR reflectance spectra from 7 to 16 µm of synthetic enstatite, oldhamite, and their mixtures. For legend see figure 1.
Discussion
Based on XRS data, sulfur contents up to 4 wt% have been reported in surface materials of Mercury [9], and sulfide decomposition has been linked to the formation of hollows on Mercury [10], geological features unique to the surface of Mercury. Oldhamite was proposed as the major lithophile sulfide on the surface of Mercury [11]. Therefore, understanding the spectral behavior of oldhamite in mixtures with FeO-poor silicates, such as enstatite, is crucial for the interpretation of spectral data from Mercury. Figure 3 shows a comparison between a Mercury spectrum [12,13], the aubrite Peña Blanca Spring (PBS) [6], and selected laboratory spectra from this study. The positions of the CF and RB in these spectra are in good agreement. The RBs are less pronounced in the enstatite and PBS spectra than in the Mercury spectrum. The oldhamite spectrum has a local maximum at ~9.5 µm, which could contribute to the higher reflectance in this wavelength range compared to the enstatite and PBS.
The influence of space weathering on FeO-poor surfaces such as Mercury is still poorly understood. Factors such as thermal degradation or the influence of grain size changes have been discussed. However, many important influencing factors are still unknown [7]. Spectral investigations of the samples at Mercury-relevant surface temperatures can improve our understanding of these processes. At the same time, such studies would improve the comparability of Mercury spectra with those of the analogous materials measured here at room temperature.
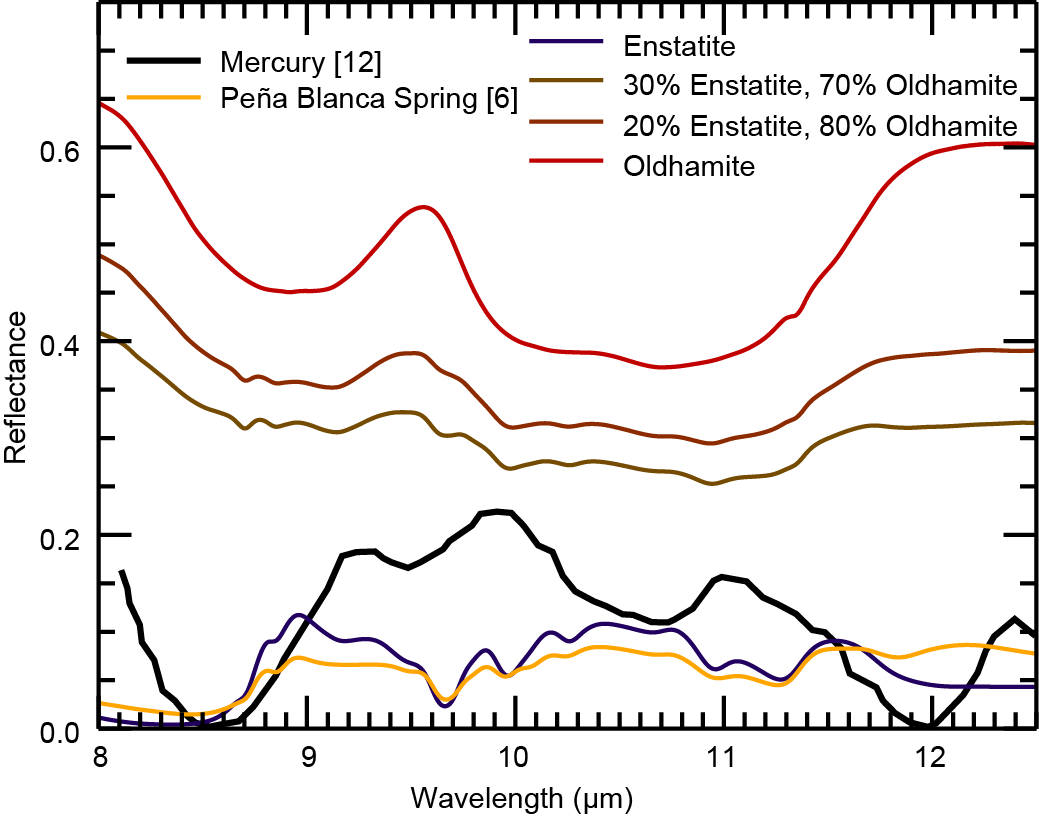
Figure 3. Comparison between a Mercury spectrum [12,13], Peña Blanca Spring spectrum [6], and selected laboratory spectra from this study. The Mercury spectrum was obtained by [12] and converted to reflectance using Kirchhoff’s law and baseline corrected by [13]. Compositions are given in vol%.
References
[1] Burns (1993) Mineralogical Applications of Crystal Field Theory, 2nd ed. [2] Klima et al. (2007) Met. Planet. Sci., 42, 235-253. [3] Izenberg et al. (2014) Icarus, 228, 364-374. [4] Keil (2010) Chem. Erde, 70, 295-317. [5] Mason (1968) Lithos, 1, 1-11. [6] Markus et al. (2018) Planet. Space Sci., 159, 43-55. [7] Markus et al. (2024) Planet. Space Sci., 244, 105887. [8] Maturilli and Helbert (2019) LPSC, 1846. [9] Nittler et al. (2011) Science, 333, 1847-1850. [10] Blewett et al. (2013) JGR Planets, 118, 1013-1032. [11] Vaughan et al. (2013) LPSC, 1719. [12] Sprague et al. (2000) Icarus, 147, 421-432. [13] Morlok et al. (2020) Met. Planet. Sci., 55, 2080-2096.
How to cite: Markus, K., Arnold, G., Moroz, L., Henckel, D., and Hiesinger, H.: Laboratory reflectance spectra of enstatite and oldhamite mixtures for comparison with E-type asteroids and implications for Mercury’s surface composition analysis, Europlanet Science Congress 2024, Berlin, Germany, 8–13 Sep 2024, EPSC2024-446, https://doi.org/10.5194/epsc2024-446, 2024.