
 1,2,2,1,4,1,1
- 1LESIA - Paris Observatory, Meudon, France (antonin.wargnier@obspm.fr)
- 2LATMOS, Guyancourt, France
- 3LAM, Marseille, France
- 4CNES, Toulouse, France
Introduction:
The JAXA/Martian Moon eXploration (MMX) mission will be launched to the Martian system in 2026 with the objective of deciphering the origins of Phobos and Deimos [1]. One of the instruments onboard the MMX spacecraft will be MIRS, an imaging-infrared spectrometer covering a wavelength range from 0.9 µm to 3.6 µm [2]. In this work, we will present simulations of MIRS imaging of Phobos realized to prepare the future science exploitation of MIRS data and assess instrument performances. These simulations will also be useful during the operations of MIRS to anticipate the operations such as the Deimos flybys and Phobos landing.
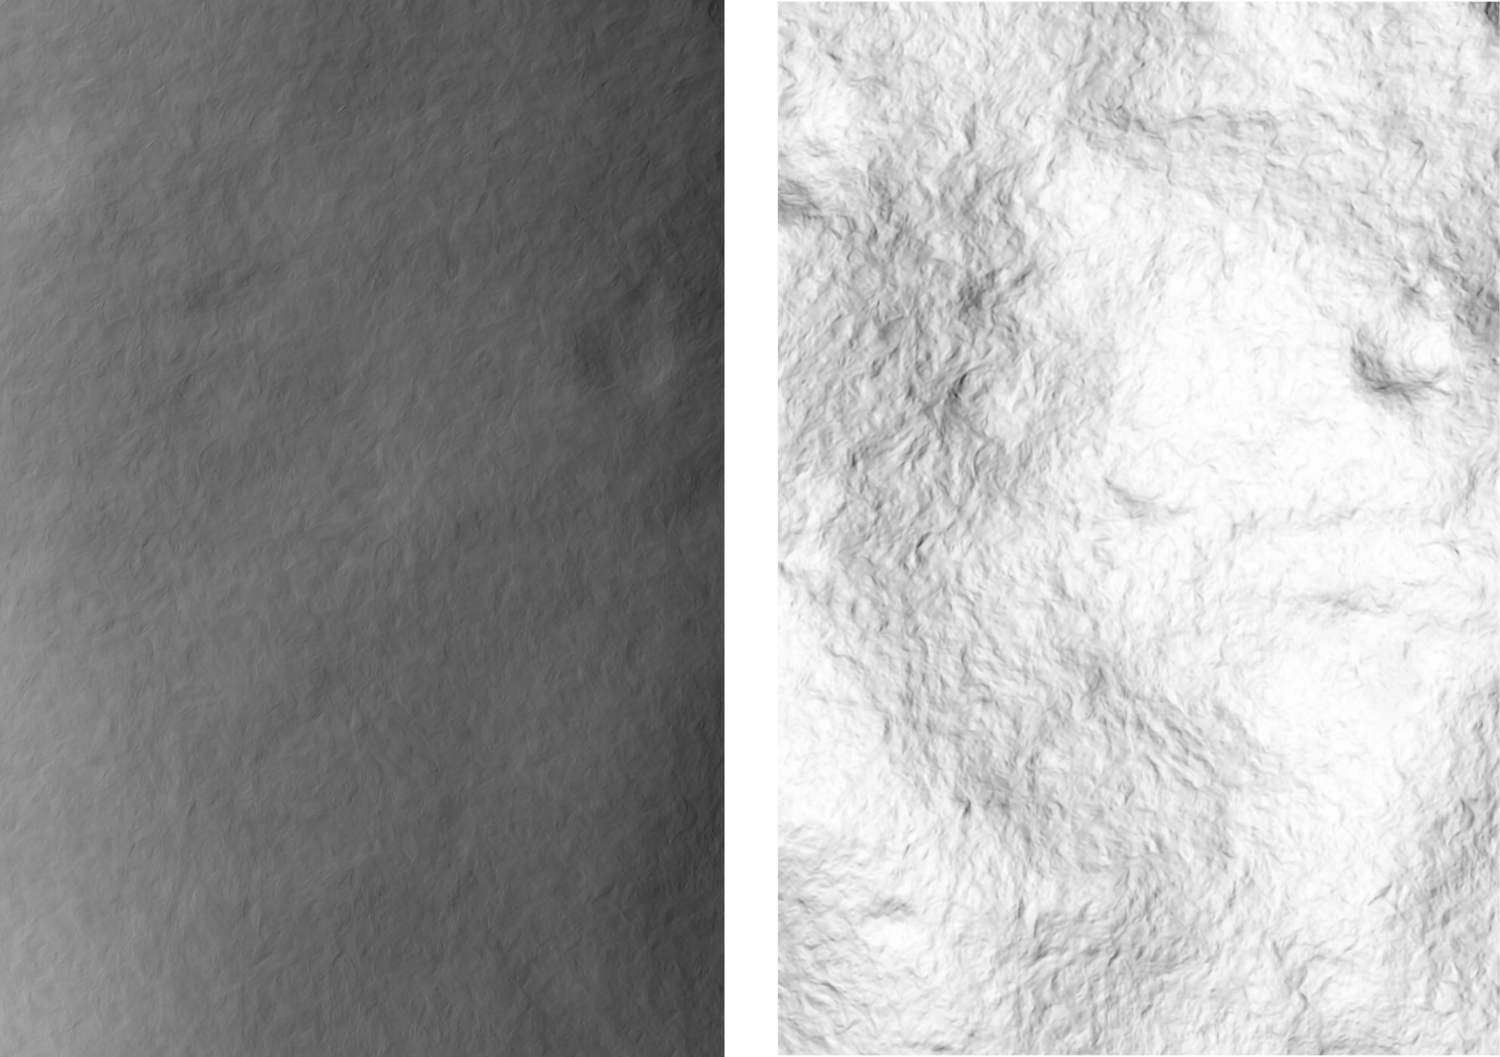
Figure 1: Example of surface reflectance at 1 µm (left) and temperature at 3 µm (right) landscapes obtained with OASIS simulation.
Method:
The generation of a spectral MIRS image is obtained with the use of a suit of three simulators. The observation mission scenarios are initially derived through AURORA [3], which provides all necessary orbital and instrument information, including the spacecraft position, pointing, etc. The second simulator, OASIS [4], is dedicated to the generation of all the geometric information (incidence, emission, phase, etc.) for each pixel/facet of the Phobos surface. AURORA provides the observation geometries fed into OASIS. The tool considers topographic variation on the surface through the use of the Phobos shape model. From the obtained illumination angles, a Hapke model is used to compute the bidirectional reflectance. The thermal component of the spectra is accounted for, through the use of a Standard Thermal Model. The current model does not account for multiple scattering and Mars reflected light on Phobos and Deimos.
To avoid extremely long computational time, the geometric calculations are only performed at a single wavelength. The spatial and spectral terms of the solar and thermal irradiance are decoupled to allow extrapolation of a spectrum from the simulated landscape.
After generating the reflectance and temperature maps (Fig. 1), the MIRAGES simulator [5] is run to model the MIRS instrument response, including light propagation through the mirrors, grating, and other optical elements, as well as accounting for the radiometric efficiency of these components, and introducing a geometric distortion. This allows to obtain 2D MIRS raw images. In the final stage, the images are processed further using a portion of the MIRS pipeline to obtain corrected and calibrated images. This includes distortion correction, ADU to I/F conversion, and spectral registration procedures. A thermal correction is subsequently applied to remove the contribution of the thermal tail.
Results:
The MIRS images were simulated for two scheduled observations of Phobos, designated as QSO-H (quasi-stationary orbit at high altitude) and QSO-M (quasi-stationary orbit at medium altitude). A typical rendered image for a QSO-H orbit is presented in Fig. 2.
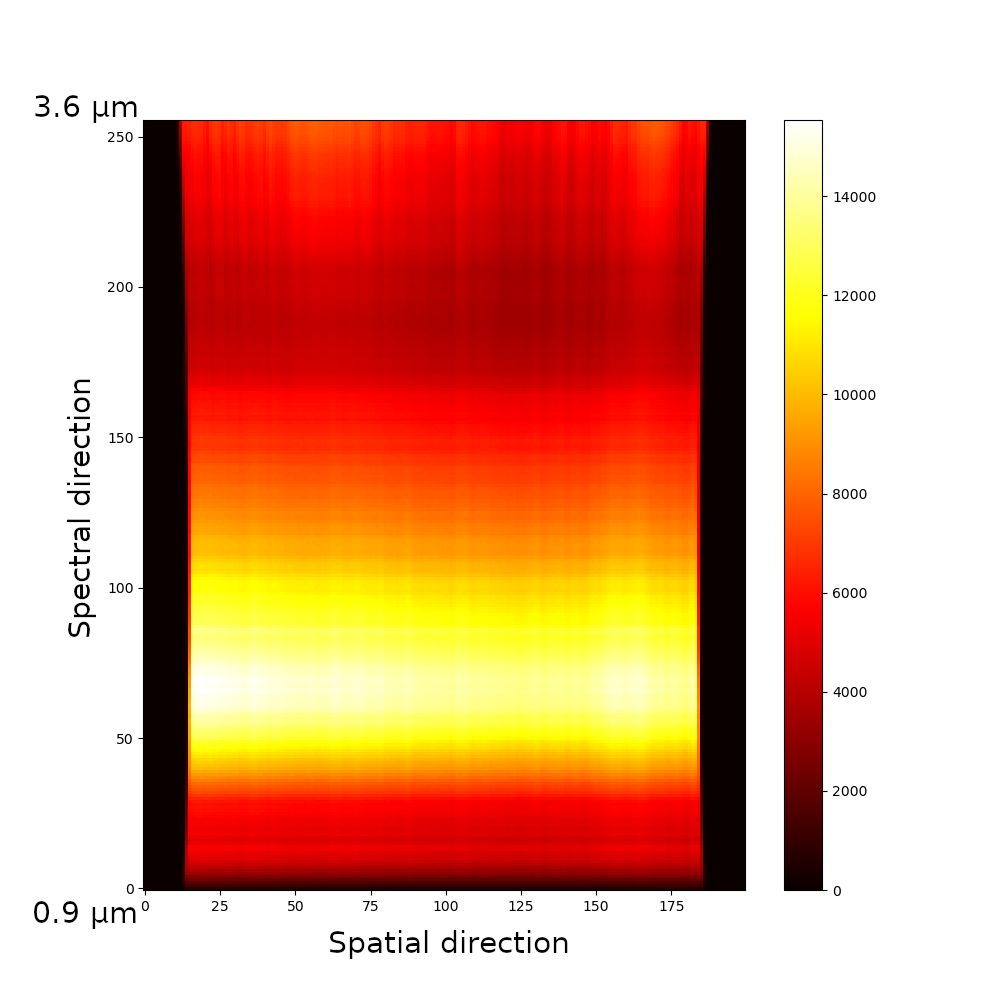
Figure 2: Example of a typical MIRS image for QSO-H orbit, obtained after the three simulators.
In addition to the interest of having the capacity to simulate relatively rapidly MIRS images, we also investigated the detectability of several components of interest for the Phobos’ surface. In particular, we assessed the detectability of small patches of hydrated minerals and organics at the surface of Phobos by MIRS. For this purpose, we used as input, the experimental spectra obtained in our previous works for detectability studies in a Phobos regolith simulant [6,7]. We defined patches of different sizes from a diameter of 3.5 km to 12.9 m at the surface of Phobos. We found that the homogeneous patches are visible in the QSO-H orbit for a diameter of approximately 40 m but not visible when the diameter is reduced to ~13 m. This is in agreement with the expected spatial resolution in the QSO-H orbit which was estimated to be between 31 and 66 m/px. An example of a MIRS observation sequence is presented in Fig. 3. Whereas MIRS images 1 and 2 of the figure correspond to a “classic” area on Phobos, image 3 clearly shows a bright line at the center of the images. This bright line corresponds to MIRS scanning over a small patch of phyllosilicate in our simulated Phobos surface model.
From these 2D images, it is possible to extract the 1D spectrum of both organic and classic Phobos regions. Typical obtained spectra are presented in Fig. 3 (bottom-left corner panel). The contrast between the two regions is evident when looking at the 2.7 µm region, where an absorption band is visible in the case of the phyllosilicates-rich patch compared to the classic Phobos surface.
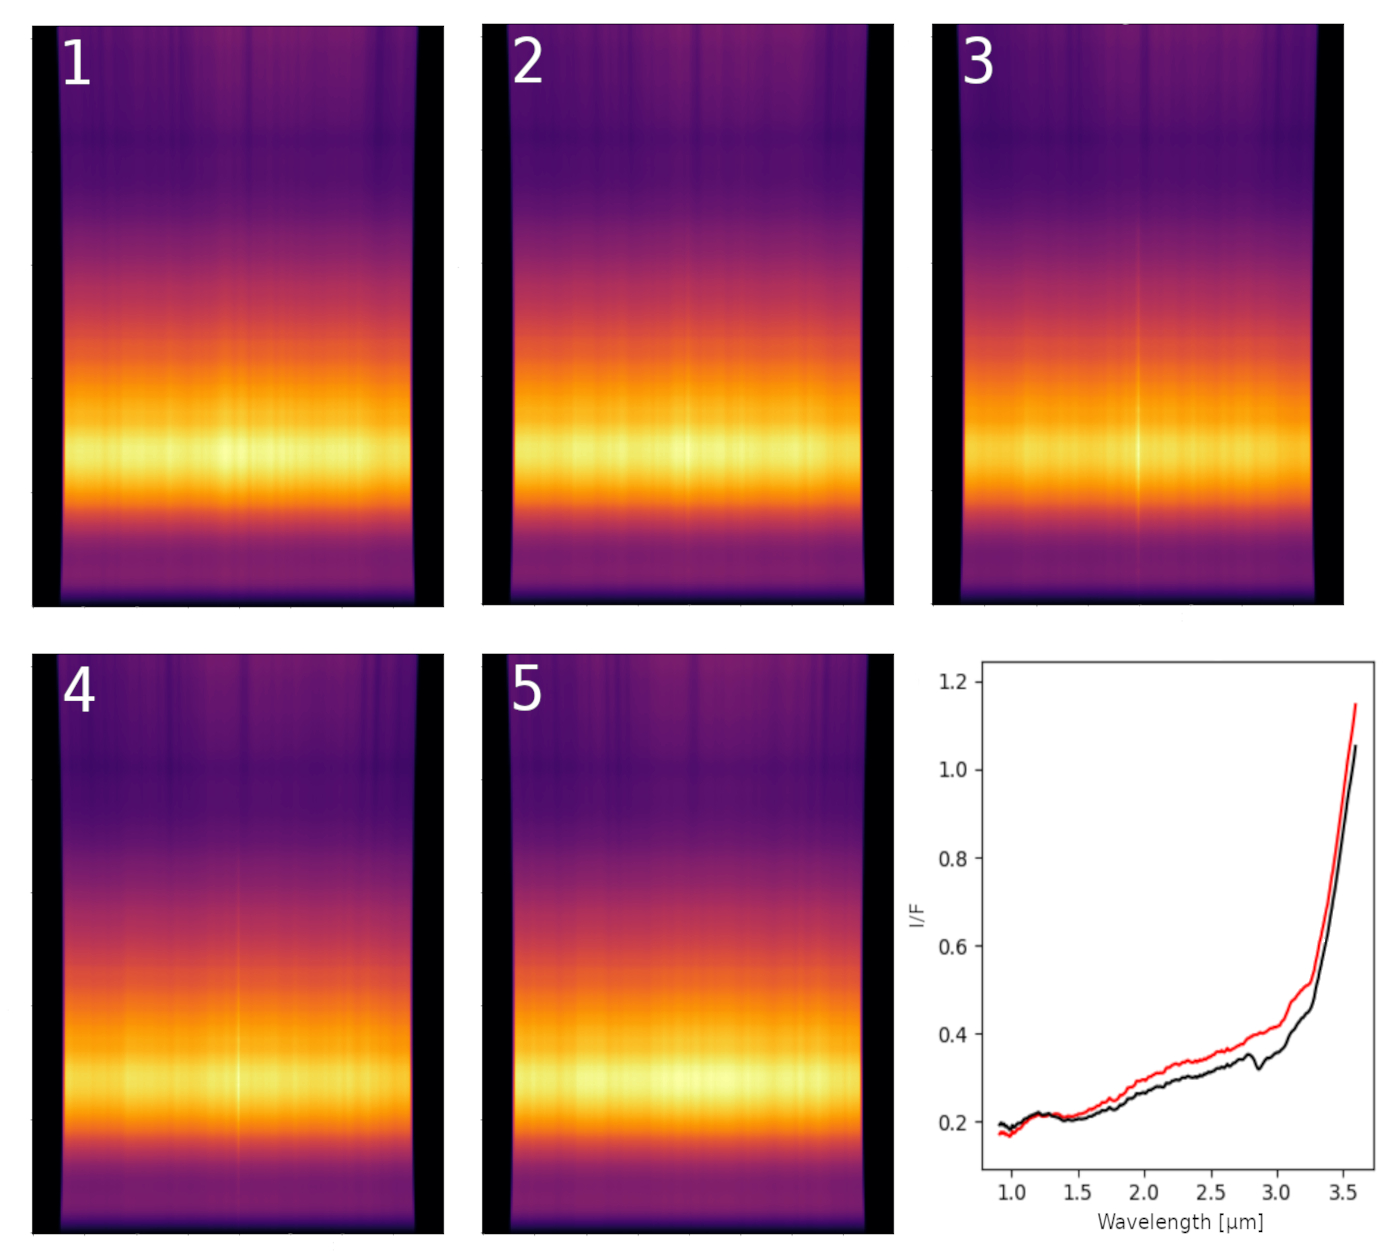
Figure 3: Example of 5 images of a MIRS observation sequence on a landscape obtained by OASIS. The passage on the hydrated mineral patch can be visually seen as a bright line through the spectral direction in the center of images 3 and 4. Bottom left corner: Example of two 1D spectra extracted for a MIRS image (panel 3), before thermal tail removal. The black solid line corresponds to the phyllosilicate patch MIRS rendered spectrum, and the red solid line corresponds to the ‘classic’ Phobos surface MIRS spectrum. The 2.7 µm band due to OH in hydrated minerals is visible in the black spectrum.
Conclusion:
Our simulations allow to explore the detectability of key components for Phobos and Deimos, with a particular focus on organics and hydrated minerals, for a typical QSO-H orbit. In further investigation, we plan to assess the detectability of inhomogeneous and/or mixed patches as well as addressing other MMX orbits and Deimos flybys. The simulations of Phobos and Deimos observations will be pivotable to prepare the MMX mission.
Acknowledgments: The authors acknowledge the Centre National d’Etudes Spatiales (CNES) for the continuous support.
References: [1] Kuramoto et al. (2021), EPS, 74, 12 [2] Barucci et al. (2021), EPS, 73, 211 [3] Sawyer et al. (2023), Acta Astronautica, 210 [4] Jorda et al. (2010), SPIE Symposium [5] Théret et al. (2023), LPSC [6] Wargnier et al. (2023), MNRAS, 524, 3 [7] Wargnier et al., submitted to Icarus (10.48550/arXiv.2405.02999)
How to cite: Wargnier, A., Gautier, T., Jorda, L., Théret, N., Doressoundiram, A., Mathé, C., Fornasier, S., and Barucci, A.: Simulations of MMX/MIRS Phobos observations, Europlanet Science Congress 2024, Berlin, Germany, 8–13 Sep 2024, EPSC2024-462, https://doi.org/10.5194/epsc2024-462, 2024.