
Observability of atmospheric spatial variability by the VeSUV/VenSpec-U instrument onboard ESA’s EnVision mission
 1,3,4,4
- 1LATMOS/IPSL, UVSQ Université Paris-Saclay, Sorbonne Université, CNRS, Guyancourt, France
- 2Hensoldt Space Consulting, Guyancourt, France
- 3Royal Belgian Institute for Space Aeronomy (BIRA-IASB), Brussels, Belgium
- 4DLR Institute of Planetary Research, Berlin, Germany
Context
UV investigations of Venus have revealed interesting features regarding the chemical composition and the complex dynamical processes taking place in the atmosphere. The abundance and variability of sulphured gases like SO2 and SO, as well as the unidentified “UV absorber” have been monitored, and patterns linked to the dynamical activity such as convection cells and atmospheric waves have been observed at both planetary and smaller spatial scales.
These topics are the main science interests of the UV spectrometer VenSpec-U [1], onboard the future ESA mission EnVision. This instrument will focus especially on the upper atmosphere and will perform measurements of the backscattered sunlight on the dayside of Venus, and provide radiance factor spectra derived from the measured radiance of Venus and the knowledge of the solar spectral irradiance. Each of the two channel composing the instrument will be dedicated to particular science goals: the “Low Resolution” (LR) channel will operate in the 190-380 nm range to monitor the abundances and variability of SO2, UV absorber and dynamical processes at small spatial scale ; while the “High Resolution” (HR) channel will be dedicated to the separate identification of SO and SO2, by observing in the 205-235 nm range with a 0.3 spectral resolution around the common absorption band of these two species. Observations will be performed with a pushboom strategy, and spatial samplings ranging from 3 to 24 km.
Objective and method
The imaging capabilities of the instrument at small spatial scale are then evaluated in order to estimate the observability of the spatial variability of the key parameters aiming to be measured: the SO2 mixing ratio at 70 km of altitude, the imaginary part of the refractive index used to consider the UV absorber’s influence, and the cloud-top altitude. To do so, the following steps are implemented:
The first step consists in producing maps of parameters to simulate scenes that could be observed by the instrument. These maps are derived from a mesoscale model of Venus’ atmosphere [2], allowing to compute abundance’s vertical profile and spatial variability for the main atmospheric chemical compounds and different latitudes and local times. An observation at the Equator and 12h local time is here considered. For each point of the maps, a radiance factor spectrum is generated with a radiative transfer model [3], with consideration of the observation geometry. The second step simulates the instrumental effects and the induced degradations of maps and spectra, including optical processes as well as other perturbations occurring at the detector level and during on-board data treatment. The maps are also spatially binned to match the smallest targeted spatial sampling for VenSpec-U. Finally, the degraded synthetic radiance factor spectra are processed with the inverse RTM to retrieve the associated atmospheric parameters, from which the maps can be recomposed and compared to the unperturbed simulations (Figure 1).
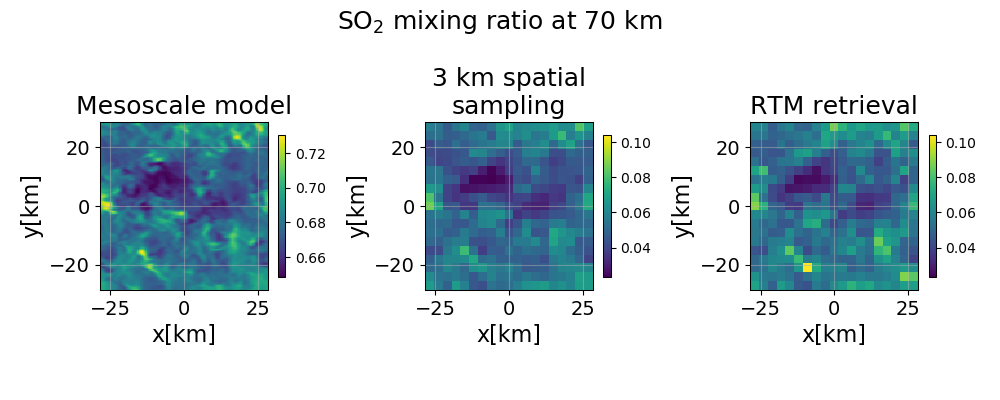
Figure 1: maps of the SO2 mixing ratio (RTM parameter): - simulated with the mesoscale model (left) - original map averaged to reach a 3 km spatial sampling, with rescaled values to be consistent with observed ranges (centre) - retrieved by the inverse RTM (right)
Further developments
This study is coupled to the development of an instrumental model intending to simulate the various processes involved in the production of the images provided by VenSpec-U. This model aims to be implemented and adjusted over time in order to be representative of the instrument, so that it can be used to perform or refine performance assessments.
References
[1] Emmanuel Marcq, Franck Montmessin, Jérémie Lasue, Bruno Bézard, Kandis L. Jessup, et al. Instrumental requirements for the study of Venus’ cloud top using the UV imaging spectrometer VeSUV. Advances in Space Research, 2021, 68 (1), pp.275-291. 10.1016/j.asr.2021.03.012. insu-03179739
[2] Maxence Lefèvre, Aymeric Spiga, Sébastien Lebonnois. Mesoscale modeling of Venus’ bow-shape waves. Icarus, 2020, 335, pp.113376. 10.1016/j.icarus.2019.07.010. hal-02323587
[3] Emmanuel Marcq, Kandis Lea Jessup, Lucio Baggio, Therese Encrenaz, Yeon Joo Lee, et al. Climatology of SO2 and UV absorber at Venus’ cloud top from SPICAV-UV nadir dataset. Icarus, 2020, 335, pp.113368. 10.1016/j.icarus.2019.07.002. insu-02196097
How to cite: Conan, L., Marcq, E., Lustrement, B., Lefèvre, M., Rouanet, N., Bertran, S., Vandaele, A. C., Helbert, J., and Alemanno, G.: Observability of atmospheric spatial variability by the VeSUV/VenSpec-U instrument onboard ESA’s EnVision mission, Europlanet Science Congress 2024, Berlin, Germany, 8–13 Sep 2024, EPSC2024-465, https://doi.org/10.5194/epsc2024-465, 2024.