
GIS methods based ejecta layer estimation for the Moon to support research and ISRU activities
- 1Konkoly Astronomical Institute, Research Centre for Astronomy and Earth Sciences, HUN-REN, Budapest, Hungary (tomka.richard@csfk.org))
- 2Konkoly Astronomical Institute, Research Centre for Astronomy and Earth Sciences, HUN-REN, Budapest, Hungary (kereszturi.akos@csfk.org)
The methodology of this work consists the following sequence of steps: understanding the general topographic radial profile of ejecta plus bedrock uplift around differently sized moderately fresh craters, definition of mathematical formula to model the observed crater ejecta topography, subtraction the supposed tectonic uplift near to the rim of the crater to separate the ejecta, and definition of the sequence of ejecta layers. Two types of lunar datasets contributed to identify craters: for small size range (diameter < 2 km) LOLA Digital Elevation model with spatial resolution of 60 m/px were used to mark their appropriate shape, for large craters WAC Digital Elevation Model with spatial resolution of 100 m/px was evaluated. For the identification of the sequential order of layers (vertical stratigraphy), dating of the source crater is needed. However here a simpler approach has been applied: larger craters were assumed to be older and provide ejecta deeper in a given sequence, while smaller craters than those considered provide ejecta to very small areas of the total landing region.
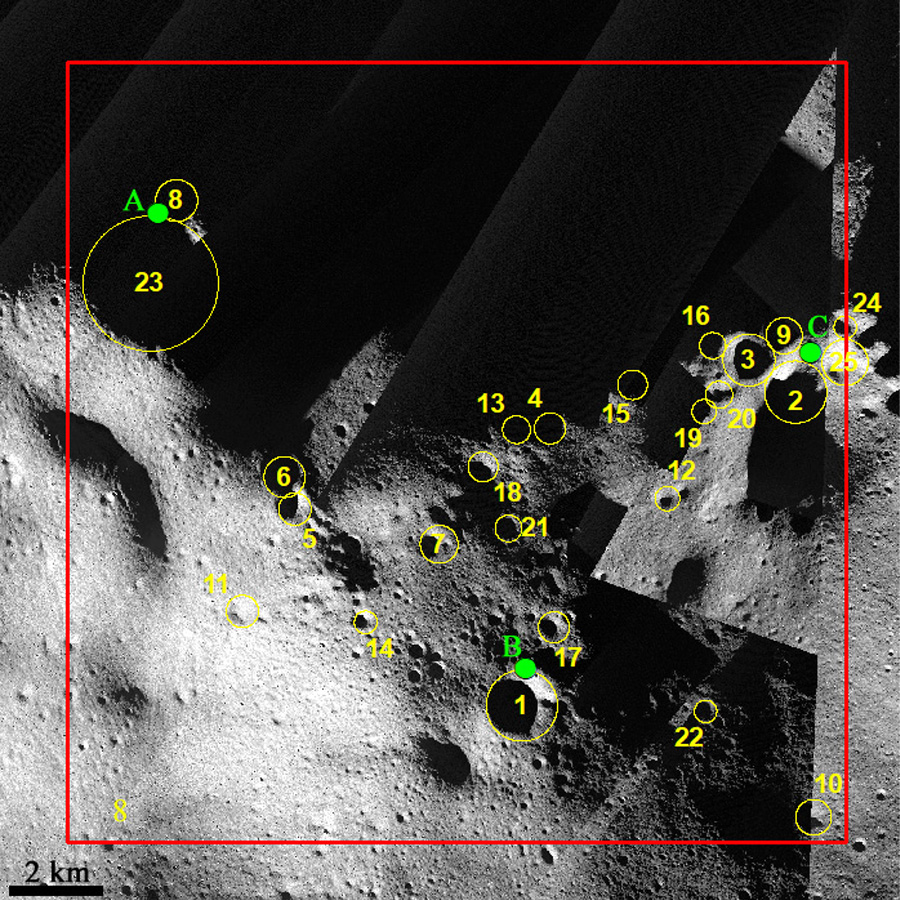
Figure 1. Optical view of the selected 25 craters and the place of the three stratigraphic points A, B, C) marked in an LRO Narrow Angle Camera Mosaic.
The modelled craters are marked in Figure 1. The calculated ejecta thickness plus stratigraphy using 25 local craters with diameters above 0.45 km were evaluated.
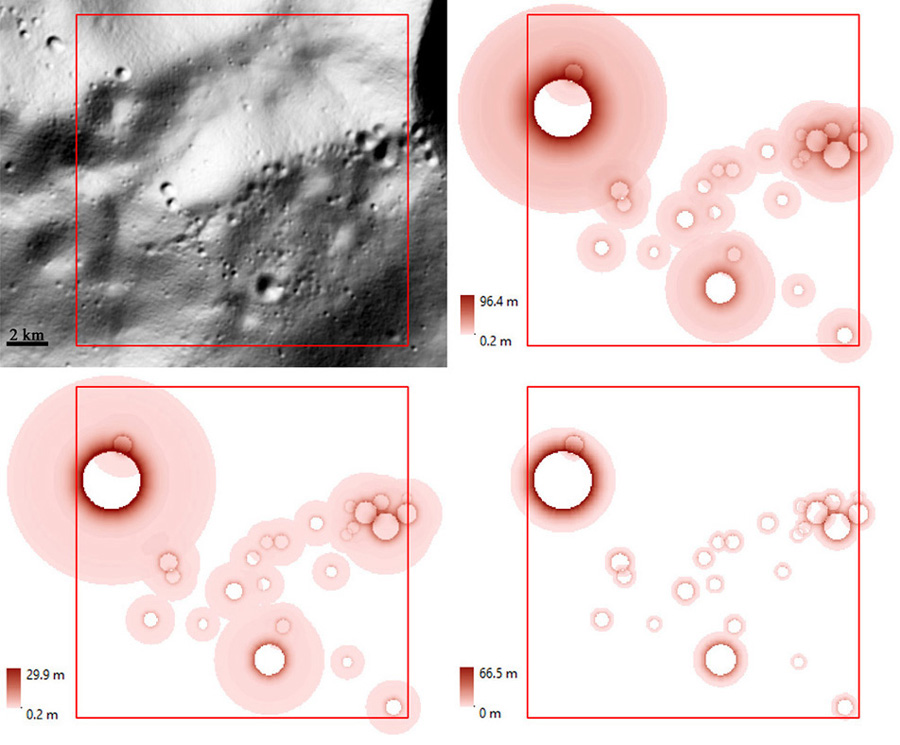
Figure 2. Topography from LOLA Digital elevation model (A), modelled ejecta thickness with basement uplift (B), ejecta without uplift (C) and only uplift (D) of the selected 25 craters.
Considering the uplift plus ejecta together, the maximal modelled surface elevation increase is 96.4 m at the rim of ID8 and ID23 craters (Figure 2B). Separately evaluating the bedrock uplift and ejecta components, in Figure 2D it can be seen that the uplift influenced only close to the elevated rim in all cases, in agreement with the dominant topography there. Considering the ejecta only in Figure 2C, it can be seen that the maximal thickness is close to the rim, without the uplift - and the ejecta covers a much larger area than the uplift. These estimations show that the crater ID23 has the highest ejecta thickness values: with the structural uplift is 80.2 m and without the structural uplift is 24.2 m at the rim. The diameter of this crater is 2.78 km and the maximum distance where its ejecta was considered (above roughly 1 cm thickness) is 4.98 km.
Summarizing the general numerical aspects of the results, 64 % of the target 256 km2 area was covered by any of the surveyed crater’s ejecta above about 1 cm minimal thickness. The largest areal coverage by a single crater was provided by the largest carter as expected, what was the ID23 (2.78 km diameter) with 28% areal coverage (72 km2).

Figure 3. Ejecta stratigraphy of three sample points (see their locations in Figure 1). The numbers indicated on or next to the vertical columns mark the identification number of the given crater.
Evaluating the ejecta superposition of the 25 craters, maximal up to 7 layers covered each other at the same location, making up a vertical strata of 10.9 m total thickness. Stratigraphic sequence of different ejecta layers was estimated using the simple approach: smaller craters are probably younger thus the sequence of ejecta order was defined to suppose the ejecta from the largest craters at the bottom (oldest event), and smaller craters (being younger) are located above those of larger ones. To demonstrate the possible expected sequence of layering three typical locations were analysed: the A, B, and C locations in Figure 1, where the vertical sequence of layers are presented in FIgure 3. The height of the three columns (along the vertical axis) marks the vertical thickness of the deposited ejecta from all considered craters.
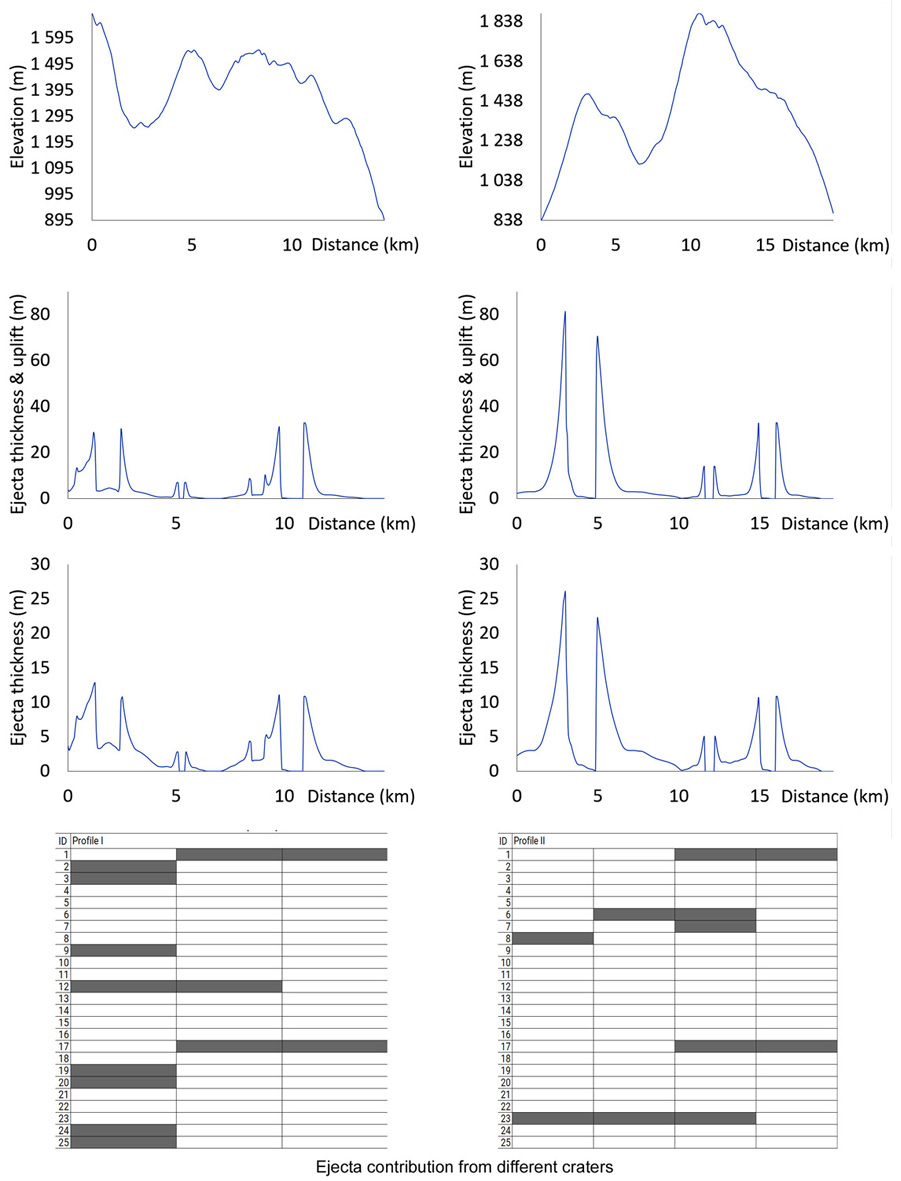
Figure 4. Ejecta related changes along two profiles regarding the topography from LOLA Digital elevation model (A1, B1 panels), ejecta thickness plus structural basement uplift (A2, B2 panels), and only the ejecta thickness along I. and II. profiles (A3, B3) indicated inFigure 2. The source craters of the ejecta within 5 km wide sections along the I. and II. profiles (A4, B4 panels) also can be seen below.
For further visualization of ejecta distribution, the change along two profiles (that crossed the A, B and C locations) are presented in Figure 4. The bedrock including profiles show larger thickness values, while the most dominant feature in both the second and third lines are the double peaks which mark the crossing of craters’ rims. These are the most elevated peaks both by the bedrock uplift (Figure 4 A2, B2) and also because the thickest ejecta layer formed closest to the rim (Figure 4 A3, B3).
References
(1) Takano et al. 2020. Experimental study on thermal properties of high porosity particles for understanding physical properties of Phobos surface. In: JpGU-AGU Joint Meeting, PPS08-P01.
(2) Kobayashi et al. 2023. Laboratory measurements show temperature-dependent permittivity of lunar regolith simulants. Earth Planets and Space 75:1, 8.
(3) Moriarty and Petro 2024. Journal of Geophysical Research: Planets, Volume 129, Issue 4, article id. e2023JE008266.
(4) Heather et al. 2024. The ESA PROSPECT Payload for CP22: Science Activities and Operations Planning. 55th LPSC, No. 3040, id.1085
How to cite: Tomka, R. K. and Kereszturi, Á.: GIS methods based ejecta layer estimation for the Moon to support research and ISRU activities, Europlanet Science Congress 2024, Berlin, Germany, 8–13 Sep 2024, EPSC2024-554, https://doi.org/10.5194/epsc2024-554, 2024.