- Technical University of Munich, TUM School of Engineering and Design, Professorship of Lunar and Planetary Exploration, Lise-Meitner-Str. 9, 85521 Ottobrunn, Germany (c.gscheidle@tum.de)
Introduction: Quantifying and mapping the precise amount of water ice in the subsurface of the Moon has proven challenging using only remote sensing data. However, this knowledge is crucial for planning long-term exploration missions that rely on the utilization of potential water reserves. Higher-resolution data and ground truth can be obtained by in situ measurements. Rover missions, such as NASA’s VIPER [1], promise to be highly valuable assets for lunar exploration as their mobility allows to analyse the lateral distribution of volatiles at much higher resolution than presently possible. Additionally, ESA’s upcoming PROSPECT mission [2] on a stationary lander will analyse the vertical distribution of water up to 1 m depth.
To somewhat remedy mass constraints and life-time limitations while still enabling scientific measurements, electric permittivity sensors can be utilized: Permittivity sensors measure the electric permittivity (and conductivity) in a low-frequency band, and are lightweight, have low impact on technical system budgets, and can acquire measurements quickly. Thereby, the soil’s porosity and water ice content can be deduced. As a drawback, the measurement depth of these sensors is limited to a few centimetres of measuring depth, on the same order of magnitude as the electrode size. Missions such as Cassini-Huygens [3] and Rosetta [4] have successfully demonstrated the concept and PROSPECT will feature a permittivity sensor integrated into its drill to characterize the vertical distribution of the lunar sub-surface at its landing position [2].
To combine the strengths of both rover mobility and permittivity sensor characteristics, small permittivity sensors can be attached to various surfaces, including rover wheels. At TUM, we currently develop such instrument arrangements, called patch electrodes, which will be used to identify and map the lateral abundance and state of lunar water ice at the lunar poles.
Background: Electrical permittivity is a measure of the electric polarizability of a dielectric and thus describes its ability to store energy in an electric field. Any mixture of materials between two electrodes and their respective relative permittivity influences the system’s electric capacitance. In the context of planetary exploration, this phenomenon can be exploited as the relative (static) permittivity of vacuum (=1), dry regolith (~5–8), and water ice (~80–100) differ significantly in both magnitude and behavior in the frequency domain over temperature [6]. Here, especially low temperatures are of interest [7].
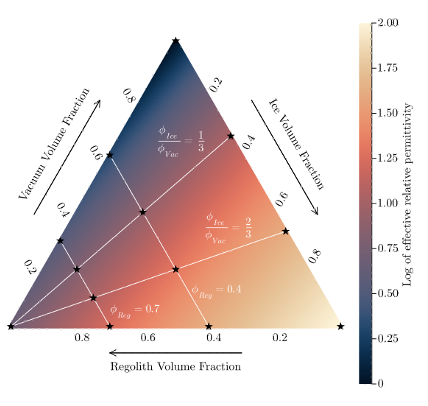
Measuring the capacitance of a calibrated system thus allows for the deduction of the material’s bulk effective electric permittivity. The composition is subsequently calculated using simulations of the electric field’s geometry and mixing rules linking the effective permittivity to the volume shares and individual relative permittivity, for example Looyenga’s rule [8]. Figure 1 shows the expected effective relative static permittivity at a temperature of -20 °C for the three-component mixture of water ice, regolith, and vacuum and Looyenga’s mixing law. Under the assumption of known bulk density, the mass of volatiles in the sample can be determined by regression of the differences between multiple frequencies.
Experimental Setup: For the investigations under cryogenic conditions, a pulse tube cooled facility was used. It enables cooling a small sample (~10 cm3) to temperatures below -150 °C.

Figure 1: Expected effective relative permittivity for the investigated mixture. Stars indicate the investigated mixtures. Adapted from [9].
Possible compositions of samples are indicated in Figure 1 with star markers. White lines depict two different regolith volume shares and two different ice-to-vacuum ratios. The values for investigated regolith samples are selected to represent loosely poured regolith and compacted regolith, while binary water/air mixtures represent loose and compacted snow. Additionally, calibration without the container was performed before and after the campaign to characterize the instrument background/noise.
Sample temperatures ranged from -150 °C to 0 °C and were measured on the sample container and on the electrode using thin Type-K thermocouples. Multiple repetitions were performed for all setups. The measurements were taken with a commercial microcontroller (Teensy 4.1) on a custom front-end electronics board and processed using Discrete Fourier Transformation as described in [9].

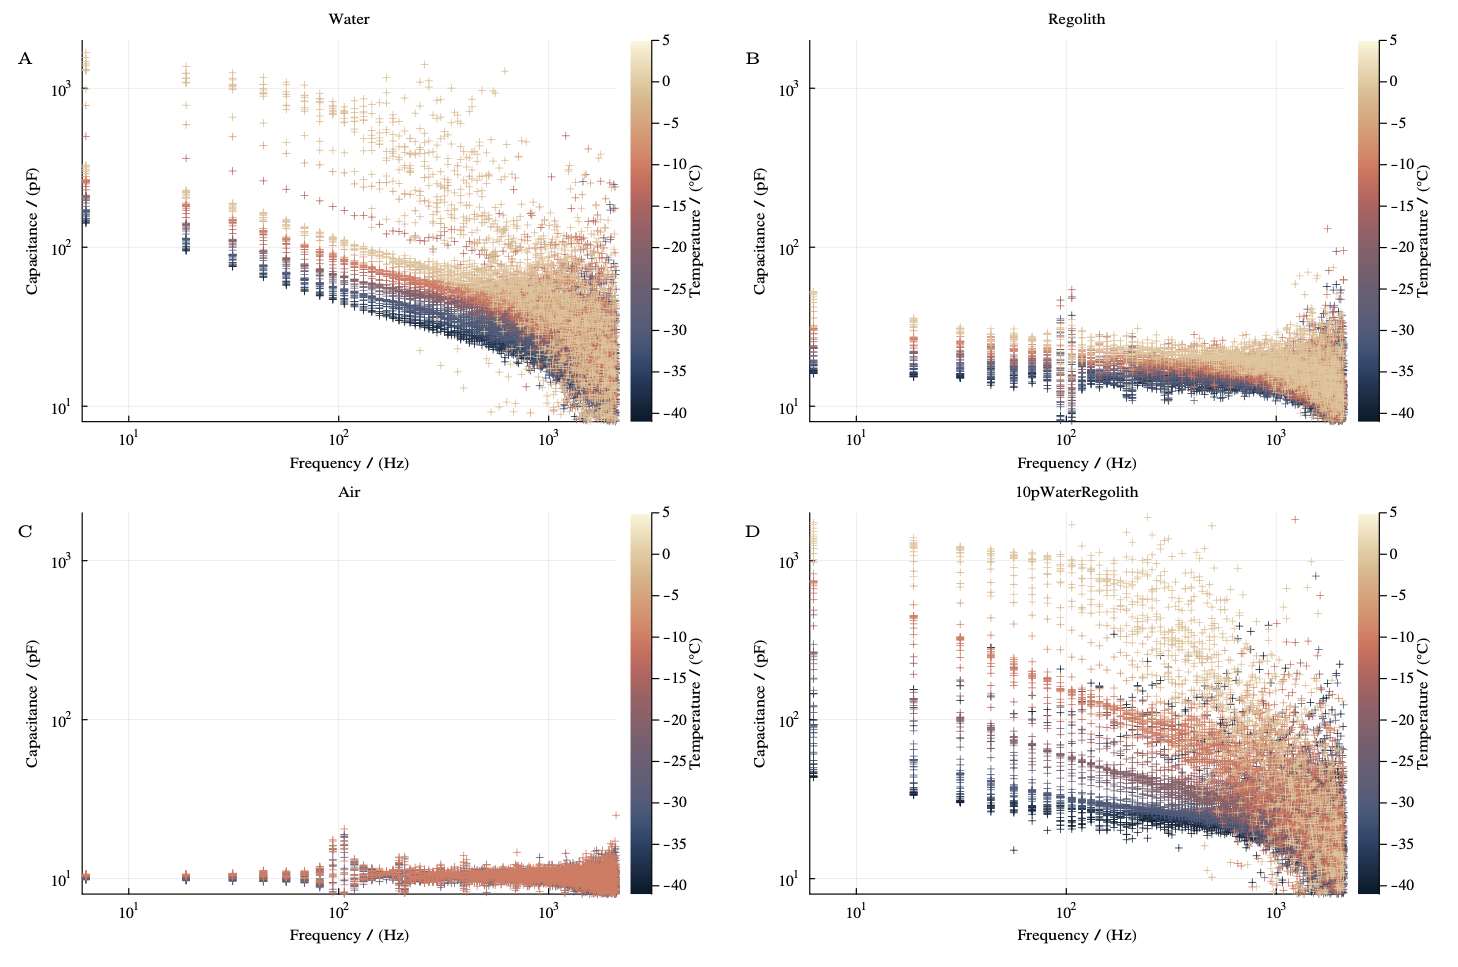
Figure 2: Capacitances derived from measurements with the patch permittivity sensor for (A) pure water, (B) JSC-1A regolith, (C) air and (D) a mixture of JSC-1A with 10 % water by weight.
Preliminary Results: Figure 2 shows the bulk capacitance over frequency derived from Fourier analysis evaluated from measurements with the setup for temperatures between -40 °C to 0 °C in approximately 10 °C intervals. The samples were distilled water, dried JSC-1A (moisture content < 0.1 %), air, and a mixture of dry simulant with 10 % by weight of distilled water. The base excitation frequency of 6.25 Hz and the 20 kHz sampling frequency were chosen based on experience from previous studies.
The capacitances for JSC-1A and air follow the expected trend of an approximately constant relative permittivity over frequency and show a good signal-to-noise ratio (> 10, not shown) up to around 500 kHz. The mixture exhibits a capacitance ranging between its individual constituents, which qualitatively matches the expected mixing law. The magnitude and frequency behaviour of the measurements amongst each other shows the technique’s robustness and repeatability and are similar to published data [5,7]. The capacitancesre also in the expected range based on numerical simulations (pF).
Outlook: Further improvements both to the instrument as well as to the experimental setup are foreseen in the near future. The signal-to-noise ratio can be increased at higher frequencies with a software-based increase in base excitation frequency. A shift to lower frequencies may yield a better resolution at the spectrums lower end. Other regolith simulants (e.g. NU-LHT-2M or EAC-1) will also be investigated to gain confidence in the mixing laws. The results from this study will directly feed into the investigation of the sensor’s sensitivity, accuracy, and detection limits, as well as its applicability for further exploration missions.
References: [1] Colaprete et al. (2021) NESF & ELS 2021 [2] Trautner R. et al (2024), Front. Space Tech. [3] Fulchignoni, M. et al. (2002) Space Sci. Rev. [4] Seidensticker, K. J. et al. (2007) Space Sci. Rev. [5] Nurge, M. A. (2012) Planet. Space Sci. [6] Sihvola, A. (2000) Subsurface Sensing Tech. and Appl. [7] Trautner R. et al. (2021) Meas. Sci. Technol [8] Looyenga (1965) Physica [9] Gscheidle C. et al (2024), Front. Space Tech.
How to cite: Gscheidle, C. and Reiss, P.: Investigation of Hydrated Regolith Simulant with Patch Permittivity Sensors for Planetary Exploration under Cryogenic Conditions, Europlanet Science Congress 2024, Berlin, Germany, 8–13 Sep 2024, EPSC2024-559, https://doi.org/10.5194/epsc2024-559, 2024.