MITM5 | In-situ planetary measurements

MITM5

In-situ planetary measurements
Convener: Erika Kaufmann | Co-conveners: Axel Hagermann, Mark Paton
Orals
| Wed, 11 Sep, 14:30–16:00 (CEST)|Room Saturn (Hörsaal B)
Posters
| Attendance Fri, 13 Sep, 14:30–16:00 (CEST) | Display Fri, 13 Sep, 08:30–19:00
Orals |
Wed, 14:30
Fri, 14:30
A session on all aspects of in situ science on planets covering historical instrumentation as well as future developments. Possible topics include science returned by and lessons learned from instruments but equal emphasis is on development studies, models and laboratory tests of the next generation of in-situ instrumentation for planetary exploration.

Orals: Wed, 11 Sep | Room Saturn (Hörsaal B)

Chairperson: Erika Kaufmann
14:30–14:40
|
EPSC2024-1183
|
ECP
|
On-site presentation
Martin Gillier, David Mimoun, Alexander E. Stott, Naomi Murdoch, Sylvestre Maurice, Baptiste Chide, Xavier Jacob, Justin N. Maki, Ralph D. Lorenz, and Michael H. Hecht

Introduction

The two microphones onboard the Perseverance rover have now been operating for more than three years on the surface of Mars. They have provided the first sound recordings at the Martian surface and the most extensive acoustic dataset recorded on another planet.  The Martian microphones have recorded sound waves, and more generally signals, from a wide variety of sources. Given the novelty of this dataset, we felt the need for a catalogue of Martian sounds. This catalogue contains a description of every type of sound both from an individual and a statistical perspective. This allows us to highlight the particular characteristics of each of the sources that can be retrieved from recording their sounds, including possible variations over time for recurring recordings. Using this catalogue, we also discuss scientific applications for each of the sound sources, highlighting how useful microphone data are to survey the Martian environment. Finally, the catalogue serves as a starting point for newcomers by demonstrating how to use the acoustic data and explaining which features of the recordings are already well understood and identifying others that are still open to investigation.

The Martian microphones

Two microphones are operated onboard the Perseverance rover. The SuperCam Microphone [1], located on the mast unit, operates in two modes, the MIC only mode where up to 167 s of sound at 25 kHz can be recorded, and the MIC+LIBS mode that record the shots of the LIBS instrument. More than 24 hours of recording have been acquired in the first mode and more than 6000 LIBS sequences have been recorded in the second one. The EDLCam microphone [2], located on the side of the rover body, can record for longer period of times at 48 kHz. More than 12 hours of recordings, mainly rover sound, have been acquired.

Both microphones are subject to operational constraints that shape the resulting dataset.

Environment sound sources

While not being strictly speaking a sound, the signal coming from the interaction between the wind and the microphone is always present on the recording at different levels. This allows the microphone to act as a high frequency wind sensor [3]. The spectra of the wind recording contain information about atmospheric turbulence near the Martian surface [4], which can be studied at different times of year and day thanks to the regular coverage offered by the microphone’s dataset.

The microphone-derived wind signal has been used to resolve the properties of a dust devil that was recorded during a rare direct encounter with the rover. During this event [5] the sound of the dust grains carried by the vortex impacting on the rover were also recorded, allowing an estimation of their number density.

Artificial sound sources

Sound recording around every LIBS shot contains information about the sound wave travel times and energy that can be used to study the temperature fluctuation [6] and the atmospheric turbulence [7]. This is made possible through the speed of sound and the scintillation measurements at different times of year thanks to the almost daily coverage in LIBS sound recording. Other artificial sounds such as the Ingenuity helicopter [8] or the operation of different parts of the rover (driving, drilling, abrading, MOXIE compressor [9], pumping of the heat rejection system fluid) were also recorded. These data were used to study the acoustic properties of the Martian atmosphere [10] and to monitor the health of the rover systems.

Conclusion

After three years at the Martian surface, Perseverance has sent back to Earth a rich dataset of acoustic recordings that has already yielded numerous scientific results. As it continues its journey at the surface of Mars, we expect that the microphones will bring greater detail to the established results as well as leading to new discoveries. Moreover, lessons learned on this mission will be useful for future acoustic experiments on other planetary bodies [11, 12].


[1] Mimoun et al. (2023) Space Science Reviews, 219 [2] Maki et al. (2020) Space Science Reviews [3] Stott et al. (2023) JGR : Planets [4] Stott et al. (2024) 10th International Mars Conference [5] Murdoch et al. (2022) Nat. Commun. [6] Chide et al. (2022) GRL [7] Chide et al. (2024) J. Acoust. Soc. Am. 155, 420–435.  [8] Lorenz et al. (2023) Planetary and Space Sciences 230.  [9] Hecht et al. (2021) Space Science Review [10] Chide et al. (2023) Earth and Planetary Science Letters 615 [11] Barnes et al. (2021) The Planetary Science Journal,2,4 [12] Gillier et al. (2024) IPPW

How to cite: Gillier, M., Mimoun, D., Stott, A. E., Murdoch, N., Maurice, S., Chide, B., Jacob, X., Maki, J. N., Lorenz, R. D., and Hecht, M. H.: A catalogue of Martian sound, Europlanet Science Congress 2024, Berlin, Germany, 8–13 Sep 2024, EPSC2024-1183, https://doi.org/10.5194/epsc2024-1183, 2024.

14:40–14:50
|
EPSC2024-790
|
ECP
|
On-site presentation
James Kingsnorth, Abhimanyu Shanbhag, Mário Balsemão, Gergana Bounova, Luka Pikulić, Leonardo Bonanno, Onė Mikulskytė, and Julian Rothenbuchner

Introduction

Mars’ feeble atmosphere and lack of a magnetosphere imply that the surface is exposed to ionizing radiation particles from solar winds as well as Galactic Cosmic Rays (GCRs). Thus, Martian radiation dose exposure is consequential for long-term human and robotic exploration. As such, it is critical to develop a rigorous and holistic understanding of the radiation surface environment using in-situ measurements acquired over large areas. Team Tumbleweed aims to revolutionise Mars exploration by offering a platform capable of navigating harsh terrain at lower costs and reduced mission risk. A swarm-based architecture, consisting of wind-driven Tumbleweed rovers, could open new doors for planetary science. Namely, a suite of miniaturized instruments hosted by this swarm would provide higher spatio-temporal resolutions for the characterisation of ionizing radiation and water equivalent hydrogen mapping at the near-surface level.

Problem Statement

Remote sensing measurements obtained from individual orbital instruments suffer from a lack of spatial and temporal resolution. For instance, the temporal resolution provided by orbiters is unable to satisfactorily capture time-dependent variations in quantities such as radiation exposure and particle spectra, resulting from episodic and cyclical events. 

Regarding spatial resolution, in the case of neutron spectrometers, this severely hampers the identification of mission-relevant water-ice deposits, as current spatial resolution provides data only at a resolution of 60 to 200 km (3600 km^2 per pixel, at best) from an altitude of 400 km (Malakhov et al., 2020).  As such, there are no high-resolution hydrogen or radiation exposure maps for Mars. Thus, ground truth measurements from the surface are indispensable. 

To date, investigations hosted on individual rovers have provided invaluable first measurements. However, forming a more complete understanding of Martian science necessitates investigations supported by infrastructures that can provide high spatio-temporal resolution and global scale coverage. In-situ measurements would not only provide higher spatial and temporal resolutions, but would also provide ground truth data for the corroboration of remote measurements made by orbiters. This calls for a diversification of exploration concepts and platforms to achieve maximum scientific return while reducing mission risk and cost.


Proposed Solution

Our proposed solution is a low-cost mission involving a swarm of wind-driven, box-kite-styled Tumbleweed rovers (Cohen et al., 2023).

To maximize the science return of each rover in the Tumbleweed swarm, we developed a methodology using scoring modifiers to assess instrument suitability based on mission goals. These were optimized against mass, volume and power constraints. This led to the following pre-selection of instruments:

  • Hand-lens style imager
  • Stereoscopic camera
  • Radiation spectrometer/particle camera
  • Neutron spectrometer
  • Electric field sensor
  • Wind sensor
  • Dust sensor
  • Pressure sensor
  • Temperature sensor
  • Soil pH sensor
  • Relative humidity sensor
  • Triaxial flux gate magnetometer

Exploring the synergies amongst our pre-selected list of instruments, we arrived at the opportunity to use radiation-focused instrumentation to simultaneously achieve high-resolution mapping of hydrogen in the near-surface environment.

Near-surface level water equivalent hydrogen (WEH) thermalizes neutrons when GCRs and Solar Particle Events finally interact with matter. Consequently, measuring the flux of epithermal neutrons is the best approach towards estimating hydrogen content in the Martian subsurface (Mitrofanov et al., 2022).

Hydrogen mapping at a high-spatial resolution is an essential factor in the definition of future human missions, and settlement, on Mars. As the atmosphere is composed of mostly carbon dioxide (95.32%), with WEH available a human mission would have access not only to water but to the products of the Sabatier reaction and subsequent water electrolysis (methane, water, hydrogen, oxygen), thus enabling ISRU and the production of Methalox, the rocket propellent that would be used for a safe return. 

Beyond hydrogen mapping, measuring cosmic rays may provide clues towards our comprehension of reality. Cosmic Ray Ensembles (CRE), for example, may exhibit large scale spatio-temporal correlations that would enable novel ways to study the properties of space-time, the nature of dark matter and the Lorentz invariance violation, empowering the scientific community in the research of these fundamental questions (Alvarez Castillo et al., 2023).

Additionally, our rovers would provide unprecedented data on Space Weather with the swarm architecture enabling multi-point measurements in the Martian planetary plasma system, illuminating the processes by which plasma interacts with the surface of celestial bodies lacking significant atmospheres. This would drive forward not only our understanding of atmospheric loss on Mars, but also deepen our understanding of its radiation environment and its dependence on the long-term solar cycle variation, altered during Coronal Mass Ejection events that shield the planet from GCRs (Holmstrom et al., 2024), for instance.

Combined hydrogen and radiation environment mapping are enabled by our current instrumentation pre-selection and magnified in scale by our mission architecture, potentially yielding a high-resolution spatio-temporal scouting of Mars. This, in turn, would allow a complete understanding of future possibilities for long-duration human missions to the Red Planet. Regions characterized by low radiation exposure and elevated concentration of sub-surface WEH would contribute towards identifying ideal candidate sites for future crewed missions.

Conclusion

The Tumbleweed Mission, featuring radiation and neutron spectrometers aboard a distributed network of spacecraft, holds the potential to revolutionize our understanding of Martian radiation environments and advance human exploration efforts by mapping hydrogen on the Red Planet. 

The Tumbleweed swarm would not only corroborate orbit-based measurements but also would provide invaluable information on the near-surface environment and their respective differences. Compared to orbital measurements, the Tumbleweed swarm can probe deeper into phenomena such as the effect of dust storms on ionizing radiation and the effect of diurnal and seasonal cycles. Furthermore, a Marswide network of radiation/cosmic-ray detectors would become a unique tool to study astrophysical phenomena, space weather and geophysics.

How to cite: Kingsnorth, J., Shanbhag, A., Balsemão, M., Bounova, G., Pikulić, L., Bonanno, L., Mikulskytė, O., and Rothenbuchner, J.: Scouting Ahead of Human Footsteps: The Role of the Tumbleweed Rover in Providing High-resolution Radiation and Water Mapping on Mars, Europlanet Science Congress 2024, Berlin, Germany, 8–13 Sep 2024, EPSC2024-790, https://doi.org/10.5194/epsc2024-790, 2024.

14:50–15:00
|
EPSC2024-1185
|
On-site presentation
Naomi Murdoch, Cecily Sunday, Alice Amsili, Simon Tardivel, Colas Robin, Damien Vivet, Panos Delton, Joshua Smith, Toni Tur-Garcia, Valerian LaLucaa, Nicolas Theret, Jean Bertrand, Julien Baroukh, Pierre Vernazza, Olivier Groussin, Lorda Jorda, Jens Biele, Hirdy Miyamoto, Stephan Ulamec, and Patrick Michel and the MMX Rover Locomotion Team

Introduction:  The JAXA Martian Moons Exploration (MMX) mission [1] will deploy the French-German IDEFIX rover (Fig. 1) to the surface of Phobos [2]. The IDEFIX rover will attempt wheeled-locomotion on a low-gravity surface for the first time thus providing a unique opportunity to study the surface properties of Phobos and the behaviour of regolith on small-bodies.


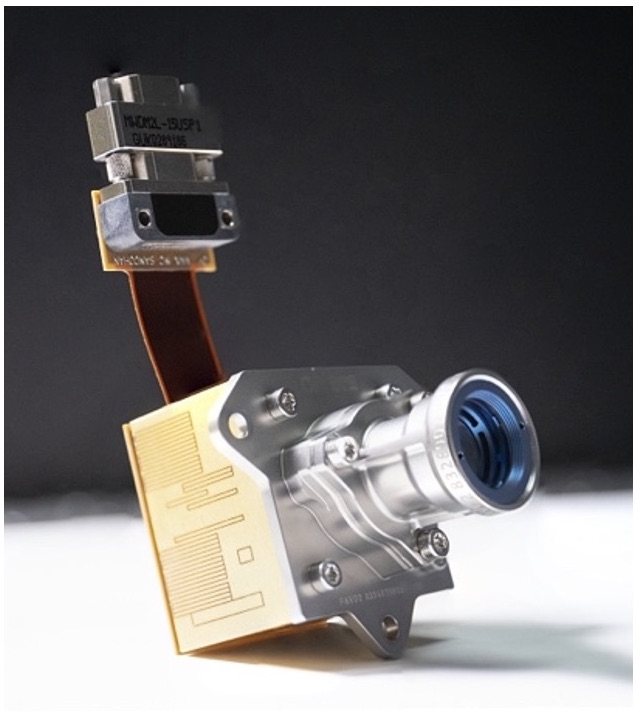
Figure 1 (left) The MMX IDEFIX rover (image credit: JAXA). (right) A WheelCam (image credit: CNES)

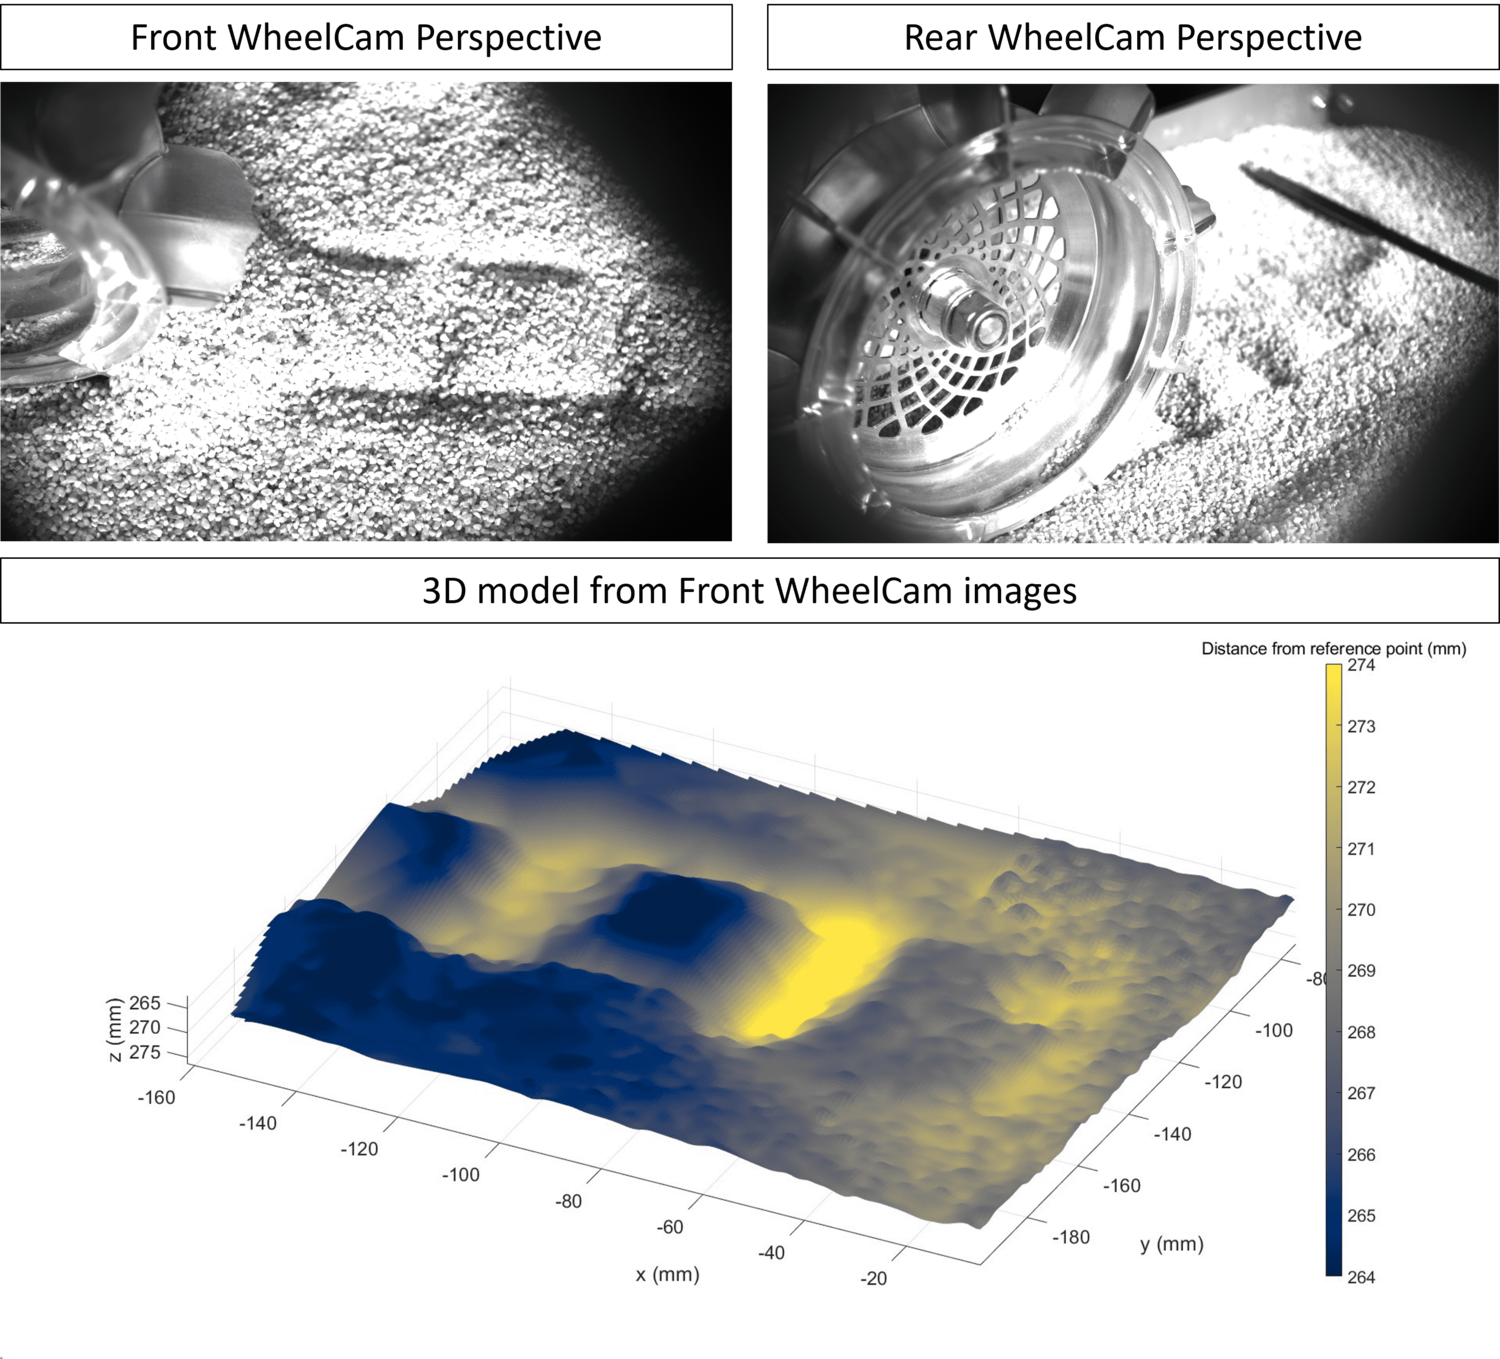
The WheelCams:  The IDEFIX rover includes two WheelCams, placed on the underside of the rover and each aimed at a different rover wheel [3]. The WheelCam image sensors are panchromatic and consist of a 2048 by 2048 array. The optics provide a field of view of 32.5° and a pixel resolution of approximately 100 μm at the centre of the image. The WheelCams are also equipped with LEDs to illuminate the scene; white LEDs to be used while driving, and three colour LEDs (590, 720 and 880 nm) to allow for multispectral imaging. The WheelCams can be operated in both an imaging and a movie mode. Typical movie frame rates are expected to be 1 image per mm moved for the front WheelCam, 1 image per cm moved for the rear WheelCam (the anticipated rover speed is ~0.1-4 mm/s).

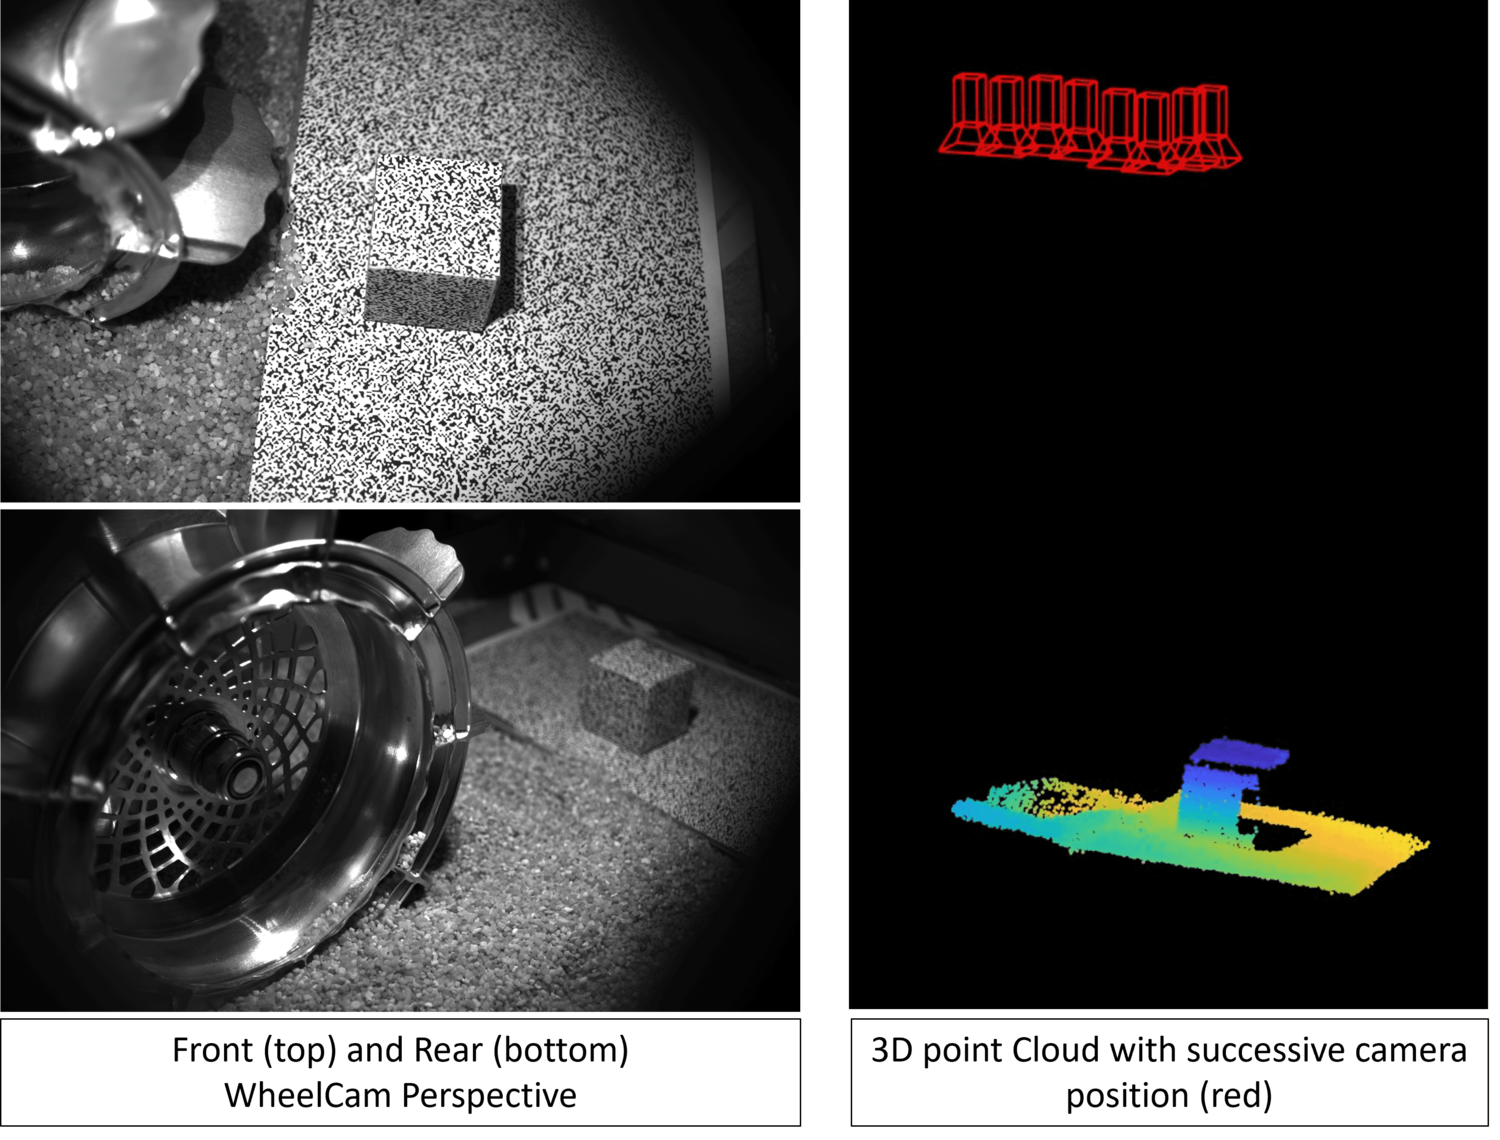
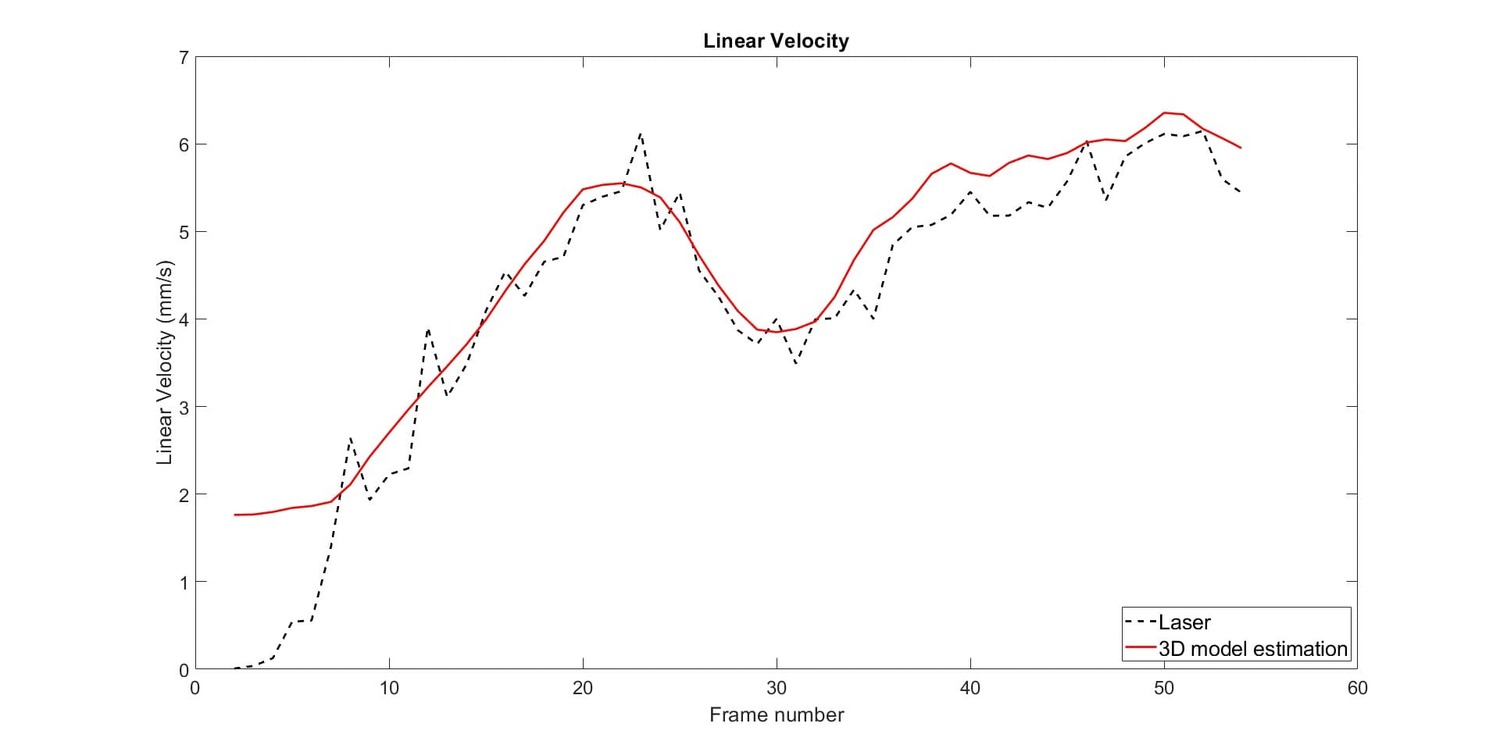
Science Objectives of the WheelCams: The WheelCam images will be used to characterize the general grain properties of the regolith (size distribution, morphological parameters [3]), within the limits of the resolution. The WheelCam images will also be used to determine the adhesive properties of regolith particles stuck to the rover wheels and the depth of the wheel sinkage, which is closely linked to the load bearing strength [4] and friction angle of the regolith [5].  The linear and angular velocities of the wheel will be calculated from the WheelCam images in order to provide measurements of the traction and slippage of the wheel. In addition to providing important information about the performance of the locomotion, this also provides the shearing characteristics of the regolith [6,7]. Topographical reconstruction of the rover tracks, talus and tailings behind the wheels [8] will provide additional constraints on the physical properties of the regolith.  Finally, using the coloured LEDs it will be possible to study the mineralogical composition of the regolith from reflectance and albedo measurements, and to asses space weathering by comparing inside and outside of the rover tracks.

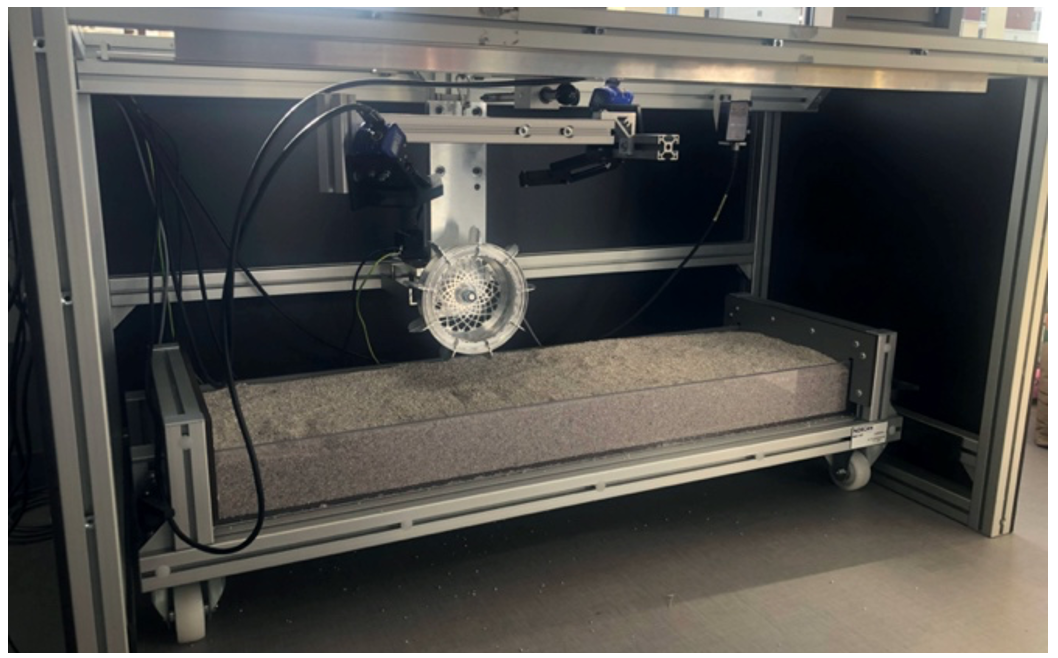
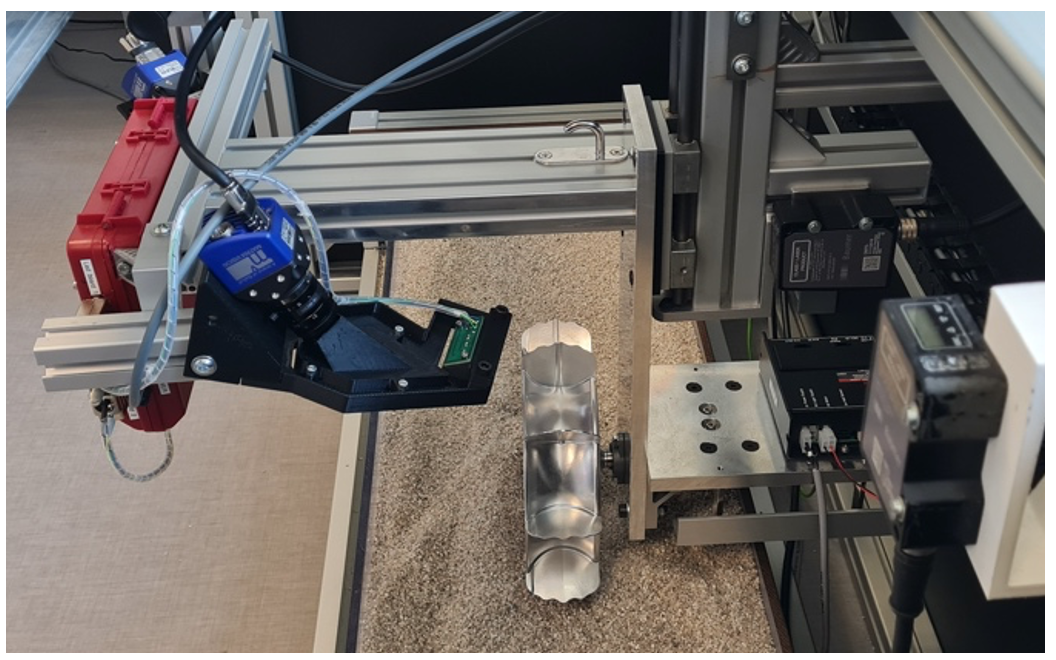
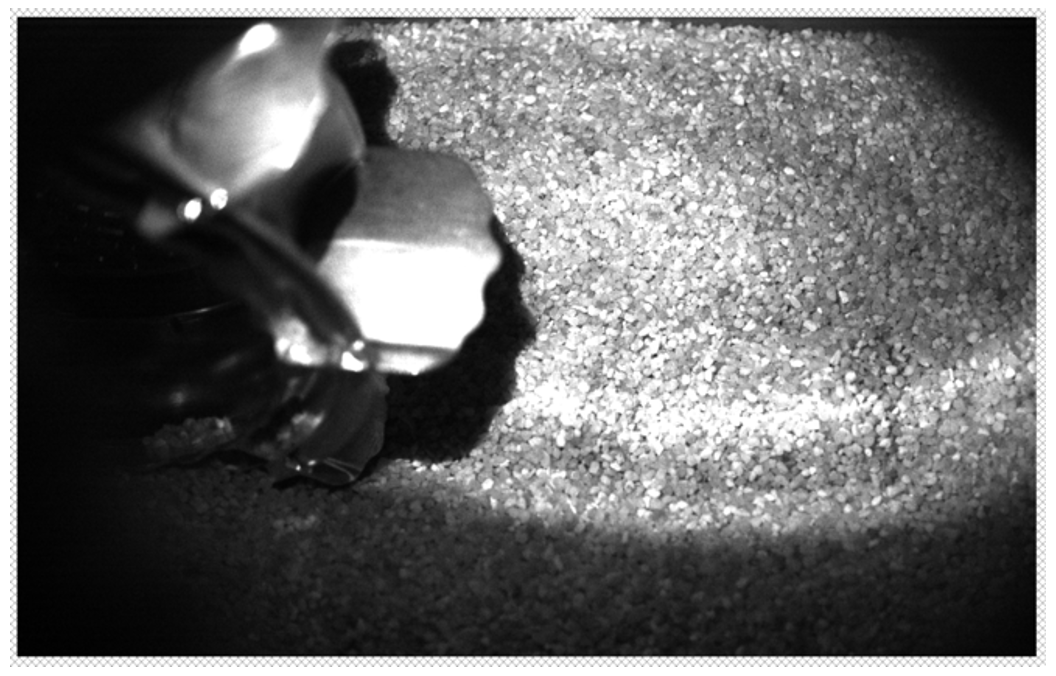
Preparing for the WheelCam analyses: In anticipation of the MMX mission, we have developed the MMX WheelCam testbed (Fig. 2, [9]) that recreates the scene that the WheelCams will observe during the mission (Fig. 3). The main objective of the testbed is to develop the image processing tools for the WheelCams. The testbed is instrumented with multiple sensors allowing measurements to be made of the sinkage of the wheel into the soil, and the slippage (essentially the loss of traction) of the wheel. The testbed also includes the MMX rover wheel, camera baffles, the LEDs and blackout panels to perform trials in representative lighting conditions. 


Figure 2. Two different views of the MMX WheelCam testbed at ISAE-SUPAERO.

Figure 3. WheelCam approximate field of views, as generated by the WheelCam testbed. (left) Front WheelCam perspective. (right) Rear WheelCam perspective.

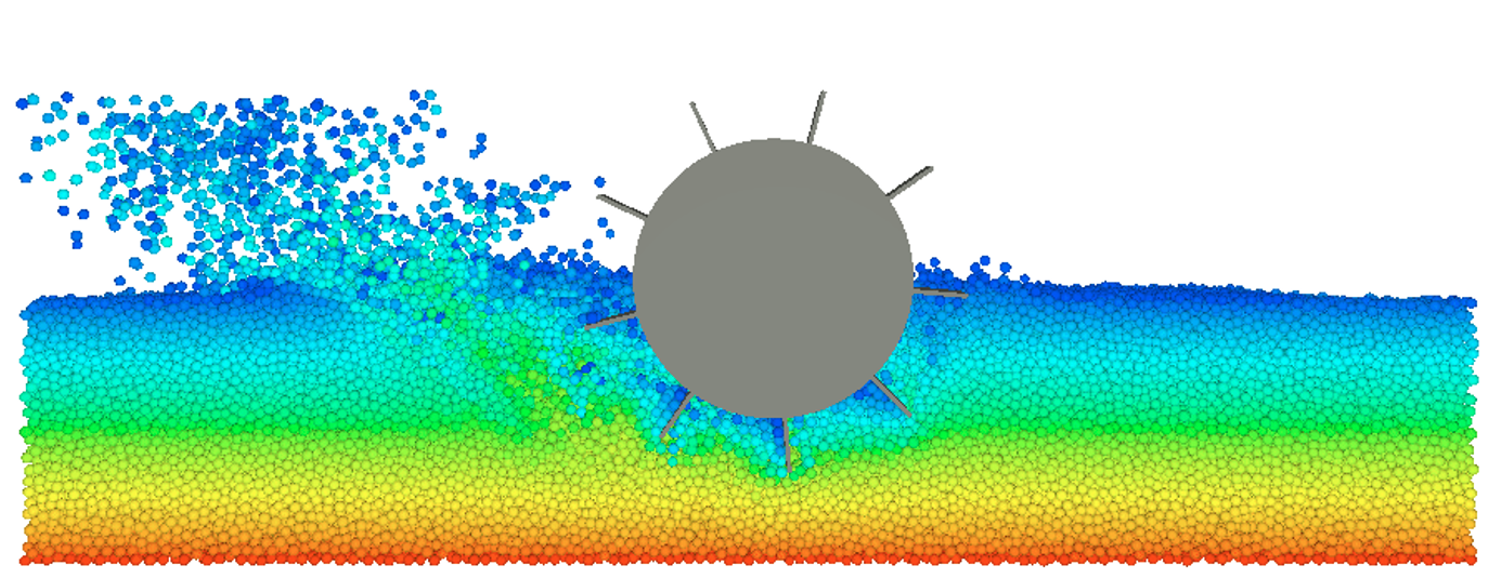
We also perform Discrete Element Method simulations [10] in order to understand the influence of the low gravity environment on sinking and driving behaviour (Fig. 4; [11, 12]]. This is essential to ensure an accurate determination of the regolith properties from the wheel – surface interactions.

Figure 4. Snapshot from a rolling simulation where gravity is 0.006 m/s2 and the rotational velocity is 0.65 rad/s [11,12].

Conclusions: This presentation will discuss the expected science return from the MMX IDEFIX rover WheelCams and provide a status of the preparatory activities and image processing pipelines under development.

Acknowledgments: We acknowledge CNES funding.

References: [1] Kuramoto, K. et al. EPS (2022), [2] Michel et al., EPS (2022), [3] Robin, C. et al., Nat. Comm. 2024, [4] Bigot, Lombardo et al. [5] Sullivan et al., JGR-Planets (2011), [6] Maimone, M. et al. J. Field Robotics (2007), [7] Reina, G. et al. IEEE/ASME Trans. On Mechatronics (2006), [8] Amsili, A. et al. EPSC 2024, [9] Passoni, L. et al., LPSC (2021), [10] Sunday, C. et al., MNRAS (2020), [11] Sunday, C., et al. EPSC (2022), [12] Sunday, C. PhD Thesis, ISAE-SUPAERO (2022).

How to cite: Murdoch, N., Sunday, C., Amsili, A., Tardivel, S., Robin, C., Vivet, D., Delton, P., Smith, J., Tur-Garcia, T., LaLucaa, V., Theret, N., Bertrand, J., Baroukh, J., Vernazza, P., Groussin, O., Jorda, L., Biele, J., Miyamoto, H., Ulamec, S., and Michel, P. and the MMX Rover Locomotion Team: The science goals of the IDEFIX rover WheelCams, Europlanet Science Congress 2024, Berlin, Germany, 8–13 Sep 2024, EPSC2024-1185, https://doi.org/10.5194/epsc2024-1185, 2024.

15:00–15:10
|
EPSC2024-133
|
On-site presentation
Shaosui Xu, Robert Lillis, Shannon Curry, Takuya Hara, David Curtis, Ellen Taylor, and Sarah Courtade and the ESCAPADE Team

Multi-spacecraft missions after 2000 (Cluster II, THEMIS, Van Allen Probes, and MMS) have revolutionized our understanding of the causes, patterns and variability of a wide array of plasma phenomena in the terrestrial magnetospheric environment. ESCAPADE is a twin-spacecraft Mars mission concept that will similarly revolutionize our understanding of how solar wind momentum and energy flow throughout Mars’ magnetosphere to drive ion and sputtering escape, two processes that have helped shape Mars’ climate evolution over solar system history.

ESCAPADE will measure magnetic field strength and topology, ion plasma distributions as well as suprathermal electron flows and thermal electron and ion densities, from precessing elliptical 150 x ~8500 km orbits. ESCAPADE are small spacecraft (<200 kg dry mass) built by Rocket Lab USA, following ballistic Hohmann transfers to Mars. Our strategically-designed 1-year, 2-part scientific campaign of temporally and spatially-separated multipoint measurements in different regions of Mars’ diverse plasma environment, will allow us to untangle spatial from temporal variability and unravel the cause-and-effect of solar wind control of ion and sputtering escape for the first time.

ESCAPADE is a Category 3 Class D Tailored small satellite mission selected under the SIMPLEX-2 program and funded by NASA’s Heliophysics division, with a PI-managed cost cap of <$60 million. UC Berkeley Space Sciences Laboratory provides project management, systems engineering, mission assurance, deployable booms, ion and electron electrostatic analyzers, and mission and science operations. NASA Goddard provides magnetometers. Embry Riddle Aeronautical University provides Langmuir probes. Advanced Space provides mission design. Designing, developing, and operating two spacecraft at Mars for this budget necessarily entails a combination of high heritage instrumentation, streamlined processes, and a higher risk tolerance than is common for many scientific missions. ESCAPADE is due to launch on Blue Origin’s New Glenn launch vehicle in late 2024. This presentation will focus on science topics, mission data products, lessons learned by NASA and the ESCAPADE team, and development/launch updates.

How to cite: Xu, S., Lillis, R., Curry, S., Hara, T., Curtis, D., Taylor, E., and Courtade, S. and the ESCAPADE Team: ESCAPADE Update: unraveling cause and effect in Mars’ hybrid magnetosphere, Europlanet Science Congress 2024, Berlin, Germany, 8–13 Sep 2024, EPSC2024-133, https://doi.org/10.5194/epsc2024-133, 2024.

15:10–15:15
15:15–15:25
|
EPSC2024-559
|
On-site presentation
Christian Gscheidle and Philipp Reiss

Introduction: Quantifying and mapping the precise amount of water ice in the subsurface of the Moon has proven challenging using only remote sensing data. However, this knowledge is crucial for planning long-term exploration missions that rely on the utilization of potential water reserves. Higher-resolution data and ground truth can be obtained by in situ measurements. Rover missions, such as NASA’s VIPER [1], promise to be highly valuable assets for lunar exploration as their mobility allows to analyse the lateral distribution of volatiles at much higher resolution than presently possible. Additionally, ESA’s upcoming PROSPECT mission [2] on a stationary lander will analyse the vertical distribution of water up to 1 m depth.

To somewhat remedy mass constraints and life-time limitations while still enabling scientific measurements, electric permittivity sensors can be utilized: Permittivity sensors measure the electric permittivity (and conductivity) in a low-frequency band, and are lightweight, have low impact on technical system budgets, and can acquire measurements quickly. Thereby, the soil’s porosity and water ice content can be deduced. As a drawback, the measurement depth of these sensors is limited to a few centimetres of measuring depth, on the same order of magnitude as the electrode size. Missions such as Cassini-Huygens [3] and Rosetta [4] have successfully demonstrated the concept and PROSPECT will feature a permittivity sensor integrated into its drill to characterize the vertical distribution of the lunar sub-surface at its landing position [2].

To combine the strengths of both rover mobility and permittivity sensor characteristics, small permittivity sensors can be attached to various surfaces, including rover wheels. At TUM, we currently develop such instrument arrangements, called patch electrodes, which will be used to identify and map the lateral abundance and state of lunar water ice at the lunar poles.

Background: Electrical permittivity is a measure of the electric polarizability of a dielectric and thus describes its ability to store energy in an electric field. Any mixture of materials between two electrodes and their respective relative permittivity influences the system’s electric capacitance. In the context of planetary exploration, this phenomenon can be exploited as the relative (static) permittivity of vacuum (=1), dry regolith (~5–8), and water ice (~80–100) differ significantly in both magnitude and behavior in the frequency domain over temperature [6]. Here, especially low temperatures are of interest [7].

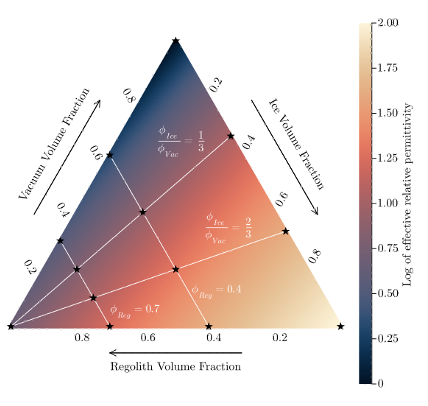
Measuring the capacitance of a calibrated system thus allows for the deduction of the material’s bulk effective electric permittivity. The composition is subsequently calculated using simulations of the electric field’s geometry and mixing rules linking the effective permittivity to the volume shares and individual relative permittivity, for example Looyenga’s rule [8]. Figure 1 shows the expected effective relative static permittivity at a temperature of -20 °C for the three-component mixture of water ice, regolith, and vacuum and Looyenga’s mixing law. Under the assumption of known bulk density, the mass of volatiles in the sample can be determined by regression of the differences between multiple frequencies.

Experimental Setup: For the investigations under cryogenic conditions, a pulse tube cooled facility was used. It enables cooling a small sample (~10 cm3) to temperatures below -150 °C.

Figure 1: Expected effective relative permittivity for the investigated mixture. Stars indicate the investigated mixtures. Adapted from [9].

Possible compositions of samples are indicated in Figure 1 with star markers. White lines depict two different regolith volume shares and two different ice-to-vacuum ratios. The values for investigated regolith samples are selected to represent loosely poured regolith and compacted regolith, while binary water/air mixtures represent loose and compacted snow. Additionally, calibration without the container was performed before and after the campaign to characterize the instrument background/noise.

Sample temperatures ranged from -150 °C to 0 °C and were measured on the sample container and on the electrode using thin Type-K thermocouples. Multiple repetitions were performed for all setups. The measurements were taken with a commercial microcontroller (Teensy 4.1) on a custom front-end electronics board and processed using Discrete Fourier Transformation as described in [9].

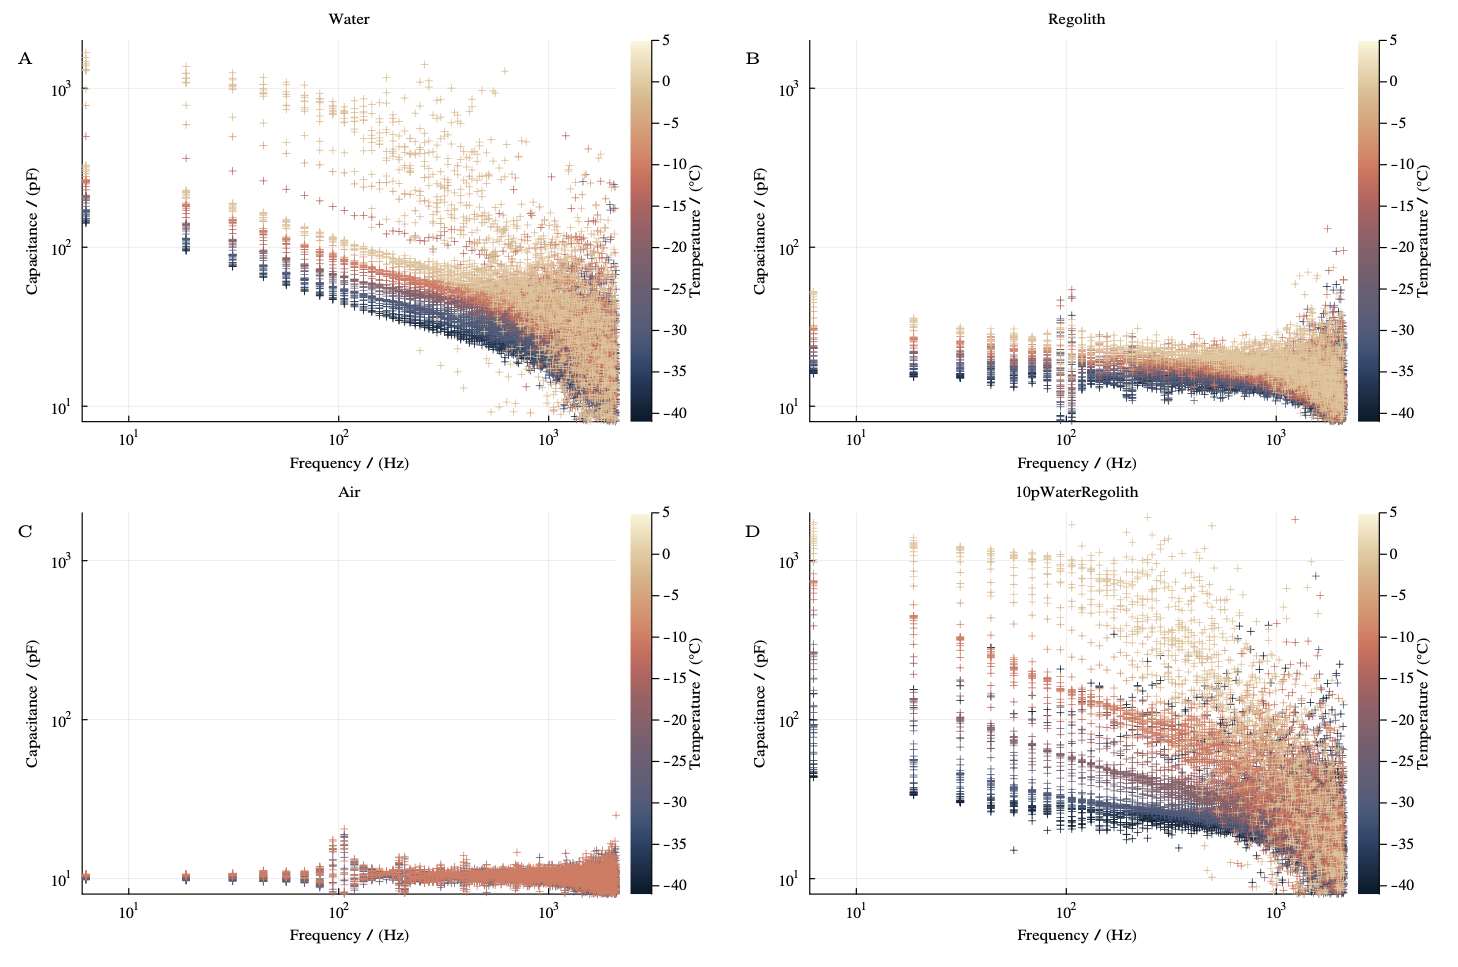
Figure 2: Capacitances derived from measurements with the patch permittivity sensor for (A) pure water, (B) JSC-1A regolith, (C) air and (D) a mixture of JSC-1A with 10 % water by weight.

Preliminary Results: Figure 2 shows the bulk capacitance over frequency derived from Fourier analysis evaluated from measurements with the setup for temperatures between -40 °C to 0 °C in approximately 10 °C intervals. The samples were distilled water, dried JSC-1A (moisture content < 0.1 %), air, and a mixture of dry simulant with 10 % by weight of distilled water. The base excitation frequency of 6.25 Hz and the 20 kHz sampling frequency were chosen based on experience from previous studies.

The capacitances for JSC-1A and air follow the expected trend of an approximately constant relative permittivity over frequency and show a good signal-to-noise ratio (> 10, not shown) up to around 500 kHz. The mixture exhibits a capacitance ranging between its individual constituents, which qualitatively matches the expected mixing law. The magnitude and frequency behaviour of the measurements amongst each other shows the technique’s robustness and repeatability and are similar to published data [5,7]. The capacitancesre also in the expected range based on numerical simulations (pF).

Outlook: Further improvements both to the instrument as well as to the experimental setup are foreseen in the near future. The signal-to-noise ratio can be increased at higher frequencies with a software-based increase in base excitation frequency. A shift to lower frequencies may yield a better resolution at the spectrums lower end. Other regolith simulants (e.g. NU-LHT-2M or EAC-1) will also be investigated to gain confidence in the mixing laws. The results from this study will directly feed into the investigation of the sensor’s sensitivity, accuracy, and detection limits, as well as its applicability for further exploration missions.

References: [1] Colaprete et al. (2021) NESF & ELS 2021 [2]  Trautner R. et al (2024), Front. Space Tech. [3] Fulchignoni, M. et al. (2002) Space Sci. Rev. [4] Seidensticker, K. J. et al. (2007) Space Sci. Rev. [5] Nurge, M. A. (2012) Planet. Space Sci. [6] Sihvola, A. (2000) Subsurface Sensing Tech. and Appl. [7] Trautner R. et al. (2021) Meas. Sci. Technol [8] Looyenga (1965) Physica [9] Gscheidle C. et al (2024), Front. Space Tech.

How to cite: Gscheidle, C. and Reiss, P.: Investigation of Hydrated Regolith Simulant with Patch Permittivity Sensors for Planetary Exploration under Cryogenic Conditions, Europlanet Science Congress 2024, Berlin, Germany, 8–13 Sep 2024, EPSC2024-559, https://doi.org/10.5194/epsc2024-559, 2024.

15:25–15:35
|
EPSC2024-349
|
On-site presentation
Dawei Liu, Bin Liu, Jianjun Liu, Hongbo Zhang, Yan Su, Xinying Zhu, and Chunlai Li

Introduction:  In December 2020, China’s Chang’E-5 (CE-5) mission successfully landed in the northeastern part of Oceanus Procellarum on the Moon and achieved its goal of collecting lunar surface samples[1]. Chang’E-6 (CE-6) is China’s second lunar sample return mission following the CE-5 mission, and were launched on 3rd May 2024 . The CE-6 landing zone has been selected to lie within the lunar farside South Pole–Aitken (SPA) basin in the southern part of the Apollo basin[2]. Both CE-5 and CE-6 missions are equipped with the Lunar Mineralogical Spectrometer (LMS) to conduct surface spectral scanning to obtain the mineralogical infromation of the sampling area. The LMS can acquire hyperspectral data from 480 nm to 3200 nm[3]. Due to in-orbit working time and condition limitations, LMS could not complete whole sampling area scanning using hyperspectral detection mode and has to adopt multispectral detection mode. In this study, we mainly introduced the design of band selection for the LMS multispectral detection mode.

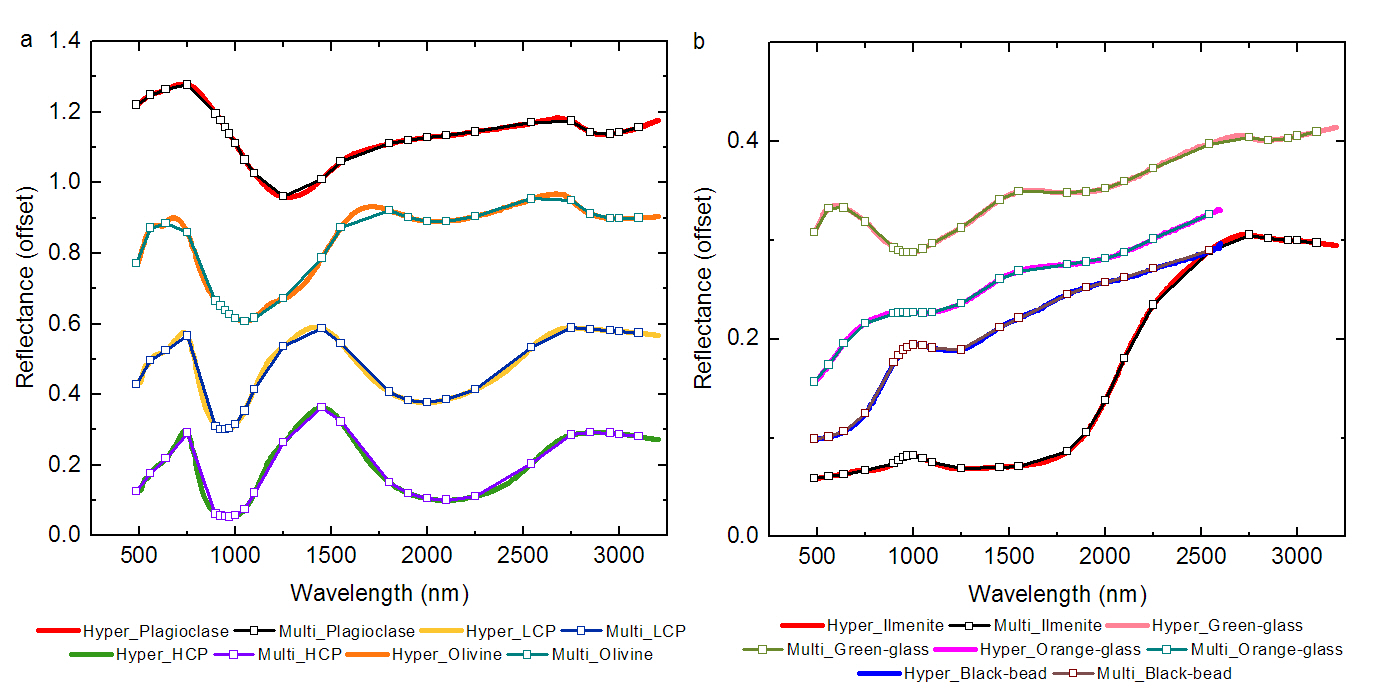
Designed LMS multi-bands for CE-5 mission:  Remote sensing data reveals that the spectra of the CE-5 landing area exhibit longer-wavelengths ~1 μm and 2 μm absorptions, indicating that the CE-5 mare basalts are primarily composed of high-Ca pyroxene (HCP). Spectra of CE-5 landing area also show a much weaker 2 μm absorption relative to their 1 μm absorption, resembling the spectral characteristics of olivine[5]. In addition, CE-5 landing area contains a large amount of ejected materials from surrounding regions, including basaltic materials dominated by low-Ca pyroxene (LCP) from western old IM basaltic regions and materials dominated by plagioclase from the eastern highlands. Products associated with volcanic activity such as volcanic glass and ilmenite are also likely to contribute to the material in CE-5 landing area. Considering the spectral features of these mineral/glass and taking into account wavelength positions that can be used to estimate Fe, Ti and maturity as well as OH-/H2O, we finally selected 20 bands combination for CE-5 LMS (Table 1).

Optimization of multi-bands for CE-6 mission: The pyroxene composition of CE-6 landing area has changed significantly, ranging from Mg-rich LCP to Fe, Ca-rich HCP[2]. Spectral interpretation of pyroxene compositions of CE-6 landing area will greatly influence the analysis of the origin of the returned samples (mantle or lower crust). Therefore, for CE-6 mission, we increased the number of the selected bands around ~1 μm and 2 μm absorption to more accurately dipict the variation of absorption center of lunar soils resulting from the changing composition of pyroxene. Besides, to better characterize OH-/H2O absorption, we optimized the positions and increased the number of bands for 2200 nm-3200 nm regions (Table 1).

 Evaluation on displaying spectral features:

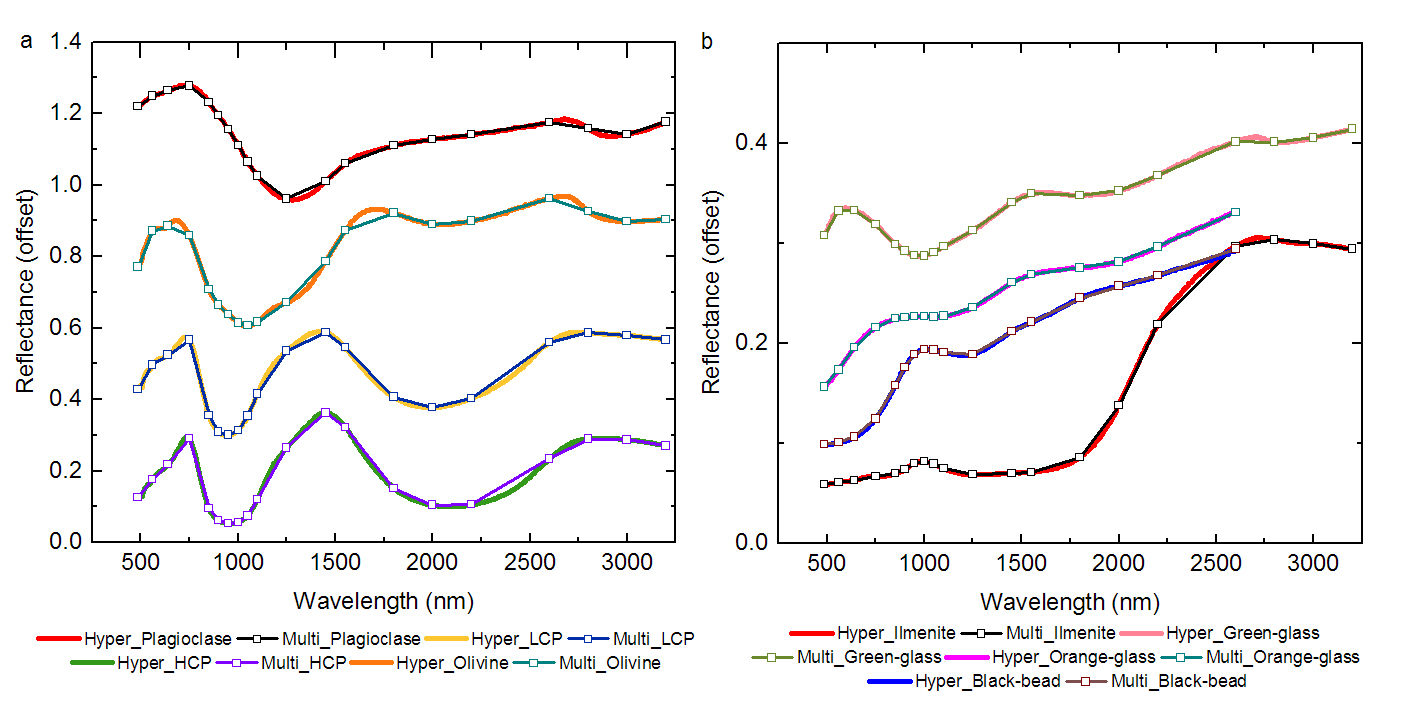
In general, the designed multi-bands can well display the hyperspectral features (measured by RELAB) of mineral/glass separated from lunar soils. LCP exhibits a shorter-wavelength absorption ~2000 nm, consistent with its hyperspectral data. HCP shows a flattening between ~2000 nm and ~2200 nm, indicating that its absorption center should be located between these two bands. The multispectral data allows for the effective display of olivine’s broader 1 μm absorption, and the hyperspectral features of the three types of lunar volcanic glasses are also well reproduced, particularly the longward 1 μm and shortward 2 μm wide absorptions. Compared to the multi-bands spectra of CE-5, the designed bands combination for CE-6 seems to be more efficient in reflecting the absorptions around ~2 μm and ~2.8 μm because of the optimization and increased number of bands selected for these two spectral regions.

References: [1] Li C. et al. (2022) NSR, 9, 2, nwab188. [2] Zeng X. et al. (2023) Nature Astronomy, 7, 1188-1197. [3] He Z. (2019) J. Appl. Remote Sens, 13(2). [4] Liu D. et al. (2002) Nature Communictions,13, 5965. [5] Staid M. I. et al. (2011) J. Geophys. Res. Planets, 116, E6.

Figure 1. Comparison between hyperspectral and multispectral data of minerals and glasses composing lunar soils. The multispectra were obtained by re-sampling the hyperspectra according to the spectral response function of CE-5 LMS multispectral detection mode.

Figure 2. Comparison between hyperspectral and multispectral data of minerals and glasses composing lunar soils. The multispectra were obtained by re-sampling the hyperspectra according to the spectral response function of CE-6 LMS multispectral detection mode.

Table 1  Designed LMS multi-bands

CE-5 (nm)

CE-6 (nm)

Main Application

485

485

Ilmenite, TiO2

560

560

Ilmenite, TiO2

640

640

Ilmenite, Black bead

750

750

1μm absorption shoulder, maturity, FeO and TiO2

850


olivine

900

900

LCP


925

LCP

950

950

LCP/HCP, maturity, FeO and TiO2


970

HCP

1000

1000

HCP

1050

1050

HCP, olivine

1100

1100

olivine, volcanic glass

1250

1250

olivine, plagioclase, volcanic glass

1450

1450

 1μm absorption shoulder, olivine

1550

1550

1μm or 2μm absorption shoulder, plagioclase

1800

1800

LCP


1900

LCP

2000

2000

LCP/HCP


2100

HCP

2200


HCP


2250

HCP


2540

LCP/HCP shoulder,  OH-/H2O shoulder

2600


OH-/H2O shoulder


2750

OH-/H2O shoulder

2800


OH-/H2O


2850

OH-/H2O


2950

OH-/H2O

3000

3000

OH-/H2O


3100

OH-/H2O

3200


OH-/H2O


How to cite: Liu, D., Liu, B., Liu, J., Zhang, H., Su, Y., Zhu, X., and Li, C.: Bands Selection for Multispectral Detection Mode of Lunar Mineralogical Spectrometer of China’s Chang’E-5 and Chang’E-6 Missions, Europlanet Science Congress 2024, Berlin, Germany, 8–13 Sep 2024, EPSC2024-349, https://doi.org/10.5194/epsc2024-349, 2024.

15:35–15:45
|
EPSC2024-549
|
On-site presentation
Beatriz Sanchez-Cano, Marco Pinto, Olivier Witasse, Patricia Gonçalves, Wojtek Hajdas, Andre Galli, Francisca Santos, Antonio Gomes, Emma Bunce, Laura Rodríguez-García, Rami Vainio, Go Murakami, Arto Lehtolainen, Emilia Kilpua, Daniel Heyner, Philipp Oleynik, Manuel Grande, and Johannes Benkhoff

The space environment is known to be populated by highly energetic particles that may be hazardous for the health of missions and impact planetary environments. The effects of these particles are commonly known as Space Weather. Monitoring interplanetary Space Weather in the Solar System is currently a challenging but essential activity that requires a good knowledge of the Sun and solar wind conditions, the local space environments (including solar wind-magnetosphere-ionosphere coupling), and the interaction of each spacecraft with its local environment. Consequently, understanding the chain of processes that control Space Weather at any planet or spacecraft on various time scales is important to accurately forecast and prevent hazardous conditions for a mission, and ultimately humans, throughout the Solar System.

These energetic particles originate from three main sources: (1) Galactic Cosmic Rays (GCRs), a low flux of protons (90%), heavy ions, and to some extent electrons, with energies up to 10E21 eV, arriving from outside of the Solar System; (2) Solar Energetic Particles (SEPs), sporadic and unpredictable bursts of electrons, protons, and heavy ions, travelling much faster than the space plasma, accelerated in Solar Flares and Coronal Mass Ejections; and (3) planetary trapped particles, a dynamic population of protons and electrons trapped around planetary magnetospheres first discovered at Earth by Van Allen. Solar activity is responsible for transient and long-term variation of the radiation environment. These three components of radiation in space combine into a hazardous environment for both manned and unmanned missions and are responsible for several processes in planetary bodies. Therefore, it is important to monitor and comprehend the dynamics of energetic particles in space.

BepiColombo and JUICE are two planetary missions from the European Space Agency that are currently travelling to their final destinations, i.e., Mercury and the Jovian system, respectively. Both of them have very long cruises within the Solar System. For BepiColombo, the journey is of 7 years (2018-2025) and for JUICE of 8 years (2023-2031). These long trips provide not only exceptional measurements for cross-calibration of instrumentation, but also for unique science opportunities including  collaborations with other solar missions, such as Parker Solar Probe and Solar Orbiter that are characterising the plasma environment within the Solar System. Additionally, JUICE and BepiColombo can also act as upstream solar wind monitors for other planets such as Venus,  Earth, Mars and Jupiter.

BepiColombo has a large suite of instruments dedicated to plasma and solar physics, most of them operating on regular basis during the cruise phase, such as the Solar Intensity X-Ray and Particle Spectrometer (SIXS), the BepiColombo Environmental Radiation Monitor (BERM), the Solar Particle Monitor (SPM), and the BepiColombo Planetary Magnetometer (MPO-MAG). Some instruments are operated on specific solar wind campaigns. In the case of JUICE, only the RADiation hard Electron Monitor (RADEM) is in continuous operation, the other instruments operate twice per year for a health check, during planetary swingbys, and potentially for longer periods in the second part of the cruise, once JUICE is further away from the Sun, and closer to its final destination.

In this work, we report on the solar energetic particle observations detected by both missions and the interplanetary magnetic fields (for the case of BepiColombo only), and how this unique opportunity for cruise observations is significantly helping the planetary and heliophysics communities to characterise Space Weather in the inner Solar System.


How to cite: Sanchez-Cano, B., Pinto, M., Witasse, O., Gonçalves, P., Hajdas, W., Galli, A., Santos, F., Gomes, A., Bunce, E., Rodríguez-García, L., Vainio, R., Murakami, G., Lehtolainen, A., Kilpua, E., Heyner, D., Oleynik, P., Grande, M., and Benkhoff, J.: Space Weather monitoring with BepiColombo and JUICE during their cruise phases, Europlanet Science Congress 2024, Berlin, Germany, 8–13 Sep 2024, EPSC2024-549, https://doi.org/10.5194/epsc2024-549, 2024.

15:45–15:55
|
EPSC2024-552
|
Virtual presentation
Steven M Hill, Dimitrios Vassiliadis, Rob Redmon, and Jeff Johnson

The National Oceanic and Atmospheric Administration (NOAA) Space Weather Follow-On (SWFO) program includes a suite of in situ plasma instrumentation on the SWFO-L1 spacecraft along with compact coronagraphs (CCOR) on both SWFO-L1 and the GOES-U geostationary weather satellite. GOES-U is currently slated to launch in June 2024 and SWFO-L1 is slated to launch in April 2025. Here we provide an overview of the spacecraft and missions along with their instrumentation and products. The GOES-U CCOR-1 will be the first coronagraph flown for operational space weather monitoring. The SWFO-L1 in situ instruments include the Solar Wind Plasma Sensor (SWiPS), SupraThermal Ion Sensor (STIS), and a pair of fluxgate magnetometers (MAG). The in situ measurements for the plasma and interplanetary magnetic field (IMF) will be critical for driving NOAA’s magnetospheric and ionospheric models in real time. The suprathermal ion and electron measurements will be useful for early forecasts of arrival of geoeffective structures such as CMEs and interplanetary shocks. NOAA’s National Environmental Satellite, Data, and Information Service (NESDIS) will provide tracking and control along with data acquisition for the observations. The Space Weather Prediction Center (SWPC) will perform the real-time processing, product generation, and dissemination. The National Centers for Environmental Information (NCEI), part of NESDIS, will curate the data products for non-real-time (retrospective) users to browse and access via a comprehensive API and the upcoming Space Weather Portal. The SWFO Program will complement existing and planned observations from other satellites currently in NOAA’s satellite fleet along with satellites of partner domestic and international partner organizations.

How to cite: M Hill, S., Vassiliadis, D., Redmon, R., and Johnson, J.: NOAA’s Space Weather Follow-On (SWFO) Program, Europlanet Science Congress 2024, Berlin, Germany, 8–13 Sep 2024, EPSC2024-552, https://doi.org/10.5194/epsc2024-552, 2024.

15:55–16:00

Posters: Fri, 13 Sep, 14:30–16:00

Display time: Fri, 13 Sep 08:30–Fri, 13 Sep 19:00
Chairperson: Erika Kaufmann
EPSC2024-239
|
On-site presentation
Yan Su, Chunlai Li, Jianjun Liu, Xinying Zhu, Bin Liu, Dawei Liu, and Zongyu Zhang

Ground Penetrating Radar (GPR) technology has been extensively applied in Chinese lunar exploration. The first attempt to survey the Moon’s subsurface using a GPR onboard a rover was made during the Chang’E-3 (CE-3) mission, which featured dual-frequency channels (G.Y. Fang, et al., 2014). The identical Lunar Penetrating Radar used in the CE-3 mission, was successfully deployed during the Chang’E-4 (CE-4) mission. It effectively explored the subsurface structure to a depth of ~ 40m within the South Pole-Aitken Basin, located on the farside of the moon (C.L. Li, et al., 2020).

Another remarkable design is the GPR of the Chang'e-5 (CE-5) mission. Because GPR for the CE-5 mission was mounted on the lander rather than on the rover, it was necessary to break the conventional design pattern. To address this challenge, an antenna-array radar was deployed,making the first application in the deep space mission. The array radar is named the Lunar Regolith Penetrating Radar (LRPR). The LRPR comprises a controller, a pair of transmitter and receiver, a distribution unit, a cable assembly, and an antenna array, which consists of 12 ultra-wideband time-domain antennas. As shown in Fig.1, these antennas are mounted asymmetrically around the drilling system as the bottom of the lander. Operating under a multiview/multistatic configuration, one antenna transmits while the other 11 antennas receive backscattered echoes during one measurement period(Y.X. Li, et al., 2019). Such configuration allows for the collection of 132 trace data. The complete measurement stage for the 12 transmitting antennas lasts ~18 minutes.

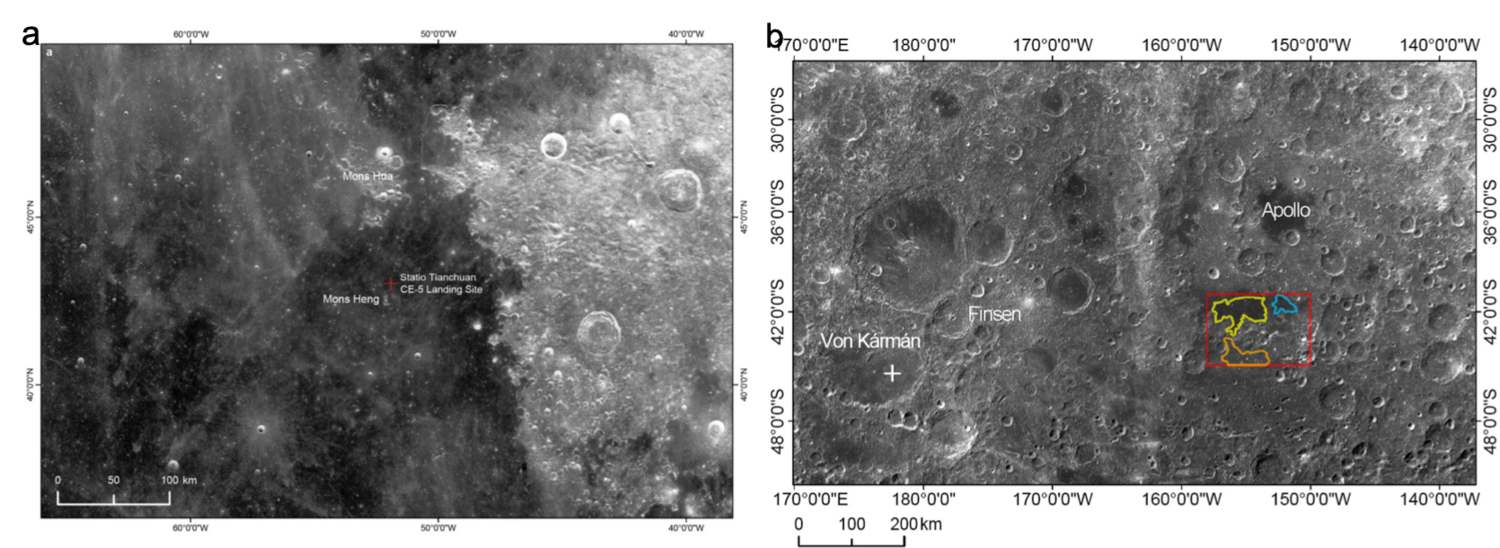
The Chinese CE-6 mission was successfully launched on May 3rd, 2024. The CE-6 landing zone has been selected to lie within the lunar farside South Pole–Aitken (SPA) basin in the southern part of the Apollo basin (150–158° W, 41–45° S), a site that provides access to a diversity of SPA material (see Fig.3). The CE-6 lander also carries the same radar instrument used in CE-5 mission, the LRPR. The primary objective of the LRPR is to investigate the interior structure of the local regolith and identify potential underground hazards that could pose risks to the drilling activity. Understanding the interior structures of lunar regolith is crucial for comprehending surface resulting from processes, such as impact cratering. Local stratigraphy provides the contextual information for interpreting the origin of samples collected from both the surface and the drilling core.

In this report, we will detail the signal calibration, data processing procedures of the array radar, and present the results obtained from the CE-5 LRPR. The CE-6 LRPR is expected to commence operations by the end of May. If successful, we will provide updates on the new results obtained. Given that the scheduled CE-6 landing site is situated within the most prominent SPA basin(see Fig.3), we are hopeful that the LRPR will unveil new discoveries.

Fig.1 Layout of the LRPR antennas around the drilling core onboard the CE-5 and CE-6 lander. (a) Side view and (b) bottom view of the antenna array. Antennas #1–#10 are aligned at the bottom of the CE-5 lander, while antennas #11 and #12 are installed separately.

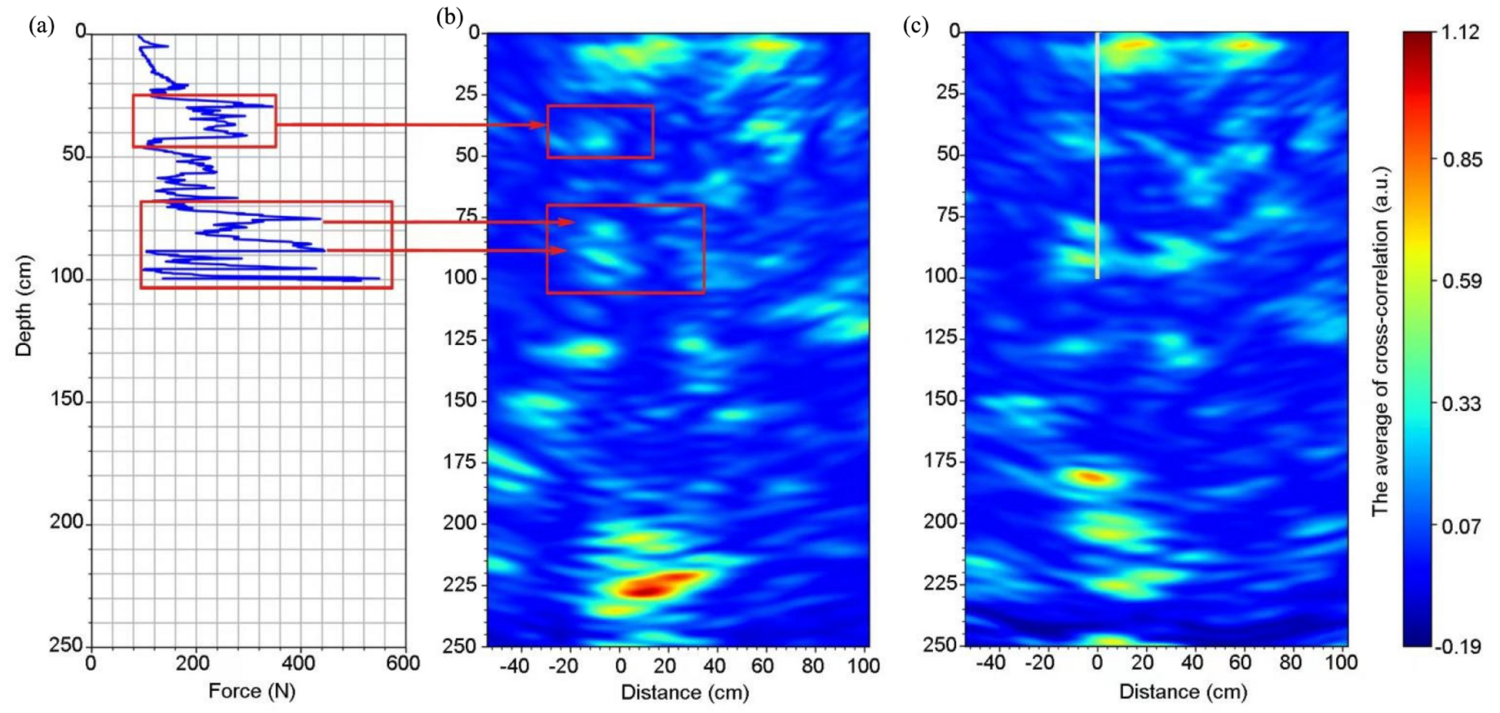
Fig. 2 LRPR observations at the CE-5 drill-sampling site. (a) Variation of the drill bit force along the depths. The horizontal axis is force (N). The drilling system collected the rotation angle of a photoelectric encoder each second; then, this angle was converted to the distance of the drilling core movement to obtain the depth of the bit position. (b) LRPR radar image before drilling. The vertical axis is depth (cm), and zero-depth corresponds to the interface air/soil. The horizontal axis is the distance from the drill bit (cm). The red color represents high reflectivity (large electromagnetic contrast) and blue is low reflectivity (small electromagnetic contrast). (c) Radar image after drilling with the same processing method as that used in (b).

Fig.3 The landing site of CE-5 (a) and the schedule landing site of CE-6 (b). (a) The CE-5 probe landed on the lunar surface at 43.06 N, 51.92 W, a young and flat mare surface at the northeast Oceanus Procellarum. (b) The scheduled CE-6 landing zone is located in the interior of the SPA basin, along the southern rim of the Apollo basin.

References

  • -Y. Fang, B. Zhou, Y.-C. Ji, Q.-Y. Zhang, S.-X. Shen, Y.-X. Li, H.-F. Guan, C.-J. Tang, Y.-Z. Gao, W. Lu, S.-B. Ye, H.-D. Han, J. Zheng, S.-Z. Wang, Lunar penetrating radar onboard the Chang’e-3 mission. Res. Astron. Astrophys. 14, 1607–1622, 2014.
  • Li et al., “The Moon’s farside shallow subsurface structure unveiled by Chang’E-4 Lunar Penetrating Radar,” Sci Adv, vol. 6, no. 9, p. eaay6898, 2020.
  • Li, W. Lu, G. Fang, B. Zhou, and S. Shen, “Performance verification of lunar regolith penetrating array radar of Chang’E-5 mission,” Adv. Space Res., vol. 63, pp. 2267–2278, Apr. 2019.
  • Su et al., Hyperfine Structure of Regolith Unveiled by Chang’E-5 Lunar Regolith Penetrating Radar, IEEE Transactions on Geoscience and Remote Sensing, VOL. 60, 2022


How to cite: Su, Y., Li, C., Liu, J., Zhu, X., Liu, B., Liu, D., and Zhang, Z.: Antenna-Array Radar Applications in Chinese CE-5 and CE-6 Missions, Europlanet Science Congress 2024, Berlin, Germany, 8–13 Sep 2024, EPSC2024-239, https://doi.org/10.5194/epsc2024-239, 2024.

EPSC2024-342
|
On-site presentation
Markus Fränz, Patrick Bambach, Henning Fischer, Norbert Krupp, Elias Roussos, Robert Labudda, Philipp Wittmann, and Stas Barabash

The plasma spectrometer JEI is an ion and electron spectrometer designed to observe the thermal and medium energy charged particle environement  of Jupiter. It is part of the PEP instrument onboard JUICE. The flyby through the Earth-Moon system in August 2024 will be the first test of the instrument in a magnetospheric plasma and under higher radiation. We will report on the instrument performance and on observations of charged particles in the lunar environment and during the crossing of the Earth magnetosphere and radiation belts.

How to cite: Fränz, M., Bambach, P., Fischer, H., Krupp, N., Roussos, E., Labudda, R., Wittmann, P., and Barabash, S.: Observations of the JUICE PEP JEI plasma spectrometer during the Moon and Earth flyby in August 2024, Europlanet Science Congress 2024, Berlin, Germany, 8–13 Sep 2024, EPSC2024-342, https://doi.org/10.5194/epsc2024-342, 2024.

EPSC2024-494
|
On-site presentation
Mohan Liu, Xiao-Xin Zhang, and Liping Fu

The dynamic thermosphere-ionosphere (T-I) system exhibits a significant response to energy inputs from magnetosphere and lower atmosphere, which leads to rapid changes and regional disturbance in the ionosphere. To monitor the T-I system over China in real time, a Multiband Ionospheric Ultra-Violet Spectrum Imager (MUSI), with a launch scheduled for 2025, will be hosted on the Fengyun-4C satellite, which is in geostationary orbit at 133°E longitude and supported by the China Meteorological Administration. MUSI is an imaging spectrometer. It will provide an opportunity to understand spatial and temporal variability of the T-I system over China due to different kinds of energy inputs by measuring the Earth’s far ultraviolet (120-160 nm) airglow with spectral resolution of 0.4 nm. MUSI’s field of regard is 14° East-West and 16° North-South. The observations includes simultaneous monochromatic images of the sunlit and nightside disk each day produced at four ‘colors’, i.e., HI 121.6 nm, OI 130.4 nm, OI 135.6 nm, and 140-160 nm N2 Lyman-Birge Hopfield bands. Further information, such as the O/N2 column density ratios during the day and the ionospheric peak electron density during the night, will also be derived.

How to cite: Liu, M., Zhang, X.-X., and Fu, L.: Multiband Ionospheric Ultra-Violet Spectrum Imager (MUSI) onboard the Fengyun Satellite, Europlanet Science Congress 2024, Berlin, Germany, 8–13 Sep 2024, EPSC2024-494, https://doi.org/10.5194/epsc2024-494, 2024.

EPSC2024-1016
|
ECP
|
On-site presentation
In situ Mass Spectrometer Measurements of Earth’s Upper Atmosphere for Enhanced Atmospheric Modeling
(withdrawn)
Alex Iseli, Rico Fausch, and Peter Wurz
EPSC2024-1165
|
On-site presentation
Michael Gensch, YooKyung Ha, Jonas Woeste, Dominic Azih, Sergey Pavlov, and Nikola Stojanovic

Robotic missions to extraterrestrial objects in our solar system are nowadays often equipped with instruments allowing to explore the geochemistry of the surfaces by e.g. identification of their characteristic vibrational fingerprints. Femtosecond lasers have in recent years been shown to be in principle space qualified, opening up the opportunity to explore the potential of different time-domain techniques as compact, robust alternatives to e.g. Raman spectroscopy or FTIR spectroscopy [1,2]. In this contribution the potential of two time-domain techniques: (i) coherent phonon spectroscopy (CPS) and (ii) THz Time-Domain Spectroscopy (THz-TDS), as emerging in-situ spectroscopic techniques to identify solids by their characteristic  phonon spectra is discussed based on exemplarily measurements of different (planetary) materials. It is shown that: (i) CPS can give access to the raman-active phonon spectra equibvalent to Raman spectroscopy but is not hampered by fluorescence backgrounds and (ii) THz-TDS allows to probe the infrared-active fingerprint of matter while avoiding bulky (cryogenic) spectrally broadband infrared detectors. It is outlined how the bandwidth of the techniques is related to the available laser pulse duration. CPS and THz-TDS measurements with a bandwidth of beyond 1000 cm-1 (30 THz) and a resolution of better than 4 cm-1 (100 GHz) are demonstrated and compared to complementary Raman and FTIR measurements.

[1] J. Lee et al, Testing of a femtosecond pulse laser in outer space. Scientific Reports (2014); 4, 5134.

[2] M. Lezius et al, Space-borne frequency comb metrology. Optica (2016); 3, 1381.

[3] O. Gueckstock et al, Radiation hardness of ultrabroadband spintronic terahertz emitters: en-route to a space-qualified terahertz time-domain gas spectrometer, Applied Physics Letters (2024); 124, 141103.

How to cite: Gensch, M., Ha, Y., Woeste, J., Azih, D., Pavlov, S., and Stojanovic, N.: Time-Domain Spectroscopy: an emerging alternative to Raman and FTIR Spectroscopy in Space Exploration?, Europlanet Science Congress 2024, Berlin, Germany, 8–13 Sep 2024, EPSC2024-1165, https://doi.org/10.5194/epsc2024-1165, 2024.

EPSC2024-1024
|
ECP
|
On-site presentation
Donald Bowden and Hanna Sykulska-Lawrence

The use of Raman spectroscopy in planetary science has seen recent success with the deployment of the SHERLOC [1] and SuperCam [2] instruments on the Mars 2020 mission, and the development of instruments such as the ExoMars Raman Laser Spectrometer [3]. Raman spectroscopy is a useful technique for distinguishing mineral species and has the potential to identify organic chemicals, contributing to the search for extraterrestrial biomarkers. However, the limit of detection for the current set of Raman spectroscopy instruments on planetary missions may prevent the detection of trace concentrations of organic material present in the surface regolith or ice [4].

Fig. 1: Nanofabrication process flow for the creation of quartz nanopillars. 

One method to improve the detection limit of Raman spectroscopy is to employ surface enhanced Raman spectroscopy (SERS). This technique exploits the interaction between incoming laser radiation, the analyte molecule, and hotspot regions associated with nanometer scale gaps in highly conductive materials such as silver and gold [5, 6]. Silver substrates typically provide high SERS enhancement factors [7], but suffer from degradation under storage conditions, with the enhancement factor reducing in a matter of days. Silver chloride provides one possible solution to this issue; silver chloride can be activated using the same laser wavelength as used for Raman spectroscopy (e.g. 532 nm), which creates regions of metallic silver which then contribute to SERS enhancement [8, 9].

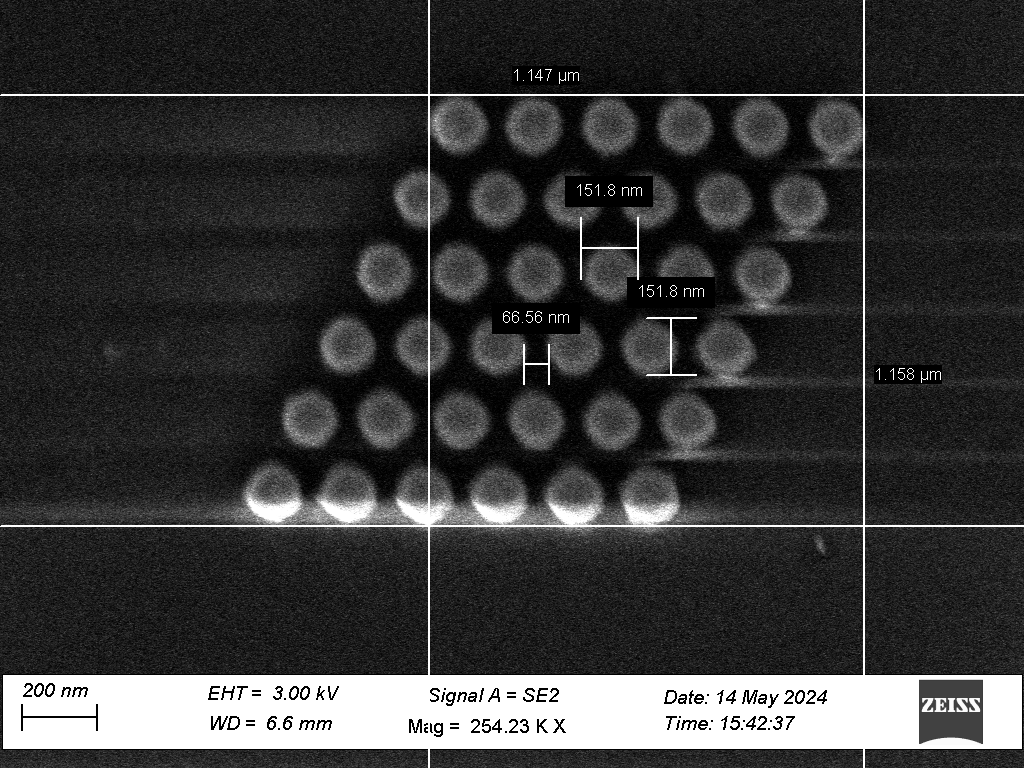
We created geometrically ordered substrates using a nanofabrication process flow (fig. 1). Quartz glass wafers were patterned using electron beam lithography and then etched to provide an ordered pattern of nanopillars with diameter ~150 nm. These pillars were then coated with silver chloride via repeated immersion in solutions of silver nitrate (AgNO3) and sodium chloride (NaCl).

Fig. 2 SEM scan of hexagonally packed nanopillars, with geometric characterisation measurements

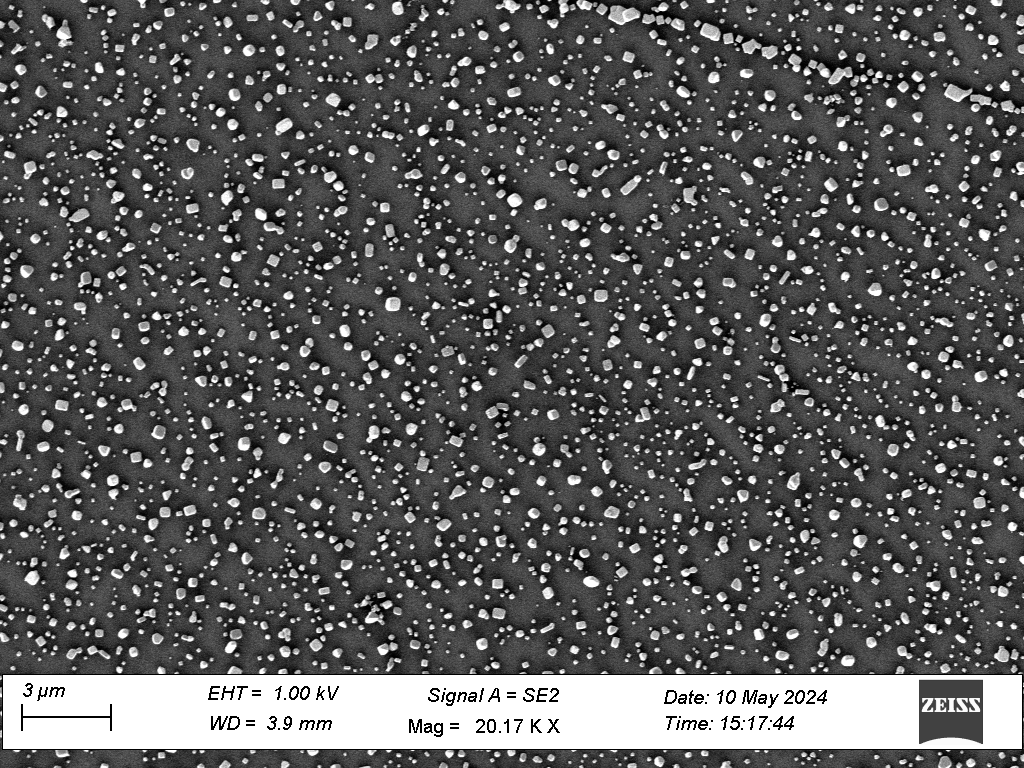
We present characterisation of the production process, using high aspect ratio nanofabrication techniques. Scanning electron microscopy (Fig 2, Fig 3) was used to characterise the geometry of the substrates. In addition, glass microscope slides which had not been altered with nanofabrication techniques were also coated with silver chloride, in order to evaluate the effect of the surface geometry.

Fig. 3 SEM scan of silver chloride crystals on a glass slide

We also present validation and analysis of the SERS enhancement effect from these substrates. Glycine, β-carotene and L-histidine were used as probe biomarker molecules. Raman spectra were taken using a 532nm benchtop spectrometer. Control measurements were performed using the same biomarkers on uncoated glass microscope slides.


[1] Bhartia, R., et al., Perseverance’s Scanning Habitable Environments with Raman and Luminescence for Organics and Chemicals (SHERLOC) Investigation. Space Science Reviews, 2021. 217(4): p. 58.

[2] Maurice, S., et al., The SuperCam instrument suite on the Mars 2020 rover: science objectives and mast-unit description. Space Science Reviews, 2021. 217: p. 1-108.

[3] Rull, F., et al., The Raman laser spectrometer for the ExoMars rover mission to Mars. Astrobiology, 2017. 17(6-7): p. 627-654.

[4] McKay, C.P., et al., The Icebreaker Life Mission to Mars: A Search for Biomolecular Evidence for Life. Astrobiology, 2013. 13(4): p. 334-353.

[5] Le Ru, E.C., et al., Surface Enhanced Raman Scattering Enhancement Factors:  A Comprehensive Study. The Journal of Physical Chemistry C, 2007. 111(37): p. 13794-13803.

[6] Lee, S.J., et al., Surface-enhanced Raman spectroscopy and nanogeometry: The plasmonic origin of SERS. The Journal of Physical Chemistry C, 2007. 111(49): p. 17985-17988.

[7] Sharma, B., et al., SERS: Materials, applications, and the future. Materials Today, 2012. 15(1): p. 16-25.

[8] Volkan, M., D.L. Stokes, and T. Vo-Dinh, A sol–gel derived AgCl photochromic coating on glass for SERS chemical sensor application. Sensors and Actuators B: Chemical, 2005. 106(2): p. 660-667.

[9] Matikainen, A., et al., A solution to the fabrication and tarnishing problems of surface-enhanced Raman spectroscopy (SERS) fiber probes. Scientific Reports, 2015. 5(1): p. 8320.

How to cite: Bowden, D. and Sykulska-Lawrence, H.: Development of Surface Enhanced Raman Spectroscopy Substrates for Detection of Trace Biomarkers, Europlanet Science Congress 2024, Berlin, Germany, 8–13 Sep 2024, EPSC2024-1024, https://doi.org/10.5194/epsc2024-1024, 2024.

EPSC2024-936
|
ECP
|
On-site presentation
Michelle Cedeño, Abel Palomas, Xavier Manyosa, Ana Coloma, Manuel Domínguez-Pumar, and Sandra Bermejo

Purpose

This work presents the development and analysis of a SiO2 composite ionic liquid gel polymer electrolyte (SiO2-CILGPE)-based capacitor in air and carbon dioxide (CO2) atmospheres. The effectiveness of the proposed layer as a humidity-sensitive layer has been demonstrated in [1]. Its use as a humidity sensing layer not only stands out among other alternatives due to its sensing performance, but also because of its cost-effectiveness, scalability, and non-toxicity. In this realm, this study exhibits a brief comparison of the impedance characteristics of the proposed device under air and CO2 conditions, aiming to examine a first insight into the impact of CO2 onits electrical behaviour to evaluate its potential use as a relative humidity sensor for planetary research applications, such the ones carried out in Mars for habitability studies.


Methodology

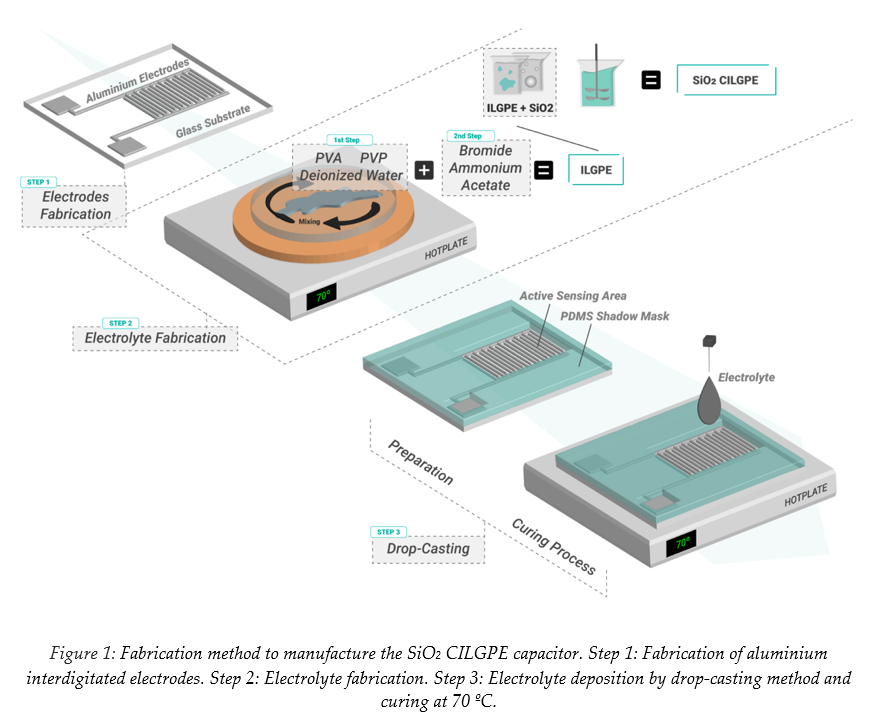
Figure 1 illustrates the fabrication process of the SiO2 CILGPE. The fabrication starts by dissolving the host polymers (HPs) in deionised water at 70 ºC. Then, a blend of CH₃COONH₄ and 1-Butyl-3-methylimidazolium bromide is incorporated and stirred at 70 ºC. Afterwards, SiO₂ nanoparticles are embedded in the resultant ILGPE using an ultrasound bath until a homogenous mixture is achieved. Finally, the resulting electrolyte is deposited onto the active electrode area using drop-casting and subsequently cured, forming a layer with a thickness of around 600 μm and length and width of 0.4 mm and 1mm, respectively.

The humidity sensing performance of the SiO2 CILGPE-based capacitor was evaluated using the electrochemical impedance spectroscopy (EIS) technique under different humidity conditions at atmospheric pressure. The impedimetric response has been obtained using the impedance module values, while the capacitance response has been calculated using Equation 1:


                                                                                C = -𝑍′′/( 2𝜋 𝑓𝑍2)          (Eq. 1)


Where 𝑍 and 𝑍′′ are the module and imaginary part of the impedance, respectively.

Furthermore, EIS measurements under air and CO2 conditions at different pressures have been carried out and compared to evaluate its behaviour under a CO2 atmosphere. This evaluation starts with air evacuation until a partial vacuum, reducing the concentration of air. This first part of the process provides information about the impact of pressure variations on the electrical behaviour of the SiO2 CILGPE-based capacitor under air conditions. Once 0.1 mbar is reached, CO2 is injected in a controlled and gradual manner. This second step stimulates an increase in the internal pressure of the chamber and allows a preliminary analysis of how the quantity of CO2 can impact the impedimetric characteristics of the device. This methodology enables the characterisation of the SiO2-CILGPE-based capacitor under different conditions of pressure and gas composition, thereby providing initial insights into how the presence of different gases affects its performance. The exhibited EIS measurements can be fitted using the equivalent circuit (EC) displayed in Figure 4. The analysis of EIS data from ECs could allow a first insight into the understanding of the impact of CO2 on the sensing mechanism and performance of the SiO2 CILGPE-based capacitor.


Results

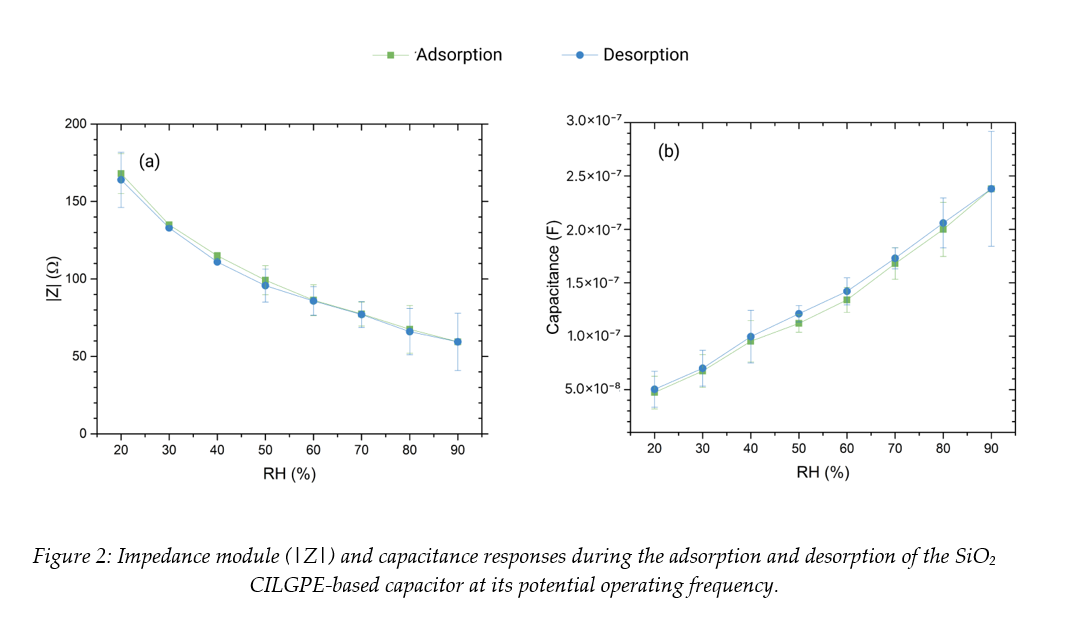
Figure 2 illustrates the obtained Z and capacitance humidity sensing responses. As can be noticed, the SiO2 CILGPE-based capacitor reveals changes in two parameters, increasing its reliability compared to other relative humidity sensors in the literature and offering more information that could facilitate the calibration process.

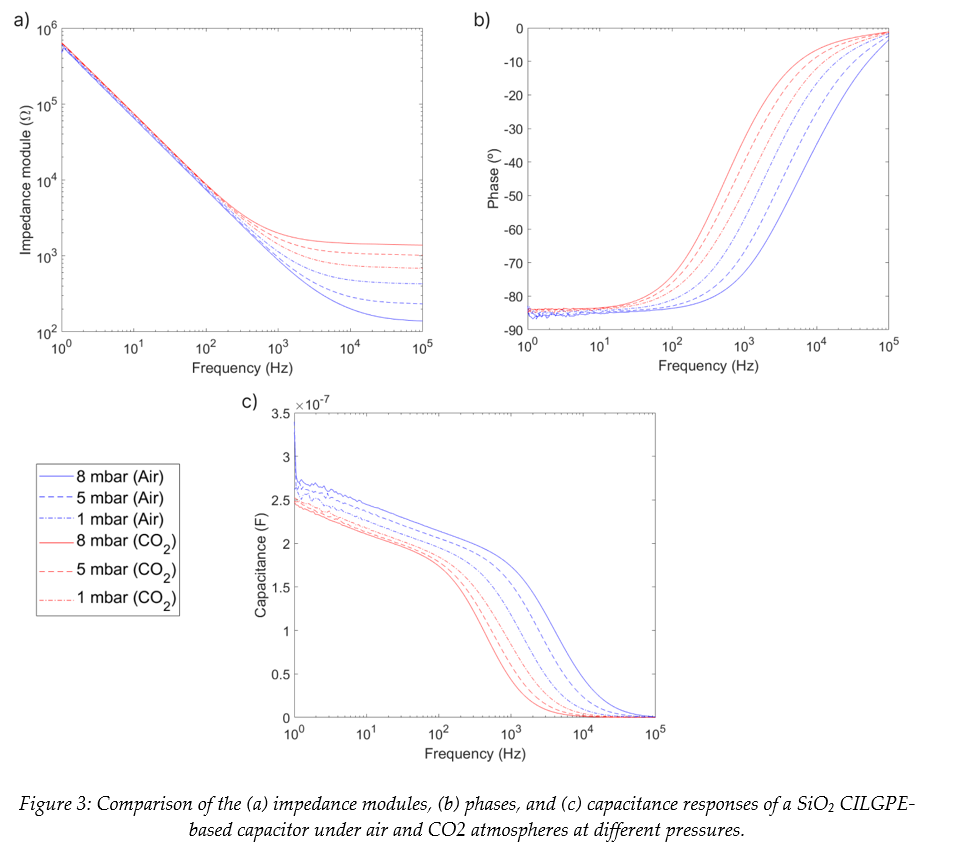
Following the analysis of the EIS data, Figure 3 compares the obtained impedance module, phase, and capacitance spectra under air and CO2 atmospheres. It is noticeable that the curves of the three parameters of the SiO2 CILGPE-based capacitor exhibit the same trend under the presence of both gases, thereby suggesting the SiO2 CILGPE layer could work similarly under air and CO2.

Nevertheless, the characterised parameters reveal opposite shifts in response to pressure variations. Firstly, under an air atmosphere, it can be noticed that a reduction in the pressure implies an increase in the impedance module and a decrease in the capacitance. This behaviour could be ascribed to a reduction of the water vapour molecules since reducing the pressure inside the measurement chamber also implies a reduction in the partial pressure of all gases, including water vapour [2]. Reducing the water molecules promotes a decrease in the number of charge carriers within the humidity-sensitive layer and, hence, an increase in the impedance and a decrease in the capacitance. Conversely, under a CO2 atmosphere, the SiO2 CILGPE-based capacitor depicts an increase in the impedance module values and a reduction in the capacitance when increasing the pressure. This finding might be attributed to the injection of CO2 into the vacuumed chamber. One possible explanation for such phenomena is that introducing CO2 into the chamber increases the pressure, thereby could reduce the water vapour concentration relative to the total gas, promoting a decrease in the relative humidity. Consequently, the obtained impedance spectra suggest that the SiO2 CILGPE-based capacitor could possess the same response to relative humidity variations under the presence of air and CO2. Further research should focus on investigating and analysing the impact of CO2 presence under different relative humidity levels.


Conclusions

EIS measurements show that, under air and CO2 conditions, the SiO2 CILGPE-based capacitor exhibits similar impedance, phase, and capacitance curve trends, thereby suggesting the SiO2 CILGPE layer could operate following similar electrical behaviours under CO2. Additionally, this comparison shows that a reduction in the relative humidity could imply the same response under air and CO2 atmospheres. Therefore, it might suggest that CO2 does not alter the dominant sensing mechanism.

Consequently, this work provides first insights into the possible potential of a non-toxic, cost-effective alternative based on a SiO2 CILGPE as a sensing layer for humidity sensing in CO2 atmospheres.

Acknowledgements

This work has been supported by the projects TED2021-131552B-C22 and PID2021-126719OB-C42.

References

  • [1]  Cedeño Mata, M.; Orpella, A.; Dominguez-Pumar, M.; Bermejo, S. Boosting the Sensitivity and Hysteresis of a Gel Polymer Electrolyte by Embedding SiO2 Nanoparticles and PVP for Humidity Applications. Gels 2024, 10, 50, doi:10.3390/gels10010050.
  • [2] McIntosh, D. H. and A. S. Thom, Essentials of Meteorology, 1978, Wykeham Publications.


How to cite: Cedeño, M., Palomas, A., Manyosa, X., Coloma, A., Domínguez-Pumar, M., and Bermejo, S.: Electrochemical impedance spectroscopy analysis of a SiO2 submicron-particles-based relative humidity sensor for planetary research applications, Europlanet Science Congress 2024, Berlin, Germany, 8–13 Sep 2024, EPSC2024-936, https://doi.org/10.5194/epsc2024-936, 2024.

EPSC2024-130
|
ECP
|
On-site presentation
Lorenzo Biasiotti, Stavro Ivanovski, Lorenzo Calderone, Giovanna Jerse, Monica Laurenza, Dario Del Moro, Francesco Longo, Christina Plainaki, Maria Federica Marcucci, Anna Milillo, Marco Molinaro, and Chiara Feruglio

Introduction:  Kelvin-Helmholtz instability (KHI) is considered one of the main processes of transferring solar wind energy, momentum and plasma inside magnetosphere. At the Earth, KHIs are observable in the form of waves (KHWs) within the magnetopause region between the anti-Sunward magnetosheath and the relatively stagnant magnetosphere. 

Over the past few decades, several missions (THEMIS, Cluster, MMS) have contributed significantly to our understanding of KHI. In this sense, it is well-known that (i) KHIs are a common phenomenon [1,2], (ii) KHIs can be generated under different IMF conditions [2], (iii) KHIs can lead to rolled-up vortices [3], (iv) KHVs drive the onset of magnetic reconnection (Vortex-Induced Reconnection) leading to development of Tearing Mode instability [4] and formation of magnetic islands, evolving into flux ropes [5], and (v) in the late nonlinear phase, vortex merging and secondary KHIs development in a wider latitudinal range [6]. In addition, [7] found that KHWs occur at the (flank) magnetopause for approximately 19% of that time. The occurrence of these waves is influenced by factors such as solar wind speed, Alfven Mach number and number density, and is mostly independent on the IMF magnitude. These conditions can be easily met when a perturbation propagates within the interplanetary medium, such as during the occurrence of a coronal mass ejection. 


Investigating the conditions under which KH and TM instabilities occur in the Earth environment, using simultaneous multipoint in-situ measurements and MHD simulations, is intriguing because it could provide insights into the flow dynamic nature at the magnetopause mixing layer. In this sense, we analyzed data from THEMIS and Cluster spacecraft considering two "target" Space Weather events occurred on 21 June 2015 (Case-1) and on 6 September 2017 (Case-2).


The Model: Our analysis utilized a 2D MHD model [8] which describes the flow dynamics of the magnetopause mixing layer in a fluid limit.  The simulation domain consists of a rectangular region in (x,y)-plane. On the local Cartesian grid, it is defined as follows: (i) neglecting the realistic curvature; (ii) considering the x-coordinate pointing to the direction along the velocity of the incident magnetosheath flow; (iii) assuming the y-coordinate in the direction downward to the Earth’s center (from the magnetosheath to the magnetosphere) and (iv) ensuring a right-handed coordinate system with the z-coordinate.

The used approach is flexible enough to represent any position on the dayside magnetopause.


Results: In Case-1, we used our MHD model to interpret observational data and to investigate the potential development of KHVs on the dawn flank magnetopause as a consequence of the arrival of the ICME. Using THEMIS-E data, we found that at the magnetopause nose no rolled-up KHVs developed due to the absence of a shear between the two fluids. On the contrary, structures similar to magnetic islands appeared in By component very fast and vanished for 10 computational seconds. At the dawn flank magnetopause, the analysis of Cluster data revealed high flow and low magnetic shear between the magnetosheath and the magnetosphere. According to theoretical predictions, these conditions favour the onset of KHI. MHD simulations confirmed these considerations, finding that KHVs developed very rapidly and persisted up to 20 computational seconds (Figure 1), reaching almost MHD instability steady state. Regarding the TM instability, the MHD simulations revealed only an early development of magnetic islands (Figure 2), that persisted for half of the time of the KHVs evolution. In a global scale, these results indicate that vortices become unstable far away from the subsolar point in the direction of high flow shear. Case 1. Evolution of KH instabilities in density at the dawnward flank of the magnetopause, from 1 to 30 seconds. Input data obtained from the Cluster-C4 measurements. The dimensionless boundary conditions from the magnetosphere side and magnetosheath side are taken everywhere to be identical: BM SP x =-1.24, BM SH x =1.0, BM SP y =0.4, BM SH y =1, ρM SP =0.2, ρM SH =1, Re = 250 and Rm = 1 000, MA = 0.2. Blue region represents the magnetosphere whilst red region represents the magnetosheath.
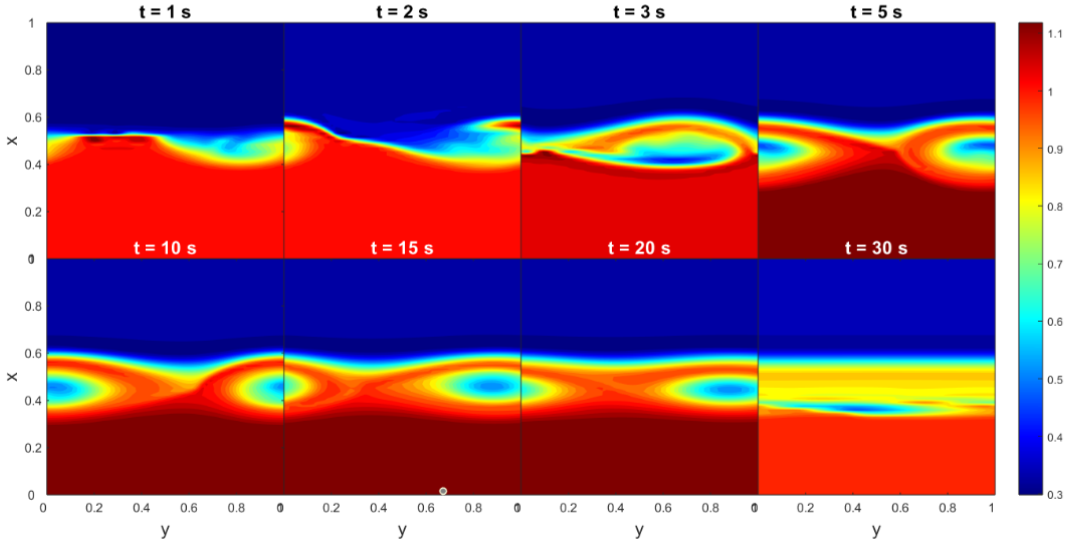
Figure 1. Case 1. Evolution of KH instabilities in density at the dawnward flank of the magnetopause, from 1 to 30 seconds. Input data obtained from the Cluster-C4 measurements. The dimensionless boundary conditions from the magnetosphere side and magnetosheath side are taken everywhere to be identical: BMSPx=-1.24, BMSHx=1.0, BMSPy=0.4, BMSHy=1, ρMSP =0.2, ρMSH=1, Re= 250 and Rm= 1 000, MA= 0.2. Blue region represents the magnetosphere whilst red region represents the magnetosheath.
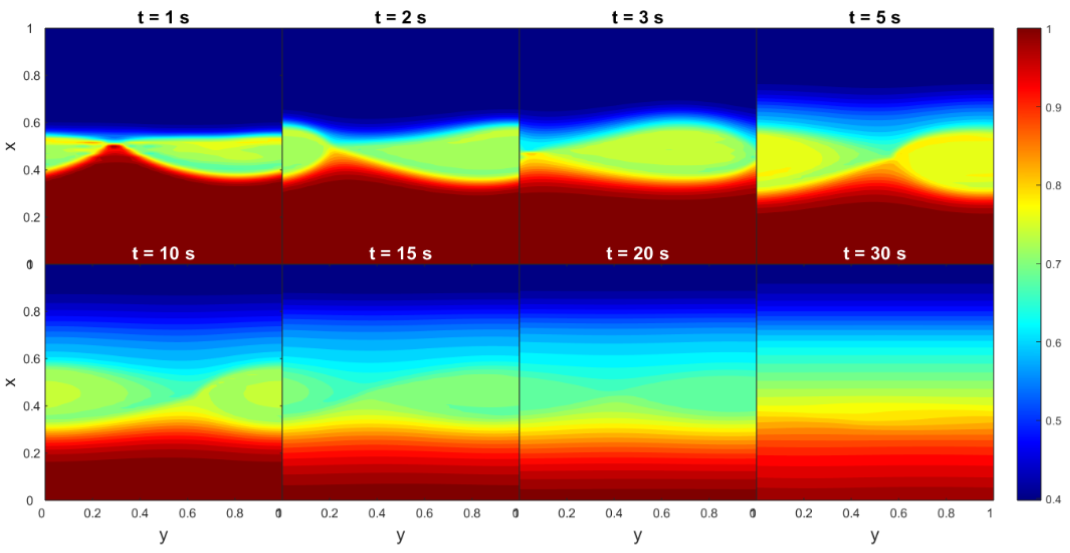
 

Figure 2. Case 1.  Evolution of TM instabilities in By at the dawnward flank of the magnetopause. Same of Figure 1.


In Case-2, using THEMIS-E data, we did not find any evidence of KHI owing to the extremely low flow and high magnetic shear. On the contrary, adopting Cluster-C4 data, MHD simulations revealed that the fast development of disturbances but no signatures of KHVs were visible. Additionally, magnetic islands appeared very fast as a result of high shear in the components of the magnetic field but rapidly vanished.


References

[1] Hasegawa, H., et al. (2004). Nature, 430, 755–758.

[2] Hasegawa, H., et al. (2006). JGR, 111, A09203.

[3] Lin, D., et al. (2014). JGR, 119, 7485–7494.

[4] Chen, Q., et al. (1997). JGR, 102, 151–162

[5] Eriksson, S., et al. (2009). JGR, 114, A00C17.

[6] Sisti, M., et al. (2019). Geophysical Research Letters 46, 11,597–11,605

[7] Kavosi, S. and Raeder, J. (2015). Nature Communications, 6, 7019.

[8] Ivanovski, S., et al. (2011). Journal of Theoretical and Applied Mechanics, 41, 31–42
How to cite: Biasiotti, L., Ivanovski, S., Calderone, L., Jerse, G., Laurenza, M., Del Moro, D., Longo, F., Plainaki, C., Marcucci, M. F., Milillo, A., Molinaro, M., and Feruglio, C.: Kelvin-Helmholtz and tearing mode instabilities at the magnetopause during space weather events, Europlanet Science Congress 2024, Berlin, Germany, 8–13 Sep 2024, EPSC2024-130, https://doi.org/10.5194/epsc2024-130, 2024.

EPSC2024-783
|
ECP
|
On-site presentation
Taifeng Jin, Binbin Ni, Song Fu, Lei Li, Xing Cao, Shuyue Pang, Xiaotong Yun, Minyi Long, and Hengle Du

Whistler-mode and ULF waves upstream of planetary bow shock play important role in energy transfer and dissipation processes in the planetary environment. A series of whistler-mode waves with their frequencies centered at ~0.4 Hz, accompanied by another series of ~0.04 Hz ULF waves, were observed upstream of the Martian bow shock by MAVEN on 2015 August 14. During the occurrence of waves, a significant flux enhancement of high-energy protons up to ∼10 keV, as well as the response of electrons to the ULF waves, were also observed. The pitch angle distributions of electrons were modulated differently according to electrons’ energies. Preliminary dispersion analysis suggests that the solar wind condition was capable of generating ULF waves by ion-ion instabilities, while the observed whistler-mode waves have the potential of resonating with protons of ∼1 keV with large pitch angles up to nearly perpendicular to the background magnetic field. Our results indicate the possible connection between co-existence of waves and the origin of energized protons through wave-particle interactions in the Martian environment.

How to cite: Jin, T., Ni, B., Fu, S., Li, L., Cao, X., Pang, S., Yun, X., Long, M., and Du, H.: Whistler-mode and ULF waves and their association with solar wind plasmas observed upstream of Martian bow shock, Europlanet Science Congress 2024, Berlin, Germany, 8–13 Sep 2024, EPSC2024-783, https://doi.org/10.5194/epsc2024-783, 2024.

EPSC2024-683
|
On-site presentation
Kun Li

The polar wind, consisting of ions and electrons with low temperature and low energy, is known as a main contributor to the ionospheric outflow. These ions in the polar wind are so-called cold ions, which are notoriously difficult to measure with a spectrometer onboard the spacecraft because of the spacecraft charging problem. Recently, a technique measuring the electric field in the plasma wake has been used to derive the bulk velocity of the cold ion flow. However, this technique is not able to derive the cold ion temperature, which is thought to change as ions travel in the magnetotail. In this study, we use the electric field measurements from the Cluster spacecraft. We focus on the correlation between the ion temperature and the width of the plasma wake. Our results are used to derive the cold ion temperature, which helps us to understand more about the dynamics of cold ion outflow.

How to cite: Li, K.: A new technique to derive the temperature of the cold ions in the magnetosphere, Europlanet Science Congress 2024, Berlin, Germany, 8–13 Sep 2024, EPSC2024-683, https://doi.org/10.5194/epsc2024-683, 2024.

EPSC2024-392
|
ECP
|
On-site presentation
Iina Jaakonaho, Maria Hieta, Maria Genzer, Jouni Polkko, Thomas Thiele, and Ari-Matti Harri

1 Introduction

The upcoming Dragonfly rotorcraft mission by NASA is planned to be sent to the surface of Saturn’s moon Titan [1]. As part of the Dragonfly Entry Aerosciences Measurements (DrEAM) suite [2], the Dragonfly entry capsule will include a subsystem called COmbined Sensor System for Titan Atmosphere (COSSTA), developed by the Supersonic and Hypersonic Technologies Department of the DLR Institute of Aerodynamics and Flow Technology in cooperation with NASA (T. Thiele, private communication, 2023). One of the sensors of COSSTA is a pressure sensor developed by the Finnish Meteorological Institute (FMI). The sensor, named COSSTA-PL, is dedicated to measuring the static pressure on the entry capsule backshell.

The design of COSSTA-PL relies heavily on the heritage of FMI’s pressure sensors previously developed for Mars landers, such as the Curiosity rover of Mars Science Laboratory (MSL) and the Perseverance rover of Mars 2020. The optimal measurement range of COSSTA-PL is close to the typical surface pressure of Mars, namely up to about 10 hPa, with a capability to measure pressures up to 20 hPa.

2 Sensor description

COSSTA-PL is a miniature pressure device directly based on MEDA PS [3], the pressure sensor of the Perseverance rover. At its core are the Barocap® sensor head and transducer technologies developed by Vaisala. Barocap is a micromachined silicon pressure sensor based on capacitive sensing. COSSTA-PL contains two Barocap types, NGM and RSP2M, which are both optimized for the low-pressure range.

COSSTA-PL consists of two transducers, each working independently of the other. Transducer 1 contains two NGM type Barocap sensor heads while transducer 2 has two RSP2M type Barocaps. Both transducers also include two Thermocap temperature sensor heads and constant reference capacitors for data processing purposes. The main distinction from MEDA PS is that COSSTA-PL includes two PT1000 temperature sensors directly attached to the NGM Barocap sensor heads. As the Barocap readings are sensitive to temperature, the purpose of the PT1000 sensors is to provide the accurate temperature readings of the sensor heads.

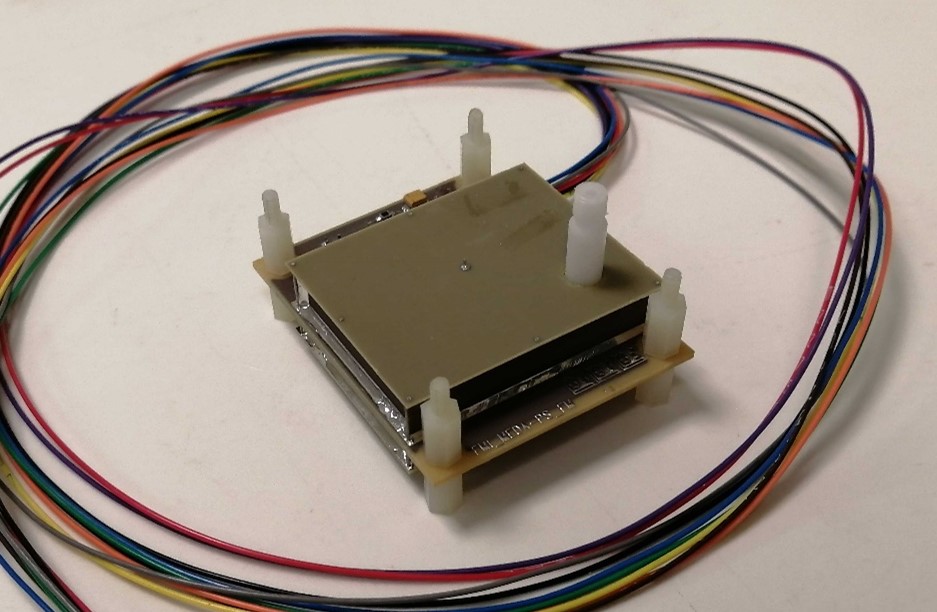
The Barocap sensor heads and transducer electronics are enclosed by airtight Faraday shields made of PCB material (see Fig. 1). A small tube exits the shield, connecting the sensors with the surrounding pressure. The dimensions are 62×50×17 mm without the tube.

Prototype model of COSSTA-PL

Figure 1. Prorotype model of COSSTA-PL

3 Testing and calibration

As the sensor may be exposed to extremely cold environment during the long cruise, initial testing of a prototype model was performed at DLR in Cologne to investigate how the sensor endures temperatures down to -150 °C. These were followed by further testing at FMI, focusing on verifying the operation of the ASIC in extremely low temperatures.

Calibration is planned to be performed mainly at FMI in the 0 to 20 hPa pressure range and -70 °C to +55 °C temperature range. Calibration down to -150 °C (TBC) is continued at the COSSTA level. The calibration will include measurements in both stable and changing pressure, as well as in changing temperature. Calibration checks at the higher level after integration and during the cruise phase are also planned.

References

[1] Lorenz, R. D. et al. (2018). Dragonfly: A Rotorcraft Lander Concept for Scientific Exploration at Titan, Johns Hopkins APL Technical Digest 34(3), pp. 374-387.

[2] Brandis, A. et al. (2022). Summary of Dragonfly’s Aerothermal Design and DrEAM Instrumentation Suite, 9th International Workshop on Radiation of High Temperature Gases for Space Missions, 12 – 16 Sep 2022, Santa Maria, Azores, Portugal.

[3] Jaakonaho, I. et al. (2023). Pressure sensor for the Mars 2020 Perseverance rover, Planetary and Space Science 239, 105815, https://doi.org/10.1016/j.pss.2023.105815.

How to cite: Jaakonaho, I., Hieta, M., Genzer, M., Polkko, J., Thiele, T., and Harri, A.-M.: Low-pressure sensor for Titan entry investigations of the Dragonfly mission, Europlanet Science Congress 2024, Berlin, Germany, 8–13 Sep 2024, EPSC2024-392, https://doi.org/10.5194/epsc2024-392, 2024.

EPSC2024-407
|
ECP
|
On-site presentation
Alice Amsili, Naomi Murdoch, and Damien Vivet

The Japanese Mars Moon eXploration (MMX) mission will explore the two Moons of Mars: Phobos and Deimos [1]. The Japanese probe will first orbit Phobos before landing in order to conduct a sample collection before proceeding to orbit Deimos and then return to Earth. The Centre National d’Etudes Spatiales (CNES) and the Deutsches zentrum für Luft- und Raumfarht (DLR) have jointly developed a small rover called IDEFIX (Fig 1) that will leave the Earth in 2026 with the Japanese MMX mission. It will be deployed onto the surface of Phobos to conduct preliminary ground analyses, ensuring a safer landing for the main MMX spacecraft [2]. The IDEFIX rover has two cameras near the wheels called WheelCams [3], which are directed at the ground. Thanks to these, IDEFIX will be able to capture close-up images of the ground, providing information regarding the size, distribution and morphology of regolith particles [4]. By studying the interactions between the regolith and the rover wheels, other important information can be obtained such as the frictional and cohesive properties of the ground.

Figure 1: The IDEFIX rover. The positions of the two WheelCams are indicated (image: CNES)

The work presented here focuses on using the WheelCam images to measure the local topography of the ground underneath the rover, specifically the shape of the trench left by the rover’s wheels after rolling. The images are generated using the MMX rover-wheel test bed at ISAE-SUPAERO that is instrumented with cameras similar to the MMX rover WheelCams [5]. An algorithm based on a Structure from Motion (SFM) method was developed to reconstruct the shape of the trench. Due to the non-overlapping field of views of the two WheelCams [3], only one camera is used. Consecutives images captured by one single camera while the rover is in motion enable the creation of a 3D model including the ground, the objects passing nearby the rover and the trench left by the wheel.

Below (Fig.2), an example of a 3D model generated by the SFM algorithm is presented. In this example, the wheel is driving on sand and the bumps left by the wheels are clearly visible both in the images and in the reconstruction. The reference point is set to be the position of the first camera.

Figure 2: 3D model of the trench left by the wheel rolling on sand

In order to validate the SFM algorithm and the 3D model obtained, objects with a known shape and size have also been placed in the field of view and modeled by the algorithm. These tests also allow us to evaluate the performance of the SFM algorithm under different conditions (varying wheel velocities, lighting conditions, regolith types....). In addition to verifying the correct retrieval of the objects’ size and shape, a second method of validation was also applied. The SFM method gives an estimation of the position of the camera at each frame, which can be seen in red in the point cloud Figure 3. The ISAE-SUPAERO rover-wheel testbed has laser distance sensors that give the precise position of the camera when each picture is taken. Thus, the laser measurements can be used as ground truth data and compared to the estimated position of the camera from the model. This comparison is shown in Figure 4.

Figure 3: (left) WheelCams Perspectives. An object with a known size and shape is covered by a speckle and placed on a flat speckled surface. (right) 3D point cloud of the scene with the successive camera positions (red)

Figure 4: Comparison of the linear velocity estimated from the SFM algorithm (red) to the laser distance sensor ground truth measurement (black dashed)

This work demonstrates that it is possible to reconstruct the shape of the ground, and more specifically the morphology of the trench left by the wheel, using the IDEFIX WheelCam images. This will allow us to make measurements of the track depth, and thus the rover sinkage in addition to providing measurements of the angle of repose if the trench walls collapse. Moreover, an estimation of the consecutive camera positions can be obtained, which enables the linear velocity of the rover to be computed. This information will be valuable to help estimate the slippage of the wheels on Phobos and thus assess the performance of the rover’s locomotion.

Acknowledgements

This work has received funding from CNES, in the context of the MMX rover mission.

References

[1] Kuramoto, K., Kawakatsu, Y., Fujimoto, M., Araya, A., Barucci, M. A., Genda, H., ... & Yokota, S. (2022). Martian moons exploration MMX: sample return mission to Phobos elucidating formation processes of habitable planets. Earth, Planets and Space, 74(1), 12.

[2] MICHEL, Patrick, ULAMEC, Stephan, BÖTTGER, Ute, et al. The MMX rover: performing in situ surface investigations on Phobos. earth, planets and space, 2022, vol. 74, p. 1-14.

[3] Murdoch et al. The science goals of the IDEFIX rover WheelCams, EPSC 2024

[4] Robin C. Q., Duchêne A., Murdoch N., et al. Mechanical properties of rubble pile asteroids: insights from a morphological analysis of surface boulders. Nature Communications, accepted (2024)

[5] Passoni, L., et al. "A Single-Wheel Testbed for Regolith Science Studies." Lunar and Planetary Science Conference. No. 2548. 2021.

How to cite: Amsili, A., Murdoch, N., and Vivet, D.: 3D reconstruction of MMX rover tracks using WheelCam images, Europlanet Science Congress 2024, Berlin, Germany, 8–13 Sep 2024, EPSC2024-407, https://doi.org/10.5194/epsc2024-407, 2024.

EPSC2024-876
|
ECP
|
On-site presentation
Michaela Maleckova, Ján Žabka, Yllia Zymak, Miroslav Polášek, Barnabé Cherville, Juraj Jašík, Anatolii Spesyvyi, Michal Lacko, Marwa Kashkoul, Arnaud Sanderink, Markéta Nezvedová, Nikola Sixtová, Aleš Charvát, and Bernd Abel

Mass spectrometry plays an important role in advancing space exploration. It provides unique insights into the composition of space dust, micrometeorites, and particles from distant large objects and can be used both in orbit and on the surface of an asteroid.

The space instrument HANKA (Hmotnostní ANalyzér pro Kosmické Aplikace) is a high-resolution mass spectrometer based on an electrostatic ion trap, which is a principal component of commercial instruments[1] established in biology and medicine research, the so-called Orbitrap™, and the space CosmOrbitrap prototype (developed in LPC2E Orleans[2]). HANKA can take this new technology into space, combining a compact CubeSat space version of this high-resolution ion trap mass analyzer with a velocity/charge detector and hypervelocity impact ionization source.

Figure 1:  HANKA – CubeSat space version (a), laboratory prototype (b), and preliminary data from EI source(c)[3]

Based on the results obtained from the laboratory prototype, a miniature CubeSat version of the high-resolution mass spectrometer for in-situ exploration in space will be constructed. The proposed parameters of the CubeSat module HANKA are:

> Resolution: up to 50 000 at m/z 200         

> Mass Range: 2 – 3000 m/z 

> Dimension: 200x200x100 mm (4U)

> Weight: < 6kg

> Power:  5-10 W

Acknowledgements: This work was supported by the Czech Science Foundation (grant No. 21-11931J)

References

[1] Makarov, A.; Anal. Chem. 2000, 72, 1156–1162.

[2] Briois C., Thissen R., Thirkell L., et al.; Planet Space Sci. 2016, 131, 33‐45.

[3] Zymak Y., Zabka J., Polášek M., et al.; al.; Aerospace 2023, 10(6), 522.

How to cite: Maleckova, M., Žabka, J., Zymak, Y., Polášek, M., Cherville, B., Jašík, J., Spesyvyi, A., Lacko, M., Kashkoul, M., Sanderink, A., Nezvedová, M., Sixtová, N., Charvát, A., and Abel, B.: HANKA> CubeSat Space Dust Analyser, Europlanet Science Congress 2024, Berlin, Germany, 8–13 Sep 2024, EPSC2024-876, https://doi.org/10.5194/epsc2024-876, 2024.