
Thermal Modelling of Mercury with Roughness and Topography: Comparison with Mariner 10 IRR and Predictions for BepiColombo MERTIS
 1,
1,- 1Johns Hopkins University Applied Physics Laboratory, Space Exploration Sector, United States of America (tyler.powell@jhuapl.edu)
- 2University of California, Los Angeles, Dept. of Earth, Planetary, and Space Sciences, United States of America
Abstract: The Mercury Radiometer and Infrared Spectrometer (MERTIS) on board the BepiColombo mission [1,2] will map Mercury’s thermal emission at high resolution. In preparation for its arrival at Mercury, we develop a thermal model that accounts for topographic scattering and emission, as well as the effect of surface roughness on non-nadir viewing. We calibrate our model using brightness temperature data collected by the Mariner 10 Infrared Radiometer (IRR) [3]. In addition, we highlight interesting surface temperature phenomena predicted by our model which we expect to observe in future MERTIS data.
1. Thermal model: We produce an 8 pixel-per-degree global map of modeled surface temperatures (figure 1A). Because of Mercury’s highly eccentric orbit and 3:2 spin-orbit resonance [4], the solar flux at perihelion is more than a factor of 2 greater than at aphelion, and the sub-solar longitude at perihelion always occurs at 0˚ or 180˚. This causes the total amount and timing of solar insolation to vary significantly with both longitude and latitude. We determine direct solar illumination for each pixel using an ephemeris [5] and account for slope effects using the MESSENGER Global DEM [6]. In addition, each facet receives indirect illumination scattered and emitted from the surrounding terrain following the approach of [7].
The surface and subsurface temperatures for each pixel are determined using a 1-dimensional thermal model based on [8], which treates the vertical structure of the regolith as an exponential increase in density with depth: ρ=ρd-(ρd-ρs)e-z/H where H is a scale-height describing the thickness of the loosely-packed surface layer. Most of the thermophysical properties we use are described in [8]. However, we implement an updated temperature-dependent thermal conductivity [9].
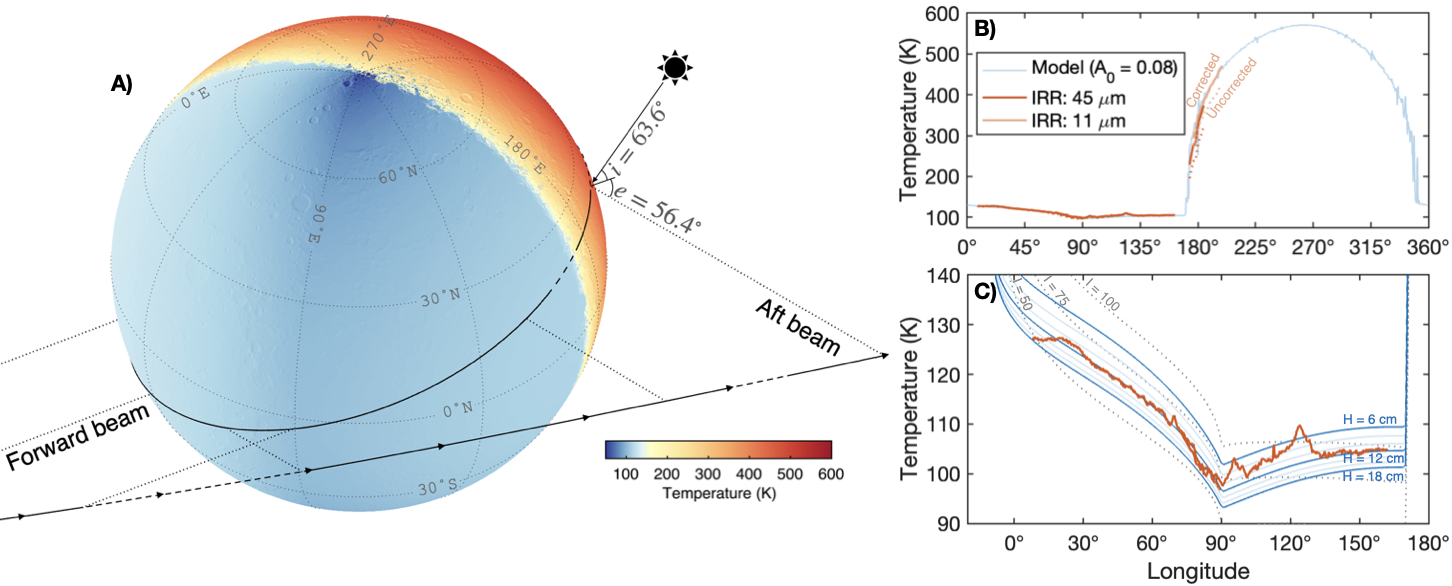
Figure 1. A) Geometry of Mariner 10’s 29/3/1974 flyby. B) Comparison between Mariner 10 IRR and modeled temperatures. C) Close-up of nighttime temperatures using varying thermophysical properties.
2. Mariner 10 IRR Data: The Mariner 10 mission was equipped with an Infrared Radiometer (IRR) with two spectral channels (11 and 45 μm) [3]. The forward- and aft- viewing geometry during the 29/3/1974 Mercury flyby led to observations at high emission angle. Airless bodies have rough surfaces which do not emit uniformly in all directions. Additionally, sub-pixel temperature variations cause the measured brightness temperature to shift with wavelength. To account for these effects, we use a roughness model that treats the surface as a series of bowl-shaped craters, which has been shown to match the directional emission behavior of the Moon seen in LRO Diviner data [10]. For each Mariner 10 IRR data record, we convert the measured brightness temperature to an equivalent surface kinetic temperature given the detector emission angle, solar incidence and phase angle, and channel wavelength (figure 1B). This significantly improves the agreement between the daytime data collected by the 11 and 45 μm channels. The results are consistent with an albedo of 0.08. However, we note that the magnitude of thermal-scale roughness may be different between the Moon and Mercury, so future MERTIS data will be valuable to further tune this model.
3. Results: Figure 1C shows a comparison between the Mariner 10 IRR nighttime temperatures and thermal modeling. As has been previously noted [3,11,12], a model using vertically homogeneous and constant thermal inertia does not accurately reproduce the shape of the observed nighttime cooling. Vertical layering and temperature-dependent thermophysical properties provides a significantly closer match. The best-fit model has an H of ~12 cm, some-what higher than the typical value for the Moon (~6 cm). This may represent a real difference in thermophysical properties between the two bodies. However, it may also be the result of uncertainties in thermophysical properties at the extreme temperatures of Mercury. The lunar-like thermal conductivity function that we use [9] is only valid up to ~400 K, and we use extrapolation to extend these results to the higher temperatures. The best-fit value of H is sensitive to this extrapolation. However, in general, the values of H shown in figure 1C are in reasonable agreement with the values typical for the Moon. Future observations by MERTIS will help to further constrain these thermophysical properties.
An interesting feature of the Mariner 10 nighttime temperature transect is that temperatures begin increasing east of 90˚ longitude, despite this region being later in the night. This increase is a remnant of the total solar insolation received during Mercury’s perihelion, where regions which received more solar heating remain warmer at night. A similar behavior can be observed at a smaller scale on some local slopes. Figure 2 shows modeled nighttime temperatures for a crater throughout the night. Early in the night, the temperatures reflect the solar illumination just before sunset, with warmer west-facing slopes. However, late-night temperatures tend towards reflecting the total heating received throughout the entire day, which is dominated by the slope orientation during perihelion. For locations which were westward of the sub-solar point at perihelion, this causes the temperature of opposing slopes to invert relative to each other.
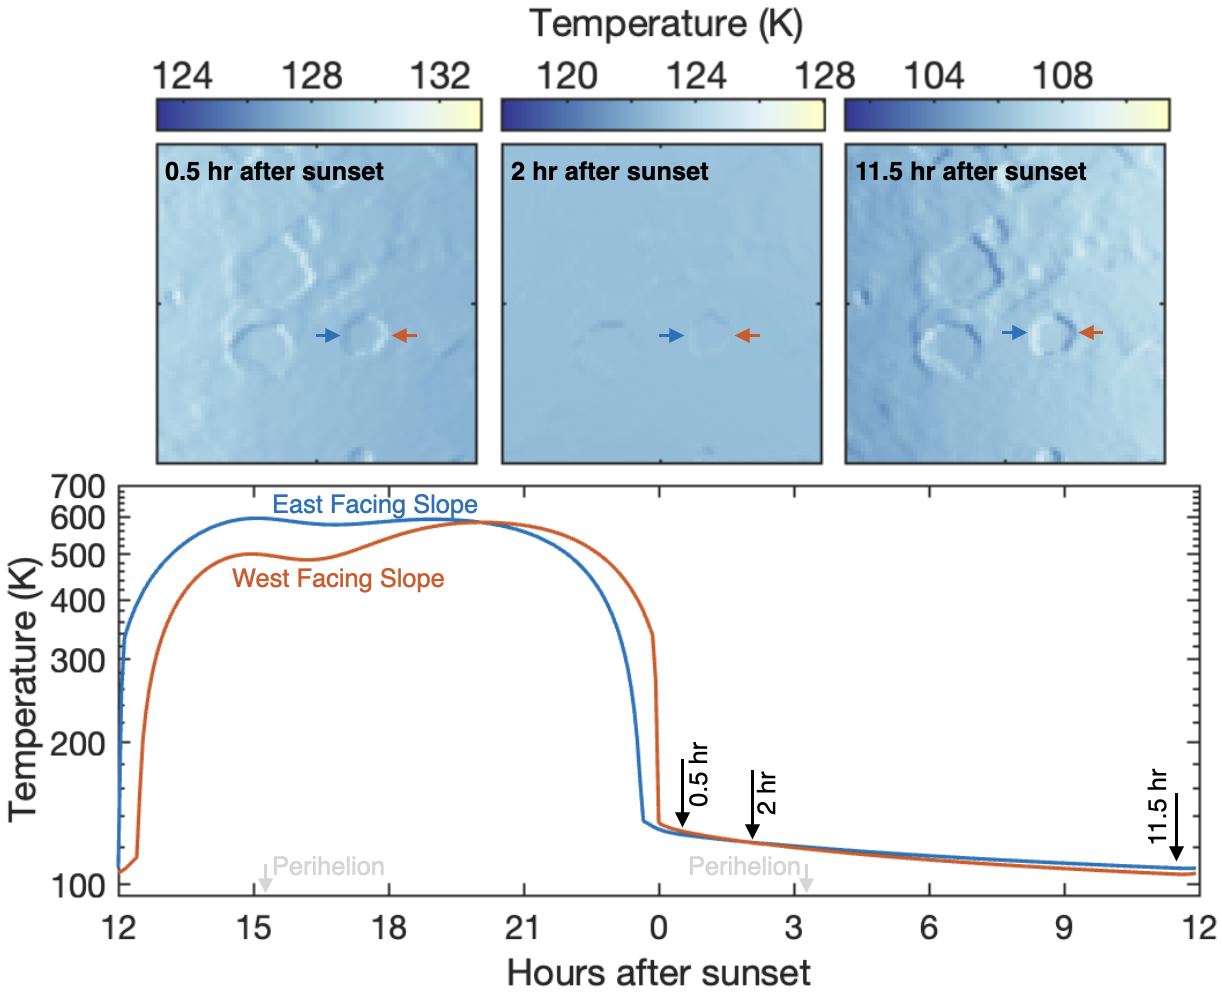
Figure 2. Modeled temperature for a cratered region throughout the night (110 to 120˚E, -10 to 0˚S).
4. Conclusions: We develop a thermal model for Mercury which accounts for topographic and roughness effects. Our results agree well with Mariner 10 IRR surface temperature data. The dramatic variability in the magnitude and timing of illumination across the surface of Mercury presents a unique opportunity to constrain regolith thermophysical properties by observing their response to a range of illumination conditions.
References: [1] Benkhoff et al. (2010) PSS, 58, 2-20. [2] Hiesinger et al. (2010) PSS, 58, 144-165. [3] Chase et al. (1976) Icarus, 28, 565-578. [4] Morrison (1970) Space Sci. Rev., 11, 271-307. [5] Giorgini et al. (1996) Bull. Am. Astron. Soc., 28, 1158. [6] Becker et al. (2016) LPSC, 47, 1903. [7] Powell et al. (2023) JGRP, 128, e2022JE007532. [8] Hayne et al. (2017) JGRP, 122, 2371-2400. [9] Martinez and Siegler (2021) JGRP, 126, e2021JE006829. [10] Jhoti et al. (2023) LPSC, 54, 2806. [11] Bandfield et al. (2019) LPSC, 54, 2780. [12] Bauch et al. (2021) Icarus, 354,114083.
How to cite: Powell, T., Greenhagen, B., and Jhoti, E.: Thermal Modelling of Mercury with Roughness and Topography: Comparison with Mariner 10 IRR and Predictions for BepiColombo MERTIS, Europlanet Science Congress 2024, Berlin, Germany, 8–13 Sep 2024, EPSC2024-572, https://doi.org/10.5194/epsc2024-572, 2024.