- 1German Aerospace Center (DLR), Institute of Planetary Research, Berlin, Germany (gaku.nishiyama@dlr.de)
- 2Department of Earth and Planetary Science, Graduate School of Science, The University of Tokyo, Bunkyo-ku, Tokyo, Japan
- 3National Astronomical Observatory of Japan, Mitaka, Tokyo, Japan
- 4Institute of Space and Astronautical Science (ISAS), Japan Aerospace Exploration Agency (JAXA), Sagamihara, Kanagawa, Japan
- 5RIKEN Center for Advanced Photonics, Wako, Saitama, Japan
- 6Graduate School of Frontier Sciences, The University of Tokyo, Kashiwa, Chiba, Japan
- 7Max-Planck-Institut für extraterrestrische Physik, Garching, Germany
Recently, the Japanese meteorological satellites Himawari-8 and -9 began to be utilized as a space telescope for planetary science and astronomy. Since its operation started in 2015, Himawari-8 has been taking full-disk images of the Earth at the geostationary orbit every 10 minutes [e.g., 1]. Although Himawari-8 aims to observe the weather in the Asia-Pacific region frequently, its scanning pattern extends to space adjacent to the Earth, where solar-system bodies and stars are captured occasionally. For example, stars at absolute declination below 8.8 degrees can be captured, enabling an observation of the great dimming of the red supergiant star Betelgeuse [2]. In addition, Himawari-8 has taken the Moon more than a thousand times. Because the Himawari-8 can spatially resolve the lunar surface and has 9 bands at the infrared wavelengths, lunar surface geology such as roughness and rock abundance can be inferred from the Himawari-8 infrared images [3]. In principle, these spaceborne observations can extend to other solar system bodies, namely Mercury, Venus, Mars, and Jupiter. In particular, the Venus observation with the Himawari-8/9 infrared cameras could provide valuable data to trace the temporal variation of the cloud-top temperature. At the infrared wavelengths covered by the Himawari-8 and -9, the spaceborne observation of Venus is limited only to the Venera-15 and BepiColombo missions [e.g., 4, 5]. Nevertheless, the Himawari-8 and -9 data have not been utilized to observe these solar-system bodies until the present.
In this study, we archived all the Venus images captured by Himawari-8 and -9. To extract all the Venus images, we used the Himawari Standard Data (HSD) published by the Japanese Meteorological Agency from July 2015 until April 2024. Because pixels near the Earth’s rim are affected by the terrestrial atmosphere, the Venus images that are at least 8.85 degrees away from the Earth’s center are analyzed. We employed the aperture photometry technique to calculate the disk-normalized radiance after subtracting the background radiance. The analysis methods are described in detail by [2, 3].
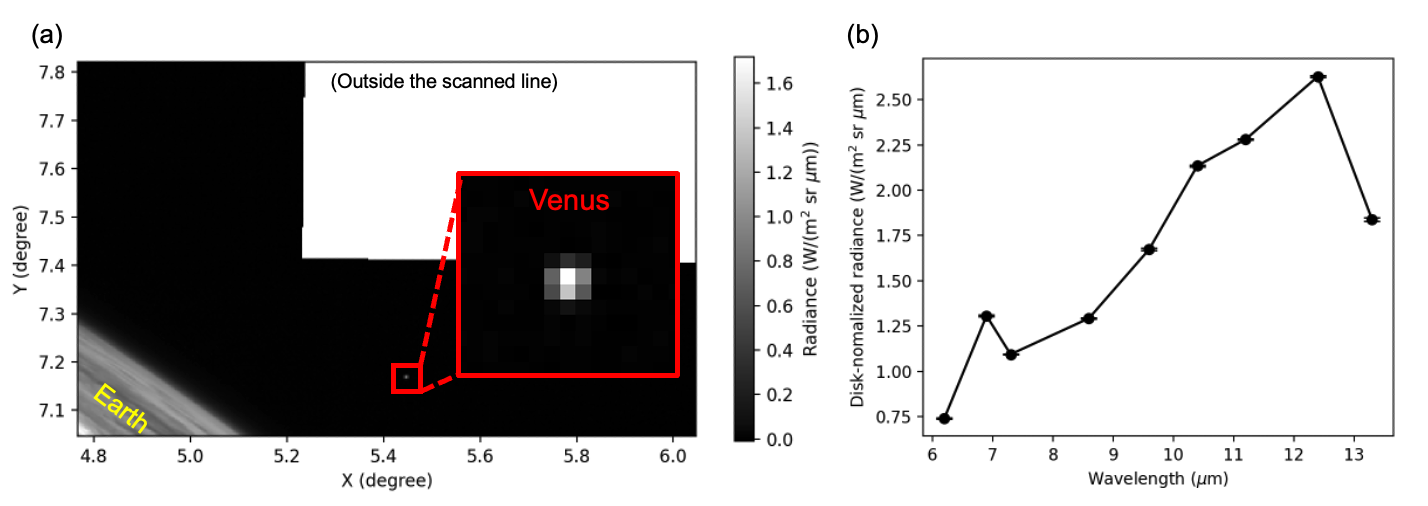
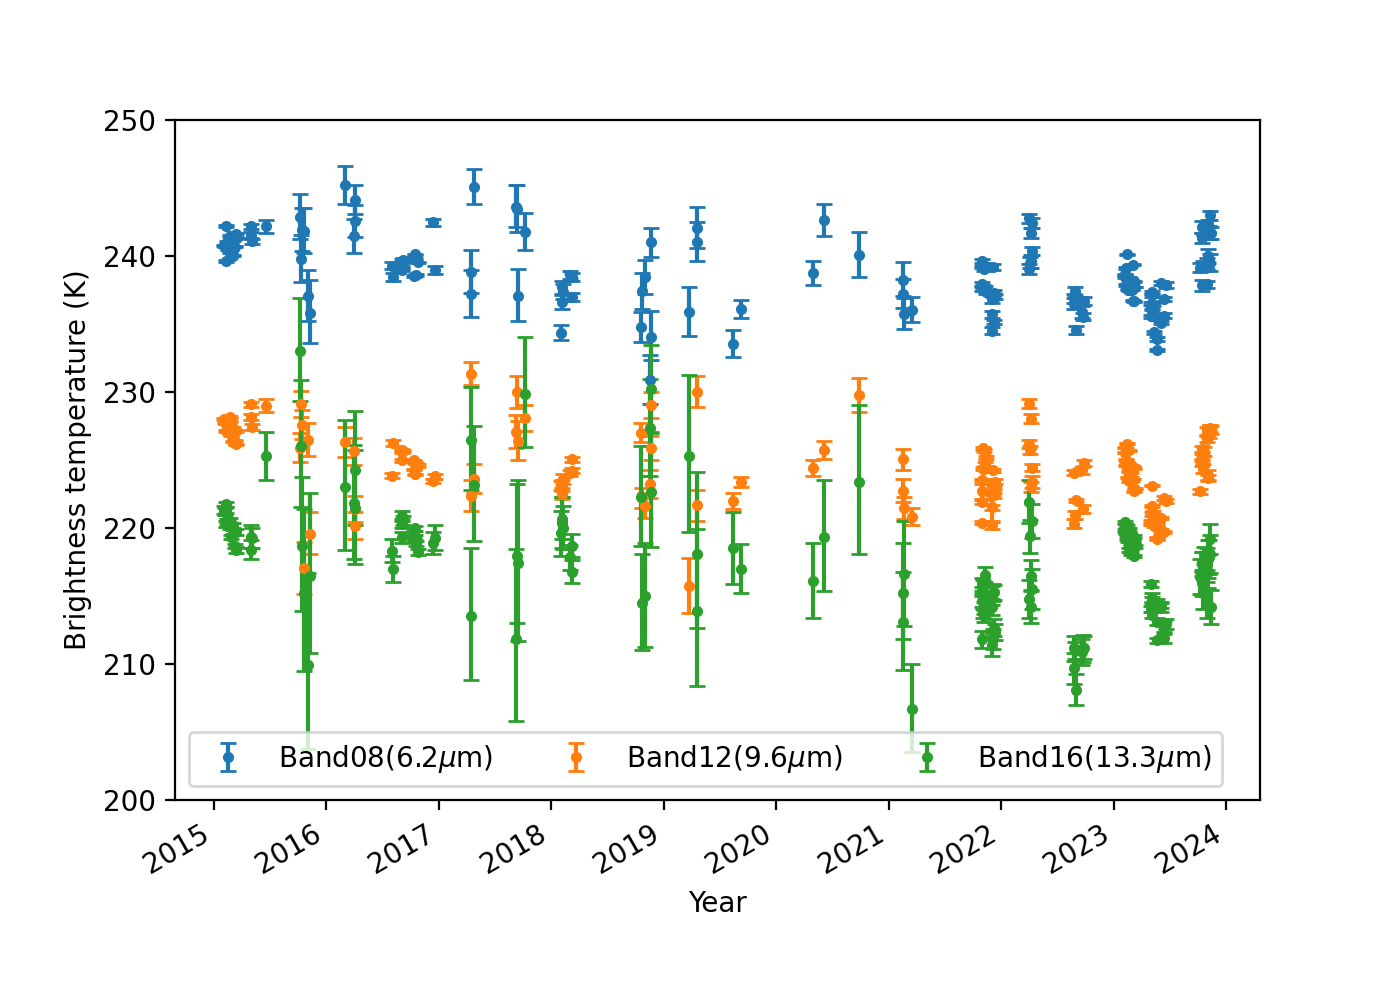
Figure 1 displays an example of the Venus data obtained from HSD. Depending on the distance to the Earth, Venus has been captured with an apparent radius ranging from 5” to 33’’. As previously observed by the Venera-15 and BepiColombo missions, spectral depressions at 8 and 13 microns exist possibly due to the absorption of CO2. In total, 155 spectra have been obtained with similar spectral shapes. The observation can be conducted whenever the Earth hides the Sun, covering a phase angle from 5 to 168 degrees. In Figure 2, the obtained brightness temperatures are shown as a function of time. The brightness temperature at band 12 decreases over time until 2019 and then remains at a similar level. The temporal variation of brightness temperature shows a similar trend among different bands. The correlation coefficients between different bands are always larger than 0.5. Because the imagers onboard Himawari-8 and -9 are calibrated every 10 minutes, this trend cannot be attributed to the instrument degradation but is potentially affected by atmospheric dynamics such as thermal tides. In this presentation, we will discuss the components of the temporal variation in comparison with other Venus datasets.
[1] Okuyama, A. et al., 2018, Validation of himawari-8/ahi radiometric calibration based on two years of in-orbit data. Journal of the Meteorological Society of Japan 96B, 91.
[2] Taniguchi, D. et al., 2022, The Great Dimming of Betelgeuse seen by the Himawari-8 meteorological satellite. Nat Astron 6, 930–935.
[3] Nishiyama, G. et al., 2022, Utilization of a meteorological satellite as a space telescope: the lunar mid-infrared spectrum as seen by Himawari-8. Earth Planets Space 74, 105.
[4] Oertel, D. et al., 1985, Infrared spectrometry of Venus from “Venera-15” and “Venera-16”. Adv. Space Res. 5, 25–36.
[5] Helbert, J. et al., 2023, The second Venus flyby of BepiColombo mission reveals stable atmosphere over decades. Nat Commun 14, 8225.

Figure 1. An example of the Venus data. (a) An image of Venus captured by Himawari-9 on 20 October 2023. The black and white area outside the Earth is space and the outer area of scanning lines. The x- and y-axes correspond to the angular distances from the Earth’s center along the east-west and north-south directions, respectively. (b) The mid-infrared spectrum of Venus obtained from Figure 1-(a). The spectral depression at 8 and 13 microns corresponds to the CO2 absorption.

Figure 2. The temporal variation of the brightness temperatures of Venus at bands 8, 12, and 16.
How to cite: Nishiyama, G., Suzuki, Y., Uno, S., Aoki, S., Iwanaka, T., Imamura, T., Fujii, Y., and Müller, T.: Temporal variation of Venus brightness temperature seen by the Japanese meteorological satellite Himawari-8/9, Europlanet Science Congress 2024, Berlin, Germany, 8–13 Sep 2024, EPSC2024-585, https://doi.org/10.5194/epsc2024-585, 2024.