
 1,2,1,2,5,6,1,1,5,6,5,6,5,6,
- 1Laboratory for Planetary and Atmospheric Physics, STAR Institute, University of Liège, Liège, Belgium (alessandro.moirano@uliege.be)
- 2Institute for Space Astrophysics and Planetology, National Institute for Astrophysics (INAF-IAPS), Rome, Italy
- 3Aix-Marseille Université, CNRS, CNES, Institut Origines, LAM, Marseille, France
- 4Southwest Research Institute, San Antonio, Texas, USA
- 5Department of Industrial Engineering, Alma Mater Studiorum - Università di Bologna, Italy
- 6Centro Interdipartimentale di Ricerca Industriale Aerospaziale, Alma Mater Studiorum - Università di Bologna, Italy
- *A full list of authors appears at the end of the abstract
At Jupiter, the fast planetary rotation, the strong magnetic field and the presence of a relatively high density of charged particles create a powerful electromagnetic environment. The four major moons of Jupiter (Io, Europa, Ganymede and Callisto, also called “Galilean moons”) all orbit within the Jovian magnetosphere, and auroral emissions associated with their orbital motion can be observed (Figure 1). These are caused by the flow of the Io Plasma Torus and the plasma disk past the moons, which triggers a local perturbation that propagates as plasma wave modes (mainly Alfvén waves) down to the planetary atmosphere and back. Here, the Alfvén waves accelerate electrons into the ionosphere, where auroral emissions are generated. The morphology of the satellite-related emission (which is usually called “footprint”) reflects the shape of the wave-fronts of the Alfvén waves traveling from Io to the ionosphere and their bounces in the magnetospheric cavity (Figure 2). The propagation of these waves is affected by the magnetic field and plasma density, therefore, the footprint implicitly contains information on those parameters.
Since 2016, the Juno mission has been providing plenty of high-quality observations of the Io footprint in the infrared (IR) and ultraviolet (UV) bands. The instruments that perform those observations are the Jovian InfraRed Auroral Mapper (JIRAM), whose L-band imager is designed to observe the H3+ emission, and the UltraViolet Spectrometer (UVS), which detects the de-excitation of the atmospheric hydrogen. The observations of the footprints can fulfill multiple, different purposes, such as (1) monitoring plasma conditions near the moons, (2) constraining magnetic field models, (3) investigating the vertical structure of the ionosphere and (4) characterizing the energy spectrum of the precipitating particles. To these ends, the Io footprint represents an ideal candidate, as its emission is brighter than the emission of the other footprints, it occurs in a region weakly affected by other emissions, and Io's environment is the least affected by the solar wind among the major moons.
We propose an overview of the IR and UV observations of the Galilean footprints from Juno, with particular focus on Io. We show the comprehensive dataset of the footprint observations, which is compared to previous observations from the Hubble Space Telescope and to magnetic field models. The agreement with the latest magnetic field model based on the Juno magnetometer (JRM33) is overall very good, with the major deviations in the northern anomaly region. Such dataset can in principle be used to constrain the plasma conditions and its variations at the orbit of the moons, therefore we used two specific cases of the Io footprint observed by JIRAM to show the feasibility of using the footprint position to constrain the density and temperature of the Io Plasma Torus. As a result, we conclude that the Io torus during Juno perijove 11 was potentially less dense than during perijove 32. The same technique has then been applied to the JIRAM and UVS dataset, to determine the general state of the torus over the Juno mission and to highlight potential variations. To support this survey, the radio occultations performed by the radio tracking systems used by Juno’s Gravity Experiment have been included, as they wrap information on the electron content of the Io Plasma Torus. This analysis, spanning 2016-2022, suggests that the Io Plasma Torus can exhibit large variations (30-50%) in density and temperature over a couple of months (Figure 3). More recently, we started to investigate the UV vertical profile of the Io footprint by using limb observations (Figure 4), which are a unique source of information to constrain (1) the energy distribution of the precipitating particles and the energy deposition, and (2) the location of the methane homopause, which absorbs part of the UV emission and destroys the H3+ responsible for the IR emission. Lastly, we will briefly introduce a new fine structure discovered by JIRAM in the footprints and its potential explanation (Figure 5).
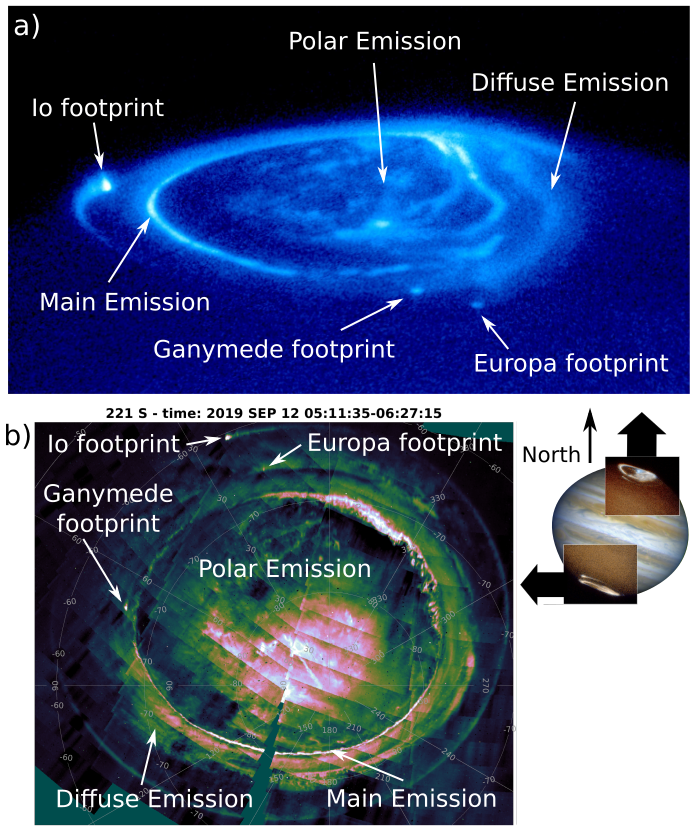
Figure 1. (a) Observation of the northern aurora in the UV band with the Hubble Space Telescope on November 26th 1998. The image shows the auroral footprints of Io, Europa and Ganymede, as well as the principal features of all the aurora. (b) Observation of the southern aurora in the IR band with Juno-JIRAM on September 12th 2019, showing the same features as in panel (a).
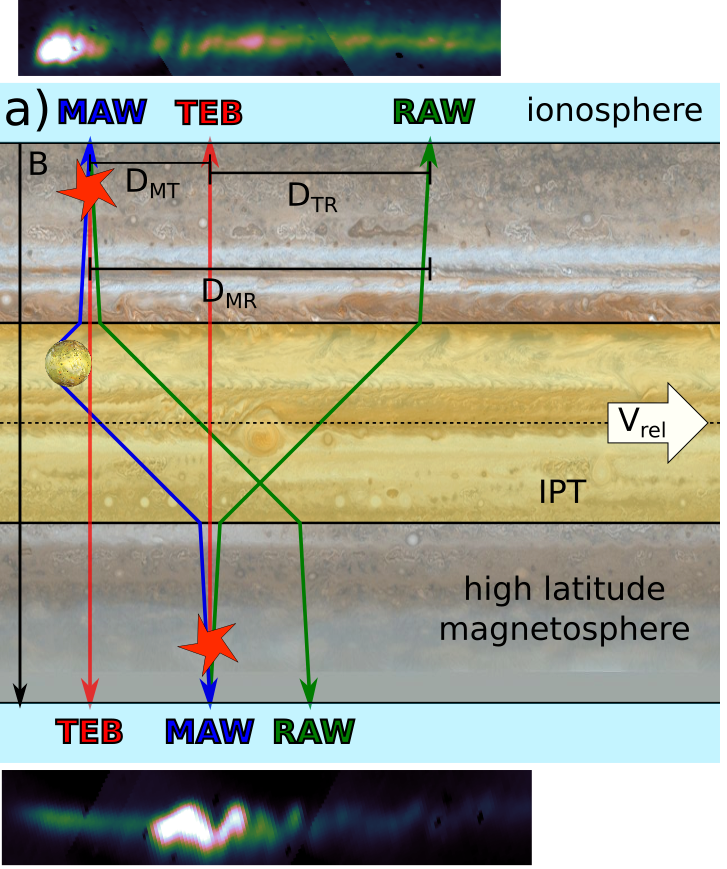
Figure 2. Scheme of the waves and particles giving rise to the different components of the Io footprint. The blue, green and red arrows are the Main Alfvén wing (MAW), Reflected Alfvén wing (RAW) and Trans-hemispheric Electron Beam (TEB), respectively. At the foot of each reflection, a spot is usually observed. The red stars represent the acceleration regions. The images of the Io footprint are acquired by Juno-JIRAM in the IR band.
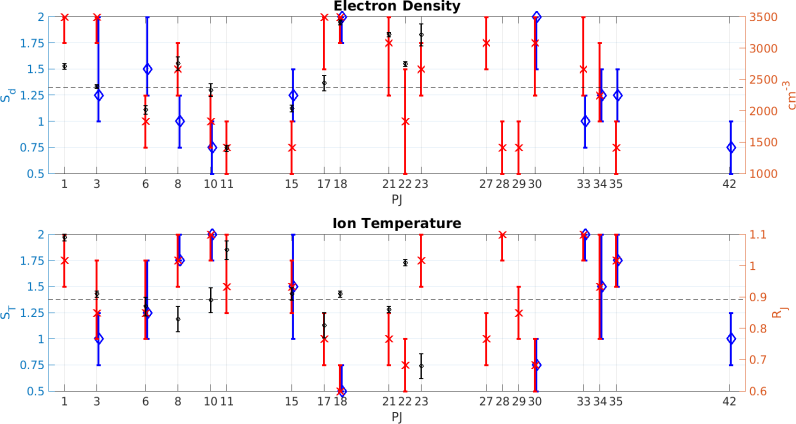
Figure 3. Plot of the electron density and ion temperature of the Io Plasma Torus derived for each perijove from 1 to 42 using JIRAM, UVS and the radio occultations. The vertical axis on the left represents a scaling factor with respect to torus observed by Voyager 1. The blue diamonds are obtained from observations of the footprint in the northern hemisphere, the red crosses in the southern one. The dashed line is the average value. The black circles are the electron density and scale height of the torus (axis on the right) derived from Juno radio occultations only (Moirano et al., 2021).
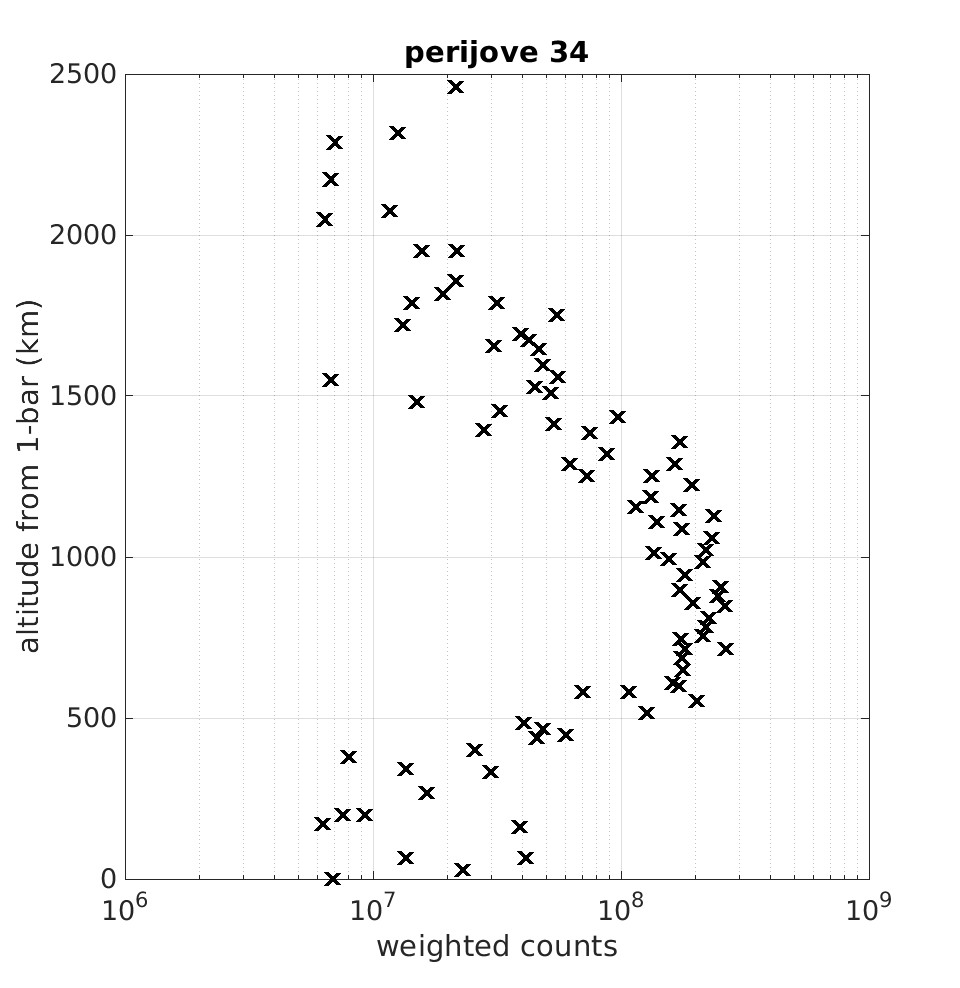
Figure 4. Examples of the UV vertical profile of the Io footprint observed during perijove 34, which peaks between 600 km and 1000 km.
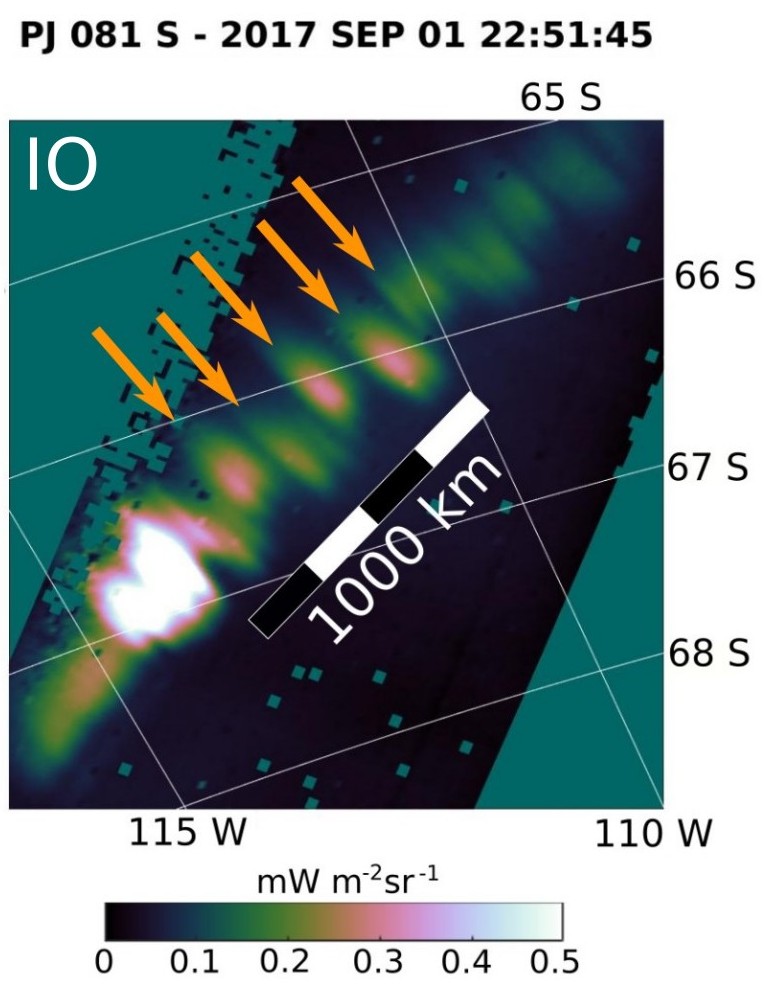
Figure 5. One example of the Io footprints observed by JIRAM during perijove 8 and showing the fine substructure highlighted with orange arrows.
Alberto Adriani (a), Francesca Altieri (a), Chiara Castagnoli (a,b,c), Andrea Cicchetti (a), Bianca Maria Dinelli (b), Davide Grassi (d), Alessandra Migliorini (a), Raffaella Noschese (a), Giuseppe Piccioni (a), Christina Plainaki (d), Pietro Scarica (a), Giuseppe Sindoni (d), Roberto Sordini (a), Federico Tosi (a), Diego Turrini (a), Francesca Zambon (a) // (a) Institute for Space Astrophysics and Planetology, National Institute for Astrophysics (INAF-IAPS), Rome, Italy (b) Institute of Atmospheric Sciences and Climate, National Research Council (CNR - ISAC), Bologna, Italy (c) University of Rome Tor Vergata, Rome, Italy (d) talian Space Agency (ASI), Rome, Italy
How to cite: Moirano, A., Bonfond, B., Mura, A., Hue, V., Caruso, A., Benmahi, B., Grodent, D., Head, L. A., Gérard, J.-C., Sicorello, G., Greathouse, T. K., Gomez Casajus, L., Tortora, P., and Zannoni, M. and the JIRAM team: Moon-induced infrared and ultraviolet auroral emission at Jupiter: overview during the Juno mission, Europlanet Science Congress 2024, Berlin, Germany, 8–13 Sep 2024, EPSC2024-593, https://doi.org/10.5194/epsc2024-593, 2024.