
Statistical analysis on impact craters on Mercury
 1,2,1,1,1,1
- 1INAF-OAPD, Padua, Italy (elena.martellato@inaf.it)
- 2University of Padova, Padua, Italy
Introduction. Impact craters are the most widespread geological features on planetary surfaces with a solid surface and is the outcome of a long collisional history [1]. The analysis of impact craters as a population of objects randomly collected on geological units or surface structures has been the main tool to derive their relative age [2, 3]. Once assumptions on the impactor flux are taken into account, the analysis of such cratering records could also allow to infer absolute ages.
Therefore, crater-based chronologies have long been used to understand the formation and evolution of planetary regions and/or geological structures. The availability of space images of both increasingly larger portion of planetary surfaces and terrains at higher resolutions has enabled the opportunity to create more and more comprehensive global databases of impact craters. Alongside the manual crater counting approach (e.g., [4]), automatic approaches, based for instance on topography, edge detection, and spectral information analyses [5, 6], have been proposed in past.
In this work, we analyse the distribution of Hermean impact craters listed in the catalogue newly generated by means of deep learning techniques [7], and derive information about the major geological events having shaped the surface of Mercury.
Data. The used catalogue of impact craters on the Mercury surface contains features from 1 to 167 km in diameter. It was generated by adapting an existing neural network developed for crater detection on the Moon [7]. Such network combines two main sub-networks: (i) the Generator, which makes use of a super resolution, deep learning-based algorithm, and (ii) YOLOv8 for object detection. The model was trained by using several loss functions for exceeding resolution and detecting objects. After training, the model can detect objects even in high resolution images, ensuring accurate and detailed results [7, 8].
Methods. The work environment is the open-source QGIS, considered the standard GIS software for management of geospatial data and integrating information from different sources. The impact crater catalogue is imported in QGIS and overlapped on the monochrome projected basemap of Mercury, at an average resolution of 166 m/pixel. Additionally, we include the geological maps of some quadrangles, which were compiled by means the Mariner 10 data, and precisely, H-02, H-03, H-06, H-07, H-08, H-11, and H-12. These geological maps are available as shapefiles, corresponding to the Mercury 5M GIS Conversion v2, which can be included in the QGIS project. Through QGIS, we are able to select craters based on specific units and consequently extract the necessary data, in addition to calculate areas for dating purposes.
The crater size-frequent distribution (SFD) is evaluated by means of the cumulative curve. This is a graphical standard plot where the craters are sorted into eighteen bins per diameter decade [9]. The cumulative number reports all the craters larger than or equal a certain diameter bin, per area measured.
This was produced by both a self-developed python code and the Craterstats software [10, 11]. This last allows to use the chronological models by Le Feuvre & Wieczorek (2011) [12] and by Neukum et al. (2001) [13], to derive the absolute ages of all the Hermean quadrangles.
Results. In Fig. 1, we report the first comparison between all the quadrangles (excluding H-01 and H-15, which stand for the north and south poles of Mercury, respectively).
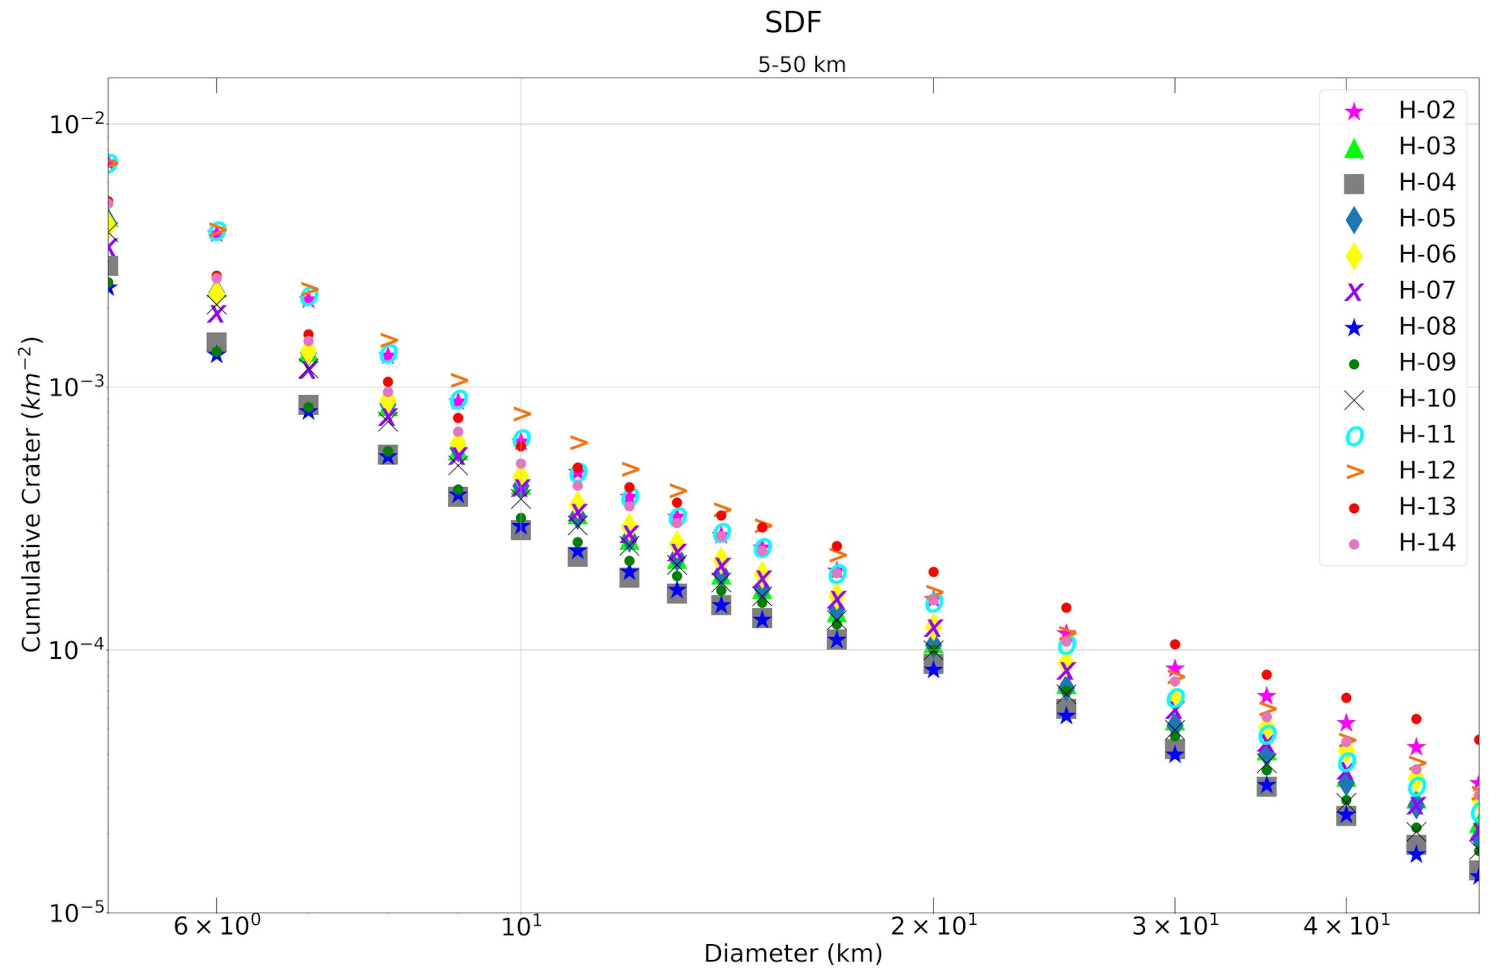
Fig. 1. Comparison of the crater SFD of the Hermean quadrangles. The x-axis reports the binned crater size, while the y-axis the cumulative number.
The quadrangle-based analysis represents only an average comparison, since these areas are only a conventional subdivision of the planet, and they do not reflect actual geological processes that modified it. We therefore consider the geological maps publicly available, compare the crater SFD, and derive absolute ages of the various geological units identified in such quadrangles. In particular, we select quadrangles H-08 (Tolstoj) and H-12 (Michelangelo), which have the lowest and highest cumulative curve (among the available geological maps). In Fig. 2, we show the comparison between each geological unit.
We notice that for the smooth plains we find an age of about 3.7−3.8 Gyr, which is comparable with the age obtained by [14, 15] for the selected smooth plains inside large basins (e.g., Caloris and Rembrandt) and the northern smooth plains. The similar age of terrains spread overall the planet could suggest that they belong to the same evolutionary phase of Mercury, where an extensive volcanic activity emplaced over entire regions of the planet.
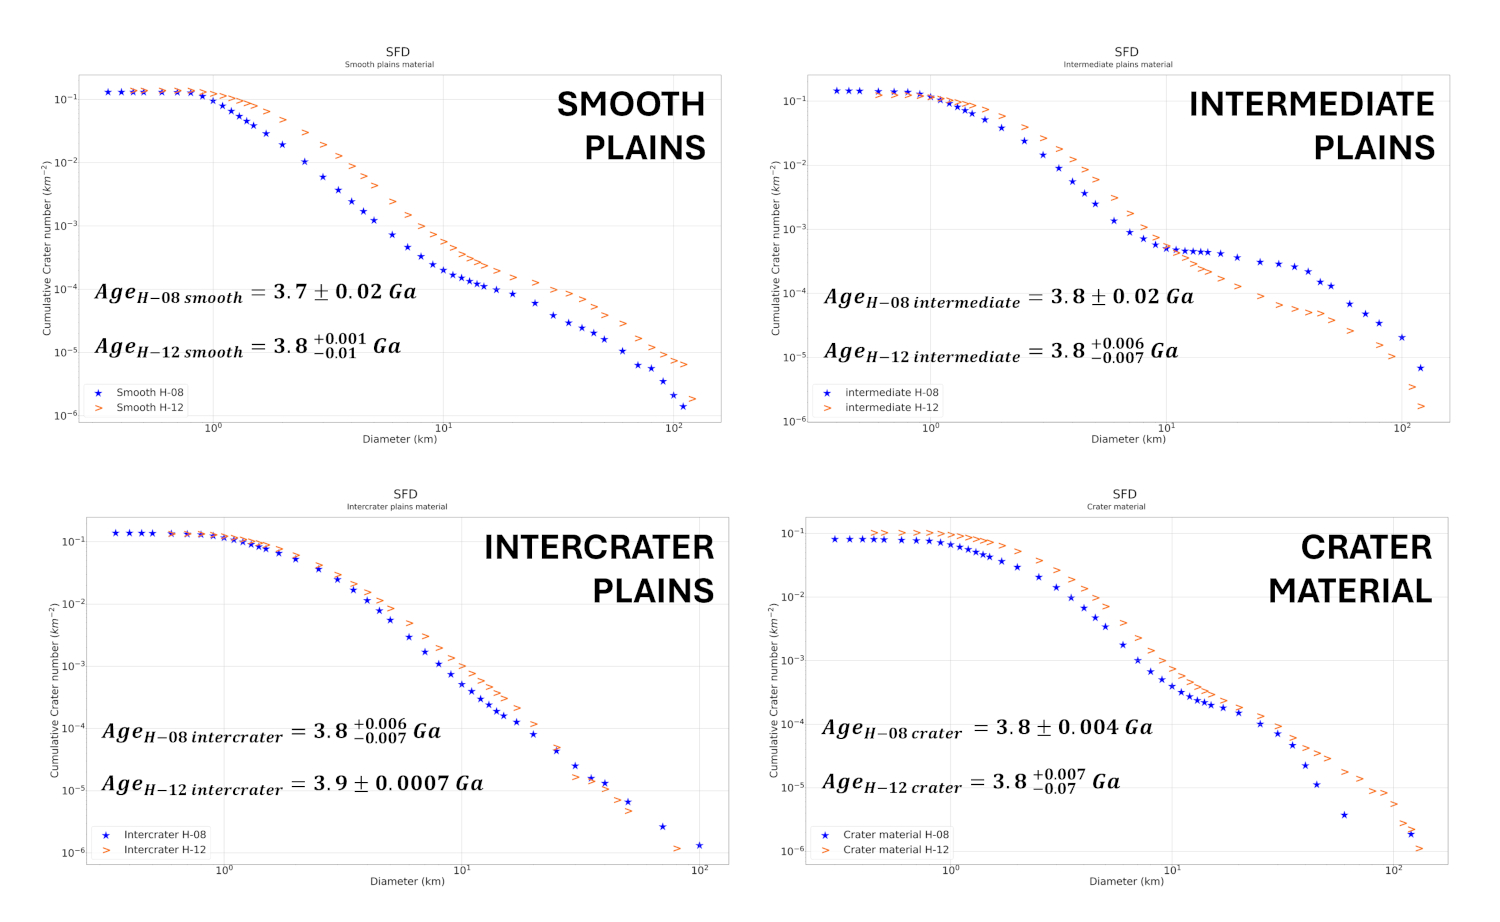
Fig. 2. Age comparison of the main geological units identified on H-08 and H-12 quadrangles.
Conclusions and Future work. In this work we highlight the needs of global crater catalogues to investigate planetary evolution. We are going to select and compare more geological units and surface features belonging to other quadrangles.
Acknowledgements.
The study is part of the INAF MINI-GRANTS (2023) “Origin of water ice on Mercury” (CUP C93C23008450001).
References.
[1] Strom, R.G. et al. (2005) Science 309, 1847−1850. [2] Neukum, G. & Ivanov, B.A. (1994) In: Hazards Due to Comets and Asteroids; University of Arizona Press: Tucson, AZ, USA, 359–416. [3] Fassett, C.I. & Minton, D.A. (2013) Nat. Geosci. 6, 520–524. [4] Robbins, S.J. (2019) J. Geophys. Res. Planets 124, 871–892. [5] Bue, B.D. & Stepinski, T.F. (2006) IEEE Trans. Geosci. Remote Sens. 45, 265–274. [6] Sawabe, Y. et al. (2006) Adv. Space Res. 37, 21–27. [7] La Grassa, R. et al. (2023) Remote Sens. 15(5), 1171. [8] La Grassa, R. et al. (2024) EPSC2024-390. [9] Hiesinger, H. et al. (2000) J. Geophys. Res. Planets 105, 29239–29275. [10] Michael, G.G. & Neukum G. (2010) Earth and Planetary Science Letters 294(3-4), 223−229. [11] Michael, G.G. (2021) In: 5th Planetary Data and PSIDA 2021, LPI Contrib. No. 2549, #7045. [12] Le Feuvre, M. & Wieczorek, M.A. (2011) Icarus 214(1), 1–20. [13] Neukum, G. et al. (2001) Planet. Space Sci. 49(14-15),1507–1521. [14] Head J.W. et al. (2011) Science 333, 1853−1856. [15] Denevi B.W. et al. (2013) J. Geophys. Res. Planets 118, 891−907.
How to cite: Martellato, E., Faletti, M., Cremonese, G., Marzari, F., La Grassa, R., Bertoli, S., Tullo, A., and Re, C.: Statistical analysis on impact craters on Mercury, Europlanet Science Congress 2024, Berlin, Germany, 8–13 Sep 2024, EPSC2024-606, https://doi.org/10.5194/epsc2024-606, 2024.