
 1,4,5,5,6,
- 1LATMOS/IPSL, UVSQ Université Paris‐Saclay, Sorbonne Université, CNRS, Paris, France (alice.legall@latmos.ipsl.fr)
- 2LESIA, Observatoire de Paris, Université PSL, Paris France
- 3National Radio Astronomy Observatory, Socorro, NM, USA
- 4LMD-IPSL, CNRS, Sorbonne Université, Paris, France
- 5Université Paris-Saclay, CNRS, GEOPS, 91405, Orsay, France
- 6ISAE-Supaéro, Toulouse, France
Introduction
Saturn’s icy satellites, in synchronous rotation around Saturn, often display large differences between their leading (L) and trailing (T) sides, which interact differently with their orbital environment and, in particular, with Saturn’s dust rings. Indubitably, the most dramatic hemispheric dichotomy in the Saturnian system occurs at Iapetus, whose T side and poles are about an order of magnitude optically brighter than most of its L hemisphere. The origin of this two-tone coloration has long been controversial; thanks to the observations of the Cassini mission which explored the Saturnian system from 2004 to 2017, there now seems to be a consensus toward an exogenic deposition of low-albedo materials originating from Phoebe’s vast debris ring that crosses Iapetus’ orbit [e.g., 1, 2, 3]. However, questions remain about the composition and vertical extent of Iapetus’ L hemisphere dark deposit. Measuring the thermal emission from Iapetus at different wavelengths, thus probing different depths, can help answering these questions. In particular, probing the L side of Iapetus at multiple centimetric wavelengths can put a firmer number on the thickness of the dark layer thus bringing key constraints for dynamical models aiming at reproducing dust distribution on Iapetus [e.g., 4]. That is why, in 2017, we have launched an observing campaign to collect spatially-resolved observations of Iapetus from the Jansky VLA (Very Large Array) telescope. So far, a total of 30 hours of observations were collected [5].
Radio maps of Iapetus
The VLA telescope is an interferometry radio-telescope consisting of 28 antennas organized in a Y shape in the plains of San Agustin in New Mexico, USA. Since 2018, it was used to measure the thermal emission from Iapetus at various wavelengths from 0.7 to 6.0 cm i.e., in the Q, Ka, K, Ku, X and C bands. A total of 11 radio maps were built from these observations; Fig 1 displays 7 of them. They all probe Iapetus dayside, considering the location of the Saturn system and the Earth in relation to the Sun but with different portions of the leading side in the visible disk. The most resolved maps (28 May and 3 June 2018) show an asymmetry in the emitted flux with more flux coming from the dark face of Iapetus than from the bright face, implying that the latter is colder or at least less emissive. In addition to VLA observations, Iapetus’s thermal emission was also mapped in 2007 by the radiometer on board the Cassini probe at 2.2 cm [6].
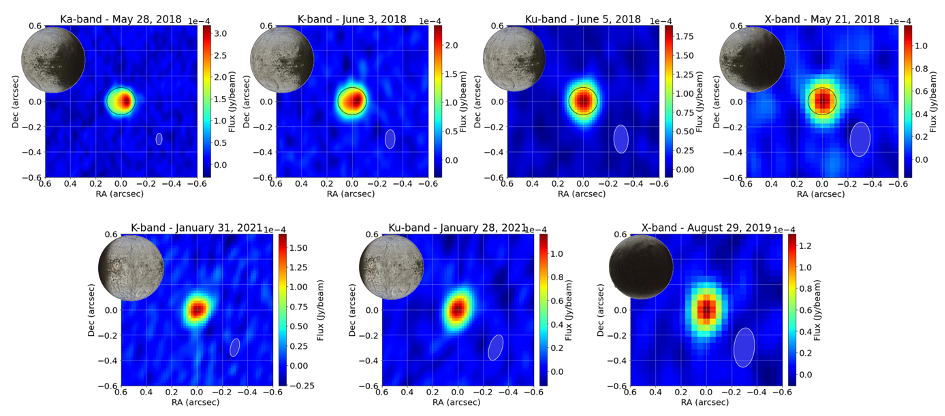
Fig. 1: Maps of Iapetus’ thermal flux collected in 2018, 2019 and 2021 from the JVLA (Very Large Array telescope, New Mexico, USA) at different wavelengths/bands in the microwave domain. Insets indicate the size of the primary beam and the albedo map of the visible disk.
Thermal emission model
The interpretation of VLA maps requires a thermal emission model. The model we developed combines a thermal model, providing the physical temperatures profiles (K) in Iapetus’ subsurface at different latitudes and longitudes, a transfer radiative model, to produce brightness temperature (K) maps of Iapetus which can be converted into radiance (erg.cm−2.s−1/sr−1) and then integrated over the beam (flux in Jy/beam) associated to each observation.
Thermal model - We adapted a multilayer model called “Multi-layered Implicit Heat Transfer Solver” (MultIHeaTS) [7] to the case of Iapetus. The unique source of heat is the Solar flux. The leading side subsurface consists in a top layer (the dark dust layer) overlying a bottom layer (the water ice crust) while a water ice monolayer is assumed for the trailing side. The main parameters of the bi-layer model are the porosities of each layer (which primarily controls the effective thermal inertia) and the thickness of the top layer (which, based on ground-based observations from the Arecibo 12.6-cm radar system should not exceed a few meters [8]). At cm wavelengths, the emission depth is expected to be larger than the depth of penetration of the diurnally-varying solar insolation. As a consequence, the sensed subsurface temperatures are a combination of diurnal and seasonal components and the thermal model is set to provide temperature profiles down to tens of meter depths.
RT model - We tested two multi-layer radiative transfer models: (i) a model proposed by [9] for RT in stratified agricultural soils which assumes smooth and flat buried interfaces with no scattering within the layers, (ii) the Snow Microwave Radiative Transfer (SMRT) model designed for snow or sea-ice [10], which considers wave scattering, absorption, reflection, and transmission. Both models take as inputs temperature profiles and their main parameter is the complex dielectric permittivity of the dark dust.
Preliminary results
In this presentation, we will compare observations to model predictions for various combinations of parameters looking for the parameter combination that best reproduces the observations. As an example, Fig. 2a shows the best-fit model for the observation of May 28, 2018; it was obtained for a dark layer of thickness 1 cm and made of organic materials with the [9] model. The L/T asymmetry is well reproduced but the residual map suggests that the emissivity of the T side is overestimated by the model while it is the opposite on the L side (Fig. 2b). This likely like indicates that volume scattering in the water ice crust cannot be neglected. Predictions using the [10] model should therefore lead to better fits.
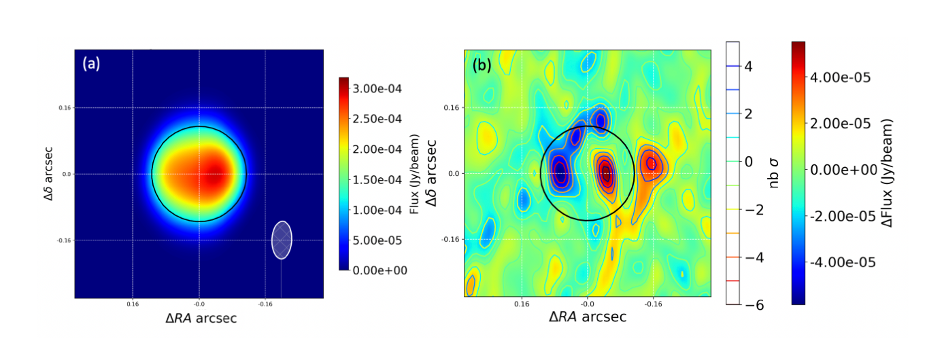
Fig. 2: (a) Best-fit model for the observation of May 28, 2018. (b) Residual map (data-model).
References
1. Buratti et al., 2002, Icarus 155, 375–381
2. Verbiscer et al., 2009, Nature 461, 1098.
3. Dalle Ore et al., 2012, Icarus 221 (2), 735–743
4. Tamayo et al. 2011, Icarus 215, 260
5. Bonnefoy et al., 2024, Icarus 41, 115950
6. Le Gall et al., 2014, Icarus 241, 221–238
7. Mergny and Schmidt, submitted
8. Ostro et al., 2006, Icarus 183 (2), 479–490.
9. Burke et al., 1979, J. Geophys. Res., 84( C1), 287– 294
10. Picard and al., 2018, Geoscientific Model Development 11, 2763–2788
How to cite: Le Gall, A., Raza, S., Lellouch, E., Butler, B., Bonnefoy, L., Leyrat, C., Schmidt, F., Mergny, C., Robin, C., Meyer, F.-X., and Harrar, L.: Iapetus: Investigating the most dramatic hemispheric dichotomy in the Solar system with radio observations, Europlanet Science Congress 2024, Berlin, Germany, 8–13 Sep 2024, EPSC2024-618, https://doi.org/10.5194/epsc2024-618, 2024.