
Constraining Ceres' exposed ice: grain size, abundance, and is it salty?

- Caltech, Division of Geological and Planetary Sciences, United States of America (vkachmar@caltech.edu)
Ubiquitous phyllosilicates and carbonates in Ceres’ surface regolith reveal extensive water-rock interaction in the past [1]. A key area of continued study is the water ice content of the crust and how it is mixed with regolith or salt. Nuclear spectroscopy data suggest an ice table may be buried just within a few mm from the surface, gradually receding to larger depths toward the equator due to increasing solar insolation [2]. On the other hand, a global inventory of ice-related morphological features points to a heterogeneous distribution of ice in the subsurface and a relatively low ice content (< 50 vol%) [3]. Gravity data places even a more conservative constraint on Ceres’ crustal ice (< 25 vol%), necessitating stronger phases such as hydrated salts (≥ 36 vol%) to account for the observed topography [4, 5]. Ice has been spectroscopically detected in 9 fresh craters [6] where it was likely excavated by impacts. This offers a window into Ceres’ shallow subsurface and the nature of ice in its crust.
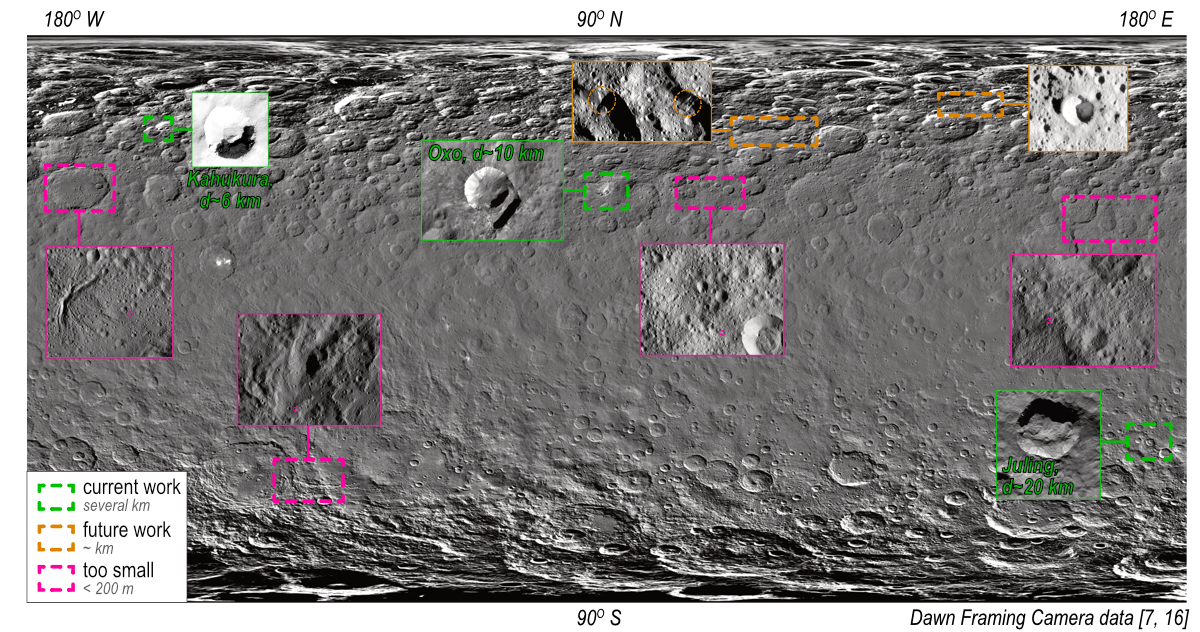
Figure 1. Ice exposures in fresh impact craters, modified from [6].
Here, we investigate the physical form, grain size, purity, and salt content of ice in 3 sufficiently large fresh craters (Figure 1) to constrain ice emplacement mechanisms. We use data from the Dawn Framing Camera (FC; broadband 0.4-1.1 µm filter) [7] to determine the geological setting of ice and the Dawn Visible and Infrared Spectrometer (VIR; 1—5.1 µm) [8] to constrain the physical properties of ice, modeled as intimate (Hapke theory [9]) or areal spectral mixtures with Ceres’ average regolith [10, 11]. We calculate a variety of spectral metrics, e.g., 2 µm band area vs. the 1.1—1.7 µm spectral slope (Figure 2), for both modeled and VIR spectra of ice deposits. These metrics track with ice abundances and grain sizes differently for the mixing modes, which allows us to differentiate between them.
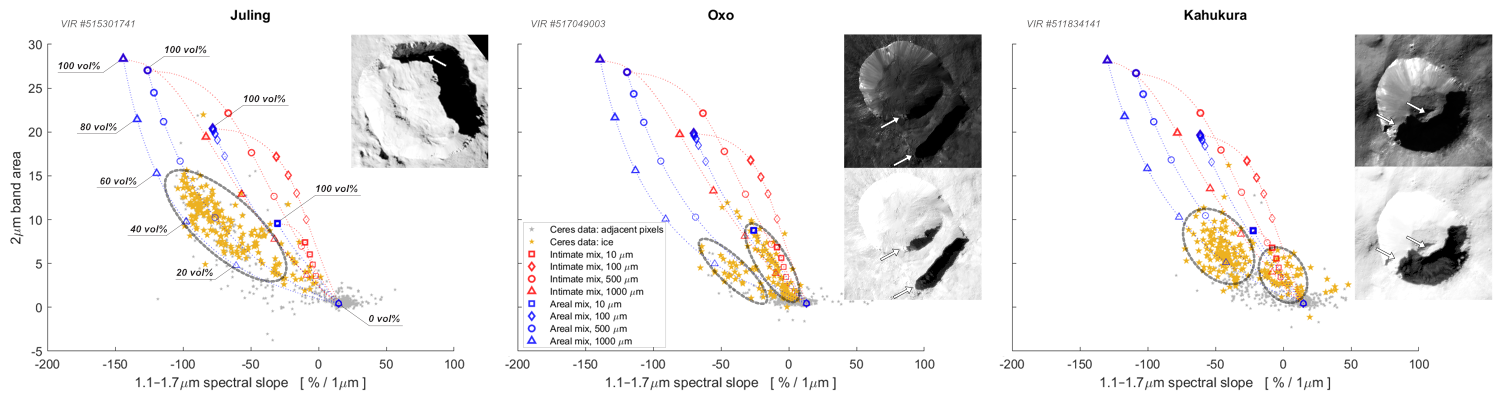
Figure 2. Spectral metrics computed from VIR data and numerical models of ice quantity and grain size for mixtures with local regolith.
Our results show that ice in the studied craters is different (Figure 2), and these variations are intrinsic to the deposits. Juling crater seems to have relatively pure chunks of coarser-grained ice (areal mixes with regolith). Ice in Oxo crater appears to be of two kinds – either well-mixed with regolith (intimate) or in small patches (low abundance areal). Part of the Oxo ice-bearing deposit is sun-illuminated, which suggests a different thermal regime within the same deposit that could explain spectral differences in ice. We see a similar picture in Kahukura crater where ice from the shadowed areas cluster in the parameter space predicted for coarser-grained ice in areal mixtures and ice from illuminated areas is better described by intimate mixes or low abundance areal mixes. This is consistent with thermal processing of ice and ongoing sublimation [e.g., 12–14].
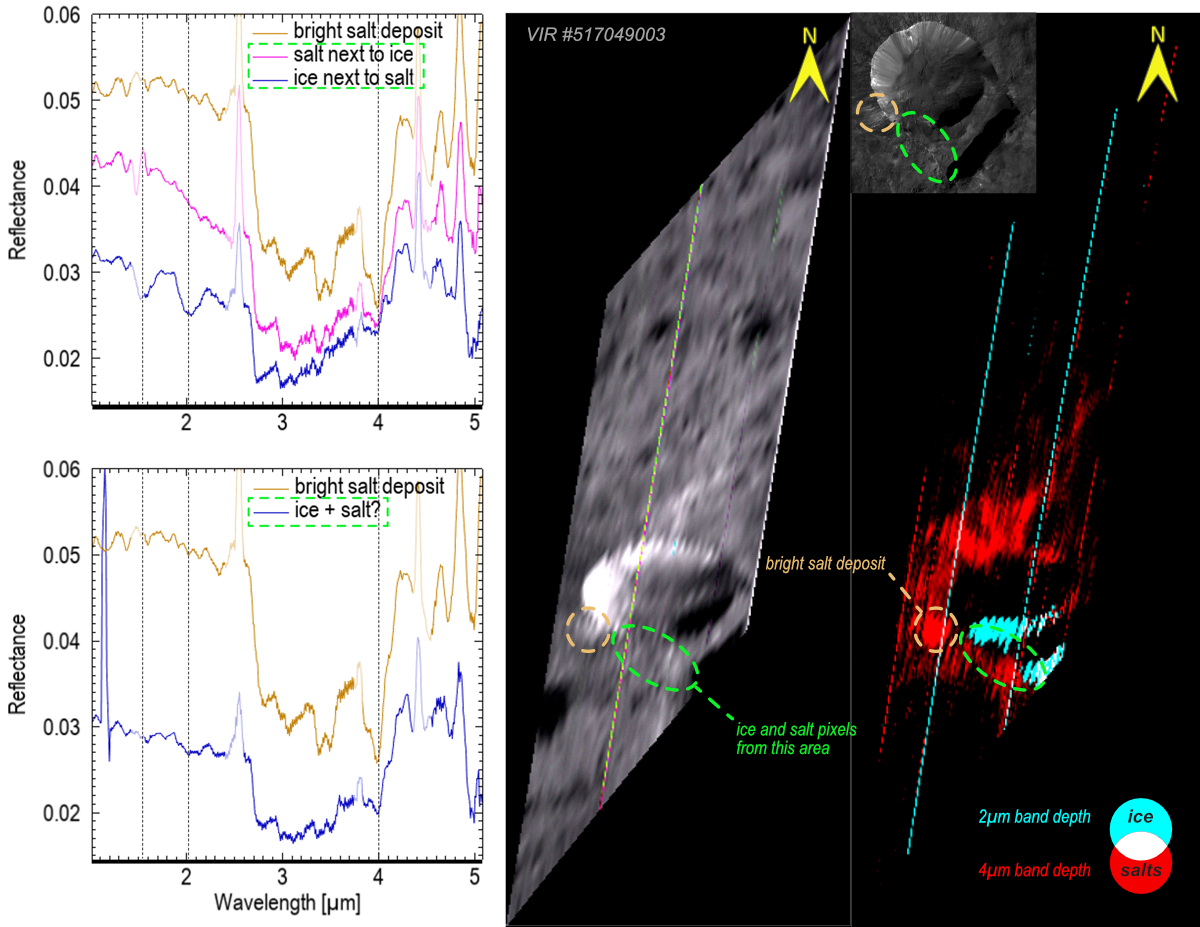
Figure 3. Spectra of mixed ice and salt in Oxo crater.
Finally, we examine whether ice deposits are excavated diapirs of salty ice, whose sublimation is theorized to produce Ceres’ bright sodium carbonate deposits [15]. Spectra of Oxo deposits show suggestive evidence for salty ice, and our ongoing search has revealed no such evidence in the other craters so far. Our spectral modeling of ice+anhydrous sodium carbonate mixtures shows that salt may remain undetected in ice deposits. For intimate mixtures with fine-grained ice, up to 70 vol% of sodium carbonates may be non-detectable.
References: [1] De Sanctis MC & Raponi A in “Vesta and Ceres”, ed. Marchi S et al (2022) ISBN: 97811088563242022; [2] Prettyman TH et al (2017) Science, 355(6320), 55–59; [3] Sizemore HG et al (2018) JGRP, 124(7), 1650–1689; [4] Ermakov AI et al (2017) JGRP, 122(11), 2267–2293; [5] Fu RR et al (2017) EPSL, 476, 153–164; [6] Combe J-Ph et al (2019) Icarus, 318, 22–41; [7] Nathues A et al (2016) Dawn FC2 calibrated Ceres images V1.0, dawn-a-fc2-3-rdr-ceres-images-v1.0, NASA PDS; [8] De Sanctis MC et al (2015) Dawn VIR calibrated Ceres infrared spectra V1.0, dawn-a-vir-3-rdr-ir-ceres-spectra-v1.0, NASA PDS; [9] Hapke B (2012) ISBN: 9781139025683; [10] Kachmar VV et al (2023) LIV LPSC, #1398; [11] Kachmar VV & Ehlmann BL (2024) LV LPSC, #1334; [12] Hayne PO & Aharonson O (2015) JGRP, 120(9), 1567–1584; [13] Nathues A et al (2015) Nature, 528, 237–240; [14] Schorghofer N et al (2024) Planet Sci, 5, 99; [15] Stein N et al (2023) JGRP, 128(7); [16] Roatsch T et al (2016) Dawn FC2 derived Ceres mosaics V1.0, dawn-a-fc2-5-ceresmosaic-v1.0, NASA PDS.
How to cite: Kachmar, V. and Ehlmann, B. L.: Constraining Ceres' exposed ice: grain size, abundance, and is it salty?, Europlanet Science Congress 2024, Berlin, Germany, 8–13 Sep 2024, EPSC2024-677, https://doi.org/10.5194/epsc2024-677, 2024.