
 1,2,3,4
- 1Graduate School of Science, The University of Tokyo
- 2Graduate School of Frontier Sciences, The University of Tokyo
- 3Laboratoire Atmosphères, Observations Spatiales (LATMOS) / IPSL, Université de Versailles Saint-Quentin
- 4Faculty of Science, Kyoto Sangyo University
Introduction
The horizontal distribution of sulfuric acid clouds in the Venusian atmosphere is an essential factor that influences the solar energy absorbed by the planet. The cloud layer reflects about 75% of the solar energy [1] and controls the amount of energy input to the planet. Understanding how sulfur dioxide, SO2, the precursor of sulfuric acid, is transported from the lower atmosphere to the cloud top, where the cloud particles are formed from SO2 photochemically, is one of the essential subjects for understanding the Venusian climate system. Japanese Venus orbiter Akatsuki [2] has been conducting new observations to understand the supply and consumption process of SO2. The ultraviolet imager onboard Akatsuki is equipped with two bandpass filters centered at 283 nm for observation of SO2 and 365 nm for the unidentified UV absorber, taking disk images every two hours at two wavelengths [3]. In recent analysises, the local time mean field of the temperature field obtained by mid-infrared observations of Akatsuki has confirmed that the wavenumber 2 component of thermal tides has a large amplitude at low latitudes, which can be one of the processes that explains the variation of SO2 at the cloud top altitude [4, 5]. In this study, we have developed a method to retrieve only the effect of absorption by SO2 from the 283 nm images by using additional images simultaneously taken through a 365 nm filter. We obtained the local time and latitudinal mean distribution of SO2 to analyze on the transport by thermal tides with large amplitude in the mean field.
Dataset
In this study, we used over 15,000 pairs of 283 and 365 nm UV images taken by the Japanese Venus orbiter Akatsuki. The main absorbers around 283 nm are both SO2 and the unidentified UV absorber, while the absorption of SO2 is negligible and that of the unidentified UV absorber is dominant at 365 nm. The UV images are Level 3b data, which are 2880 by 1440 maps of calibrated radiance in the longitude-latitude coordinates expanded from 1024 by 1024 Venus disk images taken by the Akatsuki UV imager. We binned down to 120 by 60 to reduce computational cost.
Retrieval of Sulfur Dioxide
We used radiative transfer calculations to calculate reflectance under various amounts of SO2 and the unidentified UV absorber to create a look-up table. The calculations were performed under the same geometrical conditions as those of the observation of each pixel on the UV images by using our originally developed calculation code based on the adding-doubling method suitable for the calculation of multiple scattering under a divided icosahedral grid for spherical numerical integration to increase suitability for comparison with observations from orbital positions. The effect of the unidentified UV absorber was considered as the imaginary part, ni, of the complex refractive index of the sulfuric acid solution cloud droplets. First, ni is obtained from the 365 nm image under certain initial conditions. The ni has wavelength dependence, so it is converted to a value at 283 nm using the function of wavelength of ni estimated from the Venus Express UV spectroscopy observations. Next, the 283 nm image and the ni value are used to determine the amount of SO2. The obtained amount of SO2 is used again to obtain the value of ni from the 365 nm image. By performing this loop calculation until convergence, the SO2 and ni values were simultaneously retrieved. We performed a sensitivity analysis to cloud altitude.
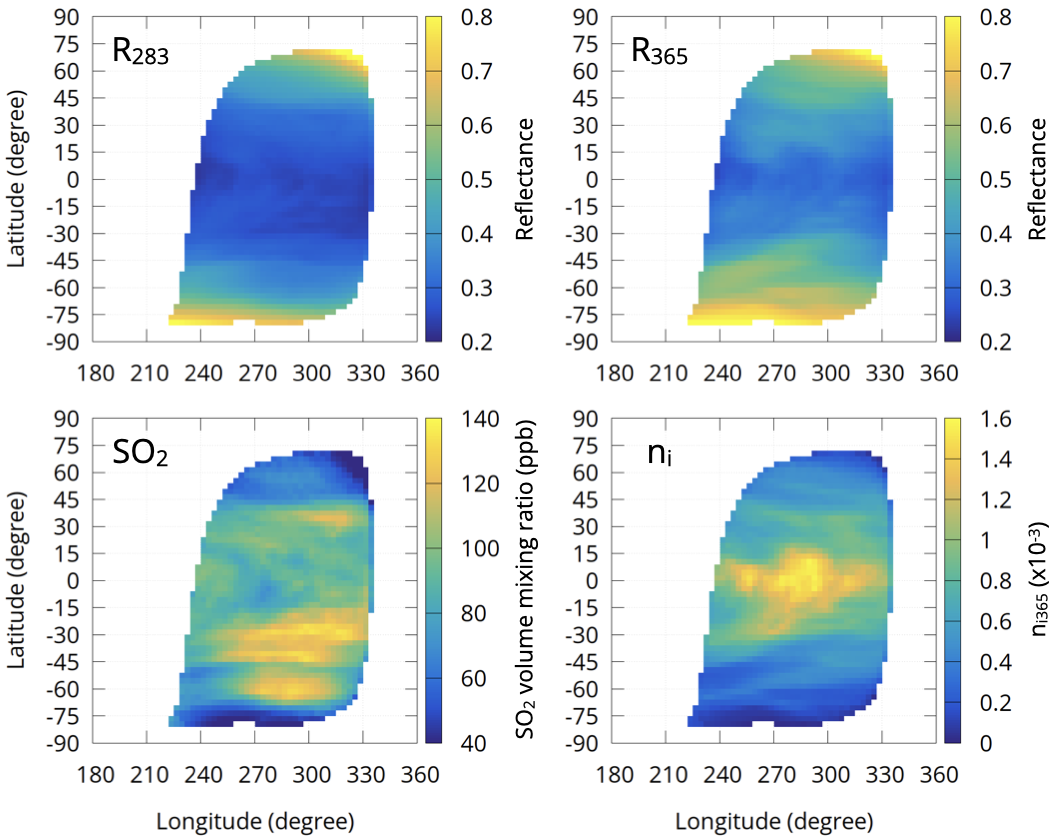
Figure 1: An Example of retrieval from two UV images. Top two figures are observed reflectance at 283 and 365 nm. Left bottom is retrived amount of SO2 and right bottom is ni.
Local Time Distribution of Sulfur Dioxide
Using all of the horizontal distributions of SO2 retrieved from 15,000 pairs of UV images, we obtained the mean distribution of SO2 in local time-latitude coordinates shown in Fig. 2.
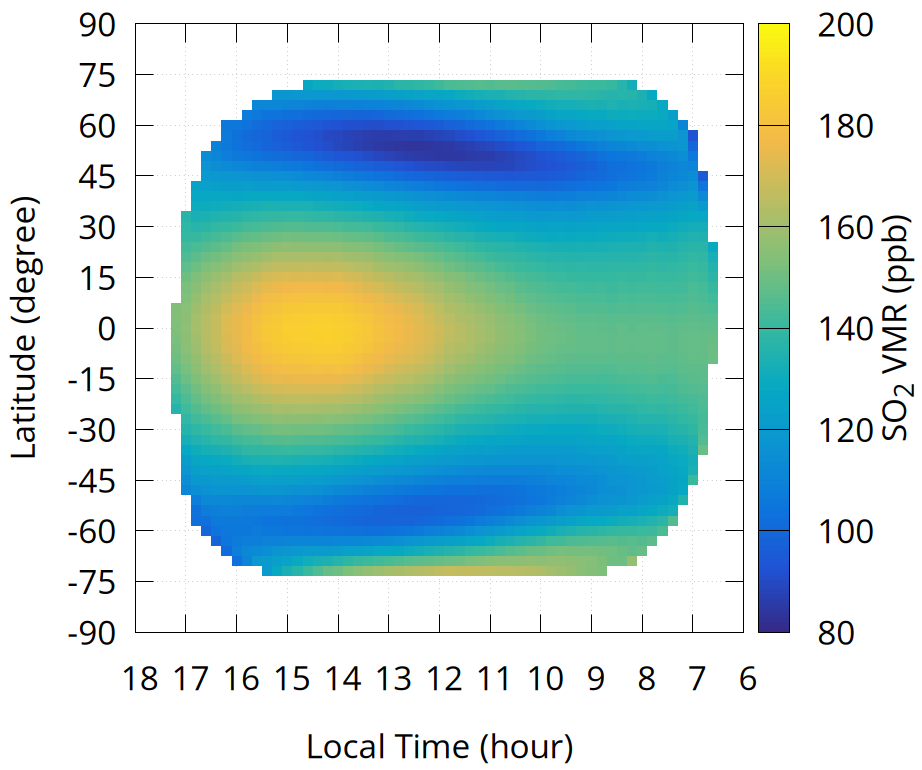
Figure 2: Mean distribution of SO2 on local time and latitude coordinates. The left side of the figure is the afternoon side, and the right is the morning. There is an single maximum around 14-15 in the afternoon.
The mean value of SO2 is 80 to 200 ppb, which is consistent with the previous study [6]. The distribution has a clear single peak, and the mixing ratio of SO2 monotonically increases from the morning to around 14:30 and decreases toward the terminator of the evening. In the latitudinal direction, it decreased from low to middle latitudes. The distributions can be explained by the vertical movement of air excited by thermal tides of wavenumber 2. Thermal tides have a structure that is warmer in the afternoon and cooler in the morning. When the background wind passes through this structure, the air is lifted most on the afternoon side. This causes SO2, which is abundant in the lower layers, to be lifted to the cloud-top region, resulting in a single maximum on the afternoon side. The distribution obtained by this study is qualitatively consistent with the result of a Venus GCM with photochemistry [7] and the wave structures reproduced by the Venus GCM by [8].
References
[1] Taylor, F., and D. Grinspoon (2009), Climate evolution of Venus, J. Geophys. Res., 114, E00B40, doi:10.1029/2008JE003316.
[2] Nakamura, M. et al. (2016), AKATSUKI returns to Venus, Earth Planets Space, 68, 75, doi:10.1186/s40623-016-0457-6.
[3] Yamazaki, A., et al. (2018), Ultraviolet imager on Venus orbiter Akatsuki and its initial results, Earth Planets Space, 70, 23, doi:10.1186/s40623-017-0772-6.
[4] Kouyama, T. et al. (2019), Global structure of thermal tides in the upper cloud layer of Venus revealed by LIR on board Akatsuki, Geophysical Research Letters, 46, 9457–9465, doi:10.1029/2019GL083820.
[5] Fukuya, K. et al. (2021), The nightside cloud-top circulation of the atmosphere of Venus, Nature, 595, 511–515, doi:10.1038/s41586-021-03636-7.
[6] Belyaev, D. et al. (2012), Vertical profiling of SO2 and SO above Venus’ clouds by SPICAV/SOIR solar occultations, Icarus, 217, 2, doi: 10.1016/j.icarus.2011.09.025.
[7] Stolzenbach, A. et al. (2023), Three-dimensional modeling of Venus photochemistry and clouds, Icarus, 395, 115447, doi:10.1016/j.icarus.2023.115447.
[8] Takagi, M. et al. (2018), Three-dimensional structures of thermal tides simulated by a Venus GCM, Journal of Geophysical Research: Planets, 123, 335–352, doi:10.1002/2017JE005449.
How to cite: Iwanaka, T., Imamura, T., Aoki, S., Marcq, E., and Sagawa, H.: Distribution and Variation of the Venusian Cloud-top Sulfur Dioxide Derived from Akatsuki UV Images, Europlanet Science Congress 2024, Berlin, Germany, 8–13 Sep 2024, EPSC2024-680, https://doi.org/10.5194/epsc2024-680, 2024.