
Mercury's thermal phase curve: multi-band mid-infrared observations from geostationary meteorological satellites
 1,3,4,5,
- 1Max-Planck-Institut fuer Extraterrestrische Physik, HEG, Garching, Germany (tmueller@mpe.mpg.de)
- 2Vantage Systems, Inc., NASA-GSFC, Greenbelt, MD 20706, USA
- 3DLR, Rutherfordstr. 2, 12489 Berlin, Germany
- 4The University of Tokyo, 7-3-1 Hongo, Bunkyo-ku, Tokyo, Japan
- 5National Astronomical Observatory of Japan, 2-21-1 Osawa, Mitaka, Tokyo, Japan
- 6Univ. Hamburg, Meteorologisches Institut, Bundesstr. 55, 20146 Hamburg, Germany
- 7RIKEN Center for Advanced Photonics, 2-1 Hirosawa, Wako, Saitama, Japan
Thermal infrared (IR) observations of Mercury are scarce. Space observatories usually cannot measure so close to the Sun, twilight observations from ground are difficult, and the zodiacal background is very strong. Hansen (1974) determined Mercury's surface temperature and emissivity via IR photometer measurements at 3.8 and 4.7µm. Sprague et al. (1994) conducted spectroscopic observations (7.3-13.5 µm) of three locations on the surface of Mercury via an IR spectrometer at the InfraRed Telescope Facility (IRTF). They found evidence for Anorthosite and Basalt on the surface. Emery et al. (1998) interpreted two epoch mid-infrared (5-12 µm) measurements obtained from the Kuiper Airborne observatory via the High-efficiency Infrared Faint Object Grating Spectrometer (HIFOGS). They developed a new rough-surface thermal model for Mercury and looked into grain-size and surface composition aspects. Sprague et al. (2000a) presented a low-resolution N-band spectrum (8.1-13.25 µm) taken with Mid-Infrared Array Camera (MIRAC) at the Steward Observatory. The measurements were centered on a surface region which was not imaged by Mariner 10. The spectra included signatures of the surface roughness and mineralogy. Overall, the very few published datasets cover only a limited phase angle and wavelength range. And, many questions about Mercury’s thermal behaviour remain unanswered.
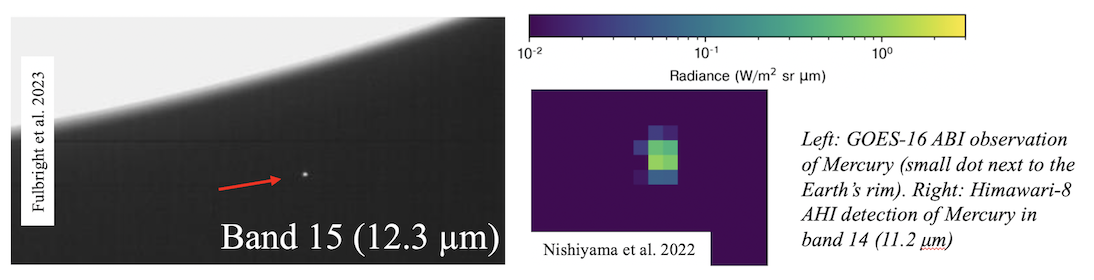
Recent works by Nishiyama et al. (2022) and by Fulbright et al. (2023) opened a new door to thermal observations of Mercury. Several geostationary weather satellites carry well-calibrated multi-band IR instruments and they detect Mercury very frequently when its apparent position is close to the Earth’s rim: Himawari-8/-9 (AHI instrument), GOES-16/-17/-18 (ABI instrument), and MeteoSat-8/-9/-10/-11 (SEVIRI instrument). They have 10 (AHI, ABI) or 8 (SEVIRI) well calibrated IR channels in the range between 3.9 and 13.4 µm. The measurements cover a phase angle range from about -160∘ to +160∘, including data at phase angles below 5∘ (close to superior conjunction). The apparent size of Mercury varies between about 4.5 and 13 arcsec in diameter.
We interpret these measurements with a thermophysical model (TPM) of Mercury which is based on a lunar model (Müller et al. 2021), and uses published physical and thermal properties of Mercury’s surface. It explains the data obtained by the geostationary satellites very well and it can also reproduce the published IR spectra on a 5-10% level.
When applying our TPM to the new data we see for the first time Mercury’s full phase curve, its thermal behaviour close to the superior conjunction (very small phase angles), and its spectral (hemispherical) emissivity. We also study different concepts of roughness modeling and present interesting insides into the thermal effects of atmosphereless bodies at large phase angles. The goal is to better understand Mercury, the smallest, most dense and heavily space-weathered planet which undergoes large diurnal surface temperature variations. The data sets will also have great relevance in direct comparison and complementing Bepi-Colombo/MERTIS measurements and their interpretation.
References: Hansen 1974, ApJ 190, 715, Surface temperature and emissivity of Mercury; Sprague et al. 1994, Icarus 190, 156, Mercury: Evidence for Anorthosite and Basalt from Mid-infrared (7.3-13.5 µm) Spectroscopy; Emery et al. 1998, Icarus 136, 104, Mercury: Thermal Modeling and Mid-infrared (5-12 µm) Observations; Sprague et al. 2000, Icarus 147, 421, Mid-Infrared (8.1-12.5 µm) Imaging of Mercury; Nishiyama et al. 2022, EP&S 74, 105, Utilization of a meteorological satellite as a space telescope: the lunar mid-infrared spectrum as seen by Himawari-8; Fulbright et al. 2023, IGARSS 2023, Calibration of GOES-R ABI data using celestial targets“; DOI: 10.1109/IGARSS52108.2023.10282380; Müller et al. 2021, A&A 650, A38, The Moon at thermal infrared wavelengths: a benchmark for asteroid thermal models.
How to cite: Müller, T., Fulbright, J., Nishiyama, G., Burgdorf, M., and Uno, S.: Mercury's thermal phase curve: multi-band mid-infrared observations from geostationary meteorological satellites, Europlanet Science Congress 2024, Berlin, Germany, 8–13 Sep 2024, EPSC2024-764, https://doi.org/10.5194/epsc2024-764, 2024.