- 1Tor Vergata University of Rome, Rome, Italy
- 2IAPS-INAF, Rome, Italy
- 3ISAC-CNR, Rome, Italy
Jupiter’s atmosphere is primarily composed of molecular hydrogen and helium.
Since the atmosphere of this gaseous giant represents a high-density environment, the H2 Collision Induced Absorption (CIA) fundamental band represents one of the main sources of opacity in the infrared part of the spectrum, particularly between 1 and 5 μm, which is a spectral range widely used by remote sensing instruments.
For this reason, it is important to have experimental data on the CIA absorption and to compare them with the theoretical models present in the literature, to have an estimation as accurate as possible of Jupiter’s atmospheric opacity, which represents important information for the already deployed Juno and Juice missions.
Consequently, measurements of the hydrogen CIA fundamental band have been performed in a wide range of temperature and pressure conditions, including the Jovian upper-tropospheric ones.
We performed measurements using a pure H2 gas and an H2-He mixture at typical Jovian concentrations (13.6% of He) and for different mixing ratios.
We used an experimental setup called PASSxS (Planetary Atmosphere Simulation for Spectroscopy) [1], which allows us to record spectra in the spectral range from 1 to 5 μm.
It comprises two stainless steel concentric vessels, as shown in Figure 1. The inner one contains the gaseous mixture under investigation, while the external can be evacuated to ensure thermal insulation of the sample chamber from the external environment.
Moreover, the inner vessel contains a multipass cell coupled with an FT-IR spectrometer. It has been aligned to reach an optical path of 3.27 m. The spectral resolution of the FT-IR ranges from 0.06 to 10 cm-1. For a more detailed description of the experimental setup refer to [1].
Figure 1: a graphical sketch of the PASSxS
Thanks to this experimental setup we obtained some high signal-to-noise ratio measurements in a temperature range that goes from 120K to 500K. Figure 2 shows the experimental binary absorption coefficients for a pure H2 gas in this temperature range. These are the first experimental measurements of the CIA H2 fundamental band at temperatures higher than 300K.
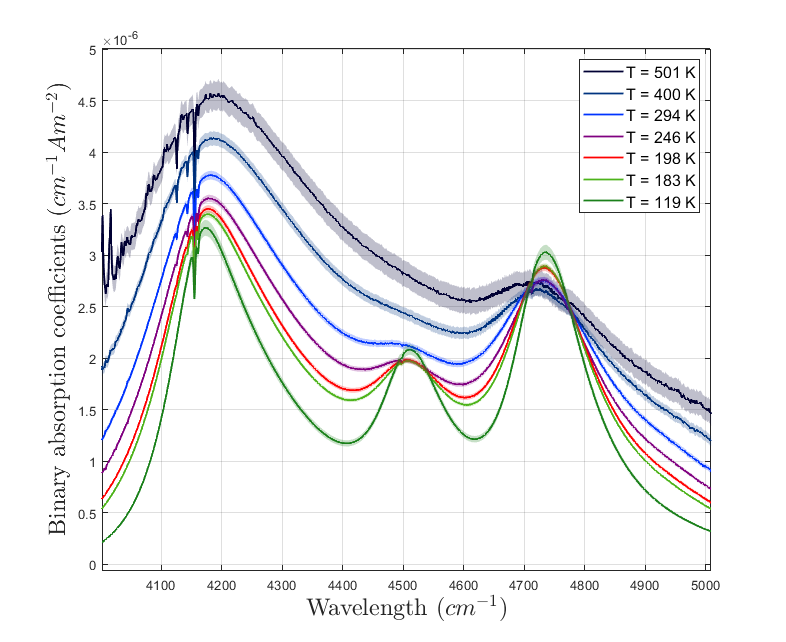
Figure 2: Pure H2 binary absorption coefficients in the [120, 500] K temperature range
Moreover, we studied the H2 CIA fundamental band for an H2-He mixture for various He concentrations, from a minimum of 13.6% of He (Jovian concentration) to a maximum of 90% of He. Figure 3 shows the absorption coefficients obtained for the mixture of interest with a He concentration that goes from 0% (pure H2 case) to 70% at room temperature. The measurements have been taken by inserting an initial H2 pressure of 6 bar, and different He pressures.
As you can see, as the He concentration increases, the peak around 4200 cm-1 becomes more pronounced.
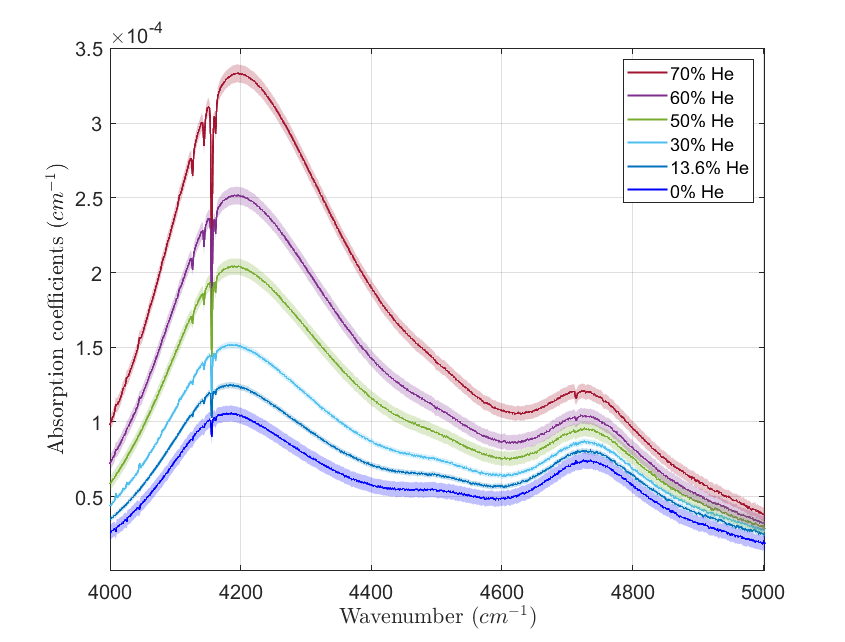
Figure 3: Experimental absorption coefficients at room temperature for an H2-He mixture at different He concentrations, for an initial H2 pressure of 6 bar
Starting from the measurements acquired with the H2-He mixture at a certain temperature, it is also possible to separate the contributions to the total absorption coefficients due to the H2-H2 and the H2-He collisions, which are shown in Figure 4.
This allows us to re-calculate the absorption coefficients for any mixing ratio, and possibly study the opacity in this spectral range of any gaseous planet whose atmosphere is predominantly made of H2 and He.
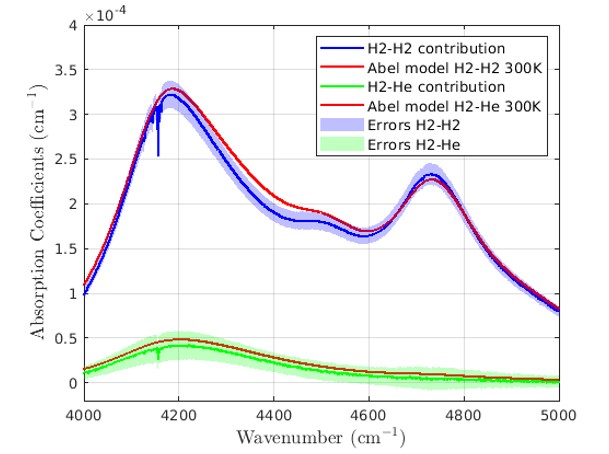
Figure 4: Absorption coefficients at room temperature for the H2-H2 (blue curve) and H2-He (green curve) contributions. The red curves represent Abel's theoretical models [3]
Furthermore, using the typical Jovian He concentration we also performed measurements at three pressure and temperature conditions, chosen along Jupiter’s atmospheric profile shown in Figure 5. The three dots superimposed on the curve represent the chosen set points.
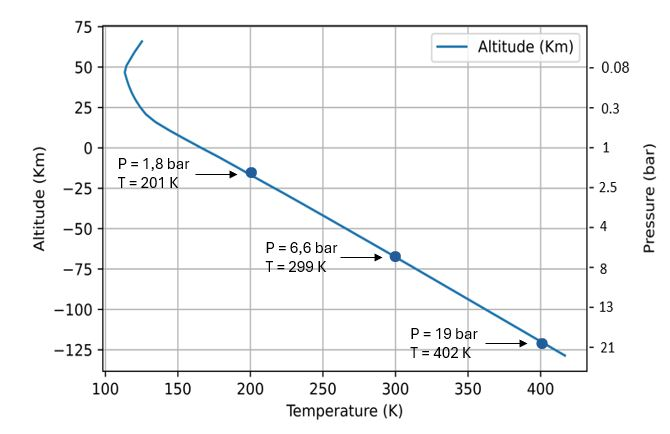
Figure 5: Jovian atmospheric profile [2]
Figure 6 shows the experimental absorption coefficients (blue curve) acquired for an H2-He mixture for typical Jovian concentrations at 402 K and a pressure of 19.2 bar.
The band shows a maximum absorption around 4200 cm-1 where the absorption coefficients reach a value of almost 5.8 10-4 cm-1.
Furthermore, the experimental data have been compared with Abel’s theoretical model [3] shown as the red curve. As one can see, there are some discrepancies between the data and the model, which should be investigated further.
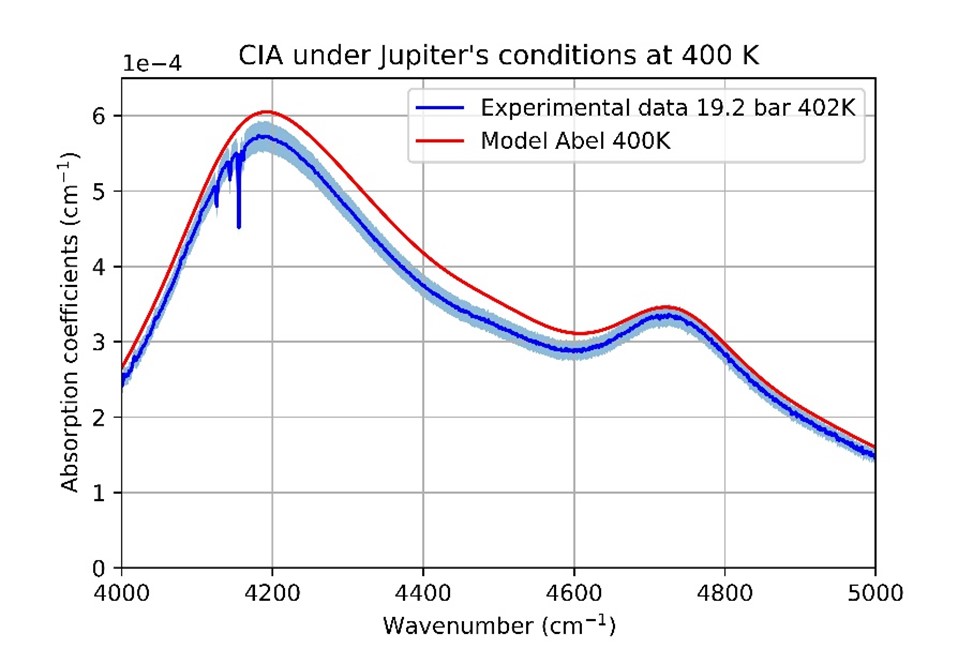
Figure 6: Experimental absorption coefficients (blue curve) at typical Jupiter's upper-tropospheric conditions. The red curve represents Abel’s theoretical model [3]
Looking at the left side of the main peak of the band shown in Figure 6, it is easy to notice the presence of some tiny features called interference dips [4] not reproduced by the theoretical model.
They have been studied by acquiring some high-resolution spectra for a pure H2 gas and an H2-He mixture at room temperature for different pressure conditions.
The interference dips represent a lack of absorption at specific wavelengths.
We managed to resolve all four interference dips observed at the following wavenumbers: 4126 cm-1, 4143 cm-1, 4155 cm-1 and 4161 cm-1.
Acknowledgments: This work has been developed under the ASI-INAF agreement n. 2023-6-HH.0.
References:
[1] M. Snels and al. (2021), AMT 14, 7187–7197, https://doi.org/10.5194/amt-14-7187-2021.
[2] A. Seiff (1997), Science Vol 276, pp.102-104,https://www.science.org/doi/10.1126/science.276.5309.102.
[3] M. Abel et al., (2012), The Journal of Chemical Physics, 136,https://doi.org/10.1063/1.3676405
[4] J. Van Kranendonk (1968), Canadian Journal of Physics Vol. 46, N. 10, https://doi.org/10.1139/p68-150.
How to cite: Vitali, F., Stefani, S., Piccioni, G., Grassi, D., and Snels, M.: Experimental results on the H2-H2 and H2-He collisional-induced absorption coefficients at typical Jupiter’s upper tropospheric conditions. , Europlanet Science Congress 2024, Berlin, Germany, 8–13 Sep 2024, EPSC2024-775, https://doi.org/10.5194/epsc2024-775, 2024.