
 1,2,
1,2,- 1Swedish Institute of Space Physics, Box 812, 98128 Kiruna, Sweden.
- 2Umeå University, Department of Physics, 90187 Umeå, Sweden
- 3University of Bern, CH-3012 Bern, Switzerland.
- 4Physical Research Laboratory, 380009 Ahmedabad, India.
- 5Institute of Space and Astronautical Science, Japan Aerospace Exploration Agency, Sagamihara, 252-5210 Kanagawa, Japan
1. Introduction
Although the Moon lacks a global magnetic field, its crust features small-scale (smaller than a typical proton gyroradius) magnetized regions known as lunar magnetic anomalies [1] (Figure 1a). Their interaction with the solar wind gives rise to unique structures called lunar mini-magnetospheres [2]. These structures are characterized by a partial solar wind cavity surrounded by a region of enhanced precipitating proton flux [3] resulting from the deflection and reflection of protons above the anomaly [4]. As a significant fraction of the solar wind protons which interact with the lunar surface are backscattered as hydrogen ENAs [5], instruments measuring ENA and protons can be used to remotely observe lunar mini-magnetospheres and investigate their effect on the solar wind flow in-situ [6]. This study uses ENA and proton measurements from the Sub-KeV Atom Reflecting Analyzer (SARA) onboard Chandrayaan-1 [7] to examine the structure and dynamics of the magnetosphere-like object formed by the South Pole-Aitken (SPA) magnetic anomaly cluster.
2. Dataset and methods
We produced hydrogen ENA and proton emission maps of the lunar far-side using orbital measurements from the Chandraayan-1 Energetic Neutrals Analyzer (CENA) and Solar Wind Monitor (SWIM) from the SARA instrument. To understand the surface-solar wind interaction, we limited our dataset to CENA/SWIM measurements acquired when Chandraayan-1 was on the lunar day-side and when the Moon was in the solar wind. All measurements contaminated by UV radiations and obtained for off-nadir pointing spacecraft operation modes (>15 deg) were removed. To quantitatively compare emission maps obtained under varying observation geometries and upstream solar wind conditions, the measured hydrogen ENA flux was normalized by the modeled ENA flux that would be observed in the absence of magnetic anomalies. This modeled flux was calculated using the empirical hydrogen ENA scattering function and energy spectra derived previously [8, 9], along with the upstream solar wind parameters measured by the ACE and WIND spacecraft. Similarly, the measured reflected proton flux was normalized by the solar wind proton flux impinging the surface. The obtained normalized emission maps were then classified into high (> 0.6 nPa) and low (< 0.6 nPa) solar wind dynamic pressures (nmu2/2) to examine the influence of this parameter on the structure of the SPA magnetic anomaly cluster.
3. Results
A region of reduced ENA flux is observed above the SPA magnetic anomaly cluster (Figure 1b), suggesting that a large-scale magnetosphere-like object forms above the SPA cluster under all solar wind conditions available in the dataset. Figure 1b also reveals a large ENA-enhanced flux region surrounding the SPA cluster. This feature could result from the deflection of solar wind protons above this object. We also confirm significant proton reflection above the SPA magnetic anomaly cluster (Figure 1c). Local proton reflection rates appear to be correlated with surface magnetic field strengths and ENA flux reduction rates (Figures 1a, b, and c).
Figure 2 shows the proton and ENA emission maps under the high and low solar wind dynamic pressure cases. Figures 2e and 2f suggest that proton reflection rates above magnetic anomalies are anti-correlated with the solar wind dynamic pressure. A comparison of ENA emission maps between the two dynamic pressure cases (Figures 2b and 2c) reveals that the small-scale structures of the SPA magnetic anomaly cluster, as well as its ring-shaped enhanced ENA flux region, are more prominent under low dynamic pressures. However, the size and peak shielding efficiency of the SPA magnetic anomaly cluster do not appear to differ significantly between the high and low dynamic pressure cases. These results suggest that under low solar wind dynamic pressures, the structure of the SPA magnetic anomaly cluster is mainly driven by small-scale crustal field variations. However, under higher dynamic pressures, the magnetic fields of the SPA cluster could be compressed and behave as a coherent obstacle to the solar wind flow.
4. Concluding remarks
ENA and proton observations of the lunar far side reveal that the SPA magnetic anomaly cluster causes large-scale (>1000 km) effects to the solar wind flow. The characteristics of these disturbances imply that the SPA magnetic anomaly cluster forms a large magnetosphere-like object which responds differently to varying upstream solar wind conditions compared to mini-magnetospheres formed by smaller isolated magnetic anomalies. These results suggest that the global effects of the SPA cluster on the solar wind proton precipitation patterns and local characteristics have been underestimated. These findings are critically important for interpreting plasma measurements on lunar landers on the far side, for example, Chang’E-4. How anomalies of small (< 100 km) vertical extent create large (> 1000 km) horizontal structures remains to be explained. Possible mechanisms to be examined involve the setup of large-scale Hall electric fields and the resulting horizontal proton drift.
5. References
[1] Tsunakawa, H. et al. (2015), Journal of Geophysical Research: Planets 120,1160-1185.
[2] Lin, R.P. et al. (1998), Science 281, 1480-1484.
[3] Wieser, M. et al. (2010), Geophysical Research Letters 37.
[4] Lue, C. et al. (2011), Geophysical Research Letters 38.
[5] Wieser, M. et al. (2009), Planetary and Space Science 57, 2132-4.
[6] Vorburger, A. et al. (2013), Journal of Geophysical Research: Space Physics 118, 3937-45.
[7] Barabash, S. et al. (2009), Current Science 96, 526-532.
[8] Vorburger, A. et al. (2012), Journal of Geophysical Research: Space Physics 117.
[9] Futaana, Y. et al. (2012), Journal of Geophysical Research: Space Physics 117, 432-45.
6. Figures
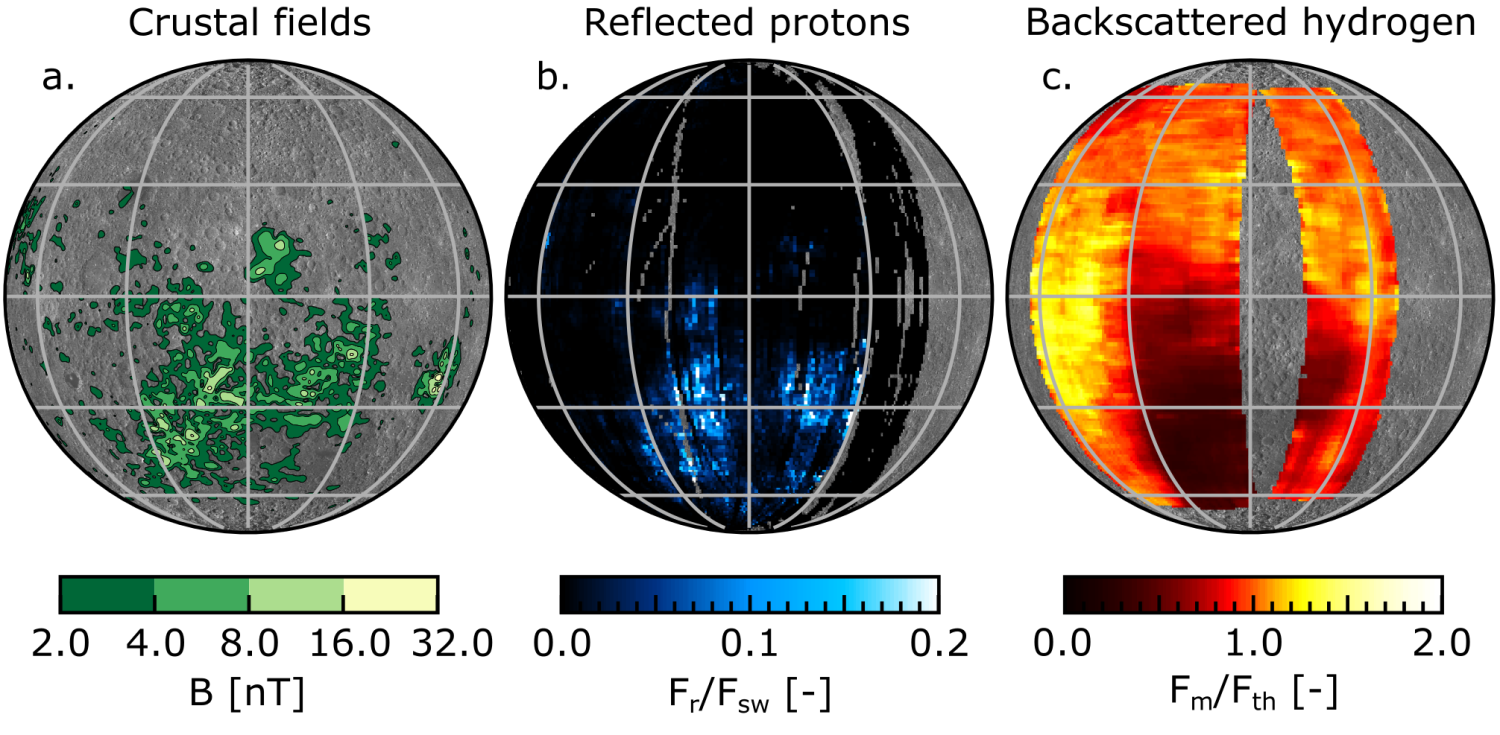
Figure 1: Lunar far-side maps for a) crustal magnetic fields at 30 km altitude from Tsunakawa et al. (2015), b) reflected proton produced by SWIM measurements, and c) ENA emissions produced by CENA measurements. The reflected proton flux is normalized by the incident solar wind proton flux, and the ENA flux by the empirically modelled undisturbed backscattered flux (see text).
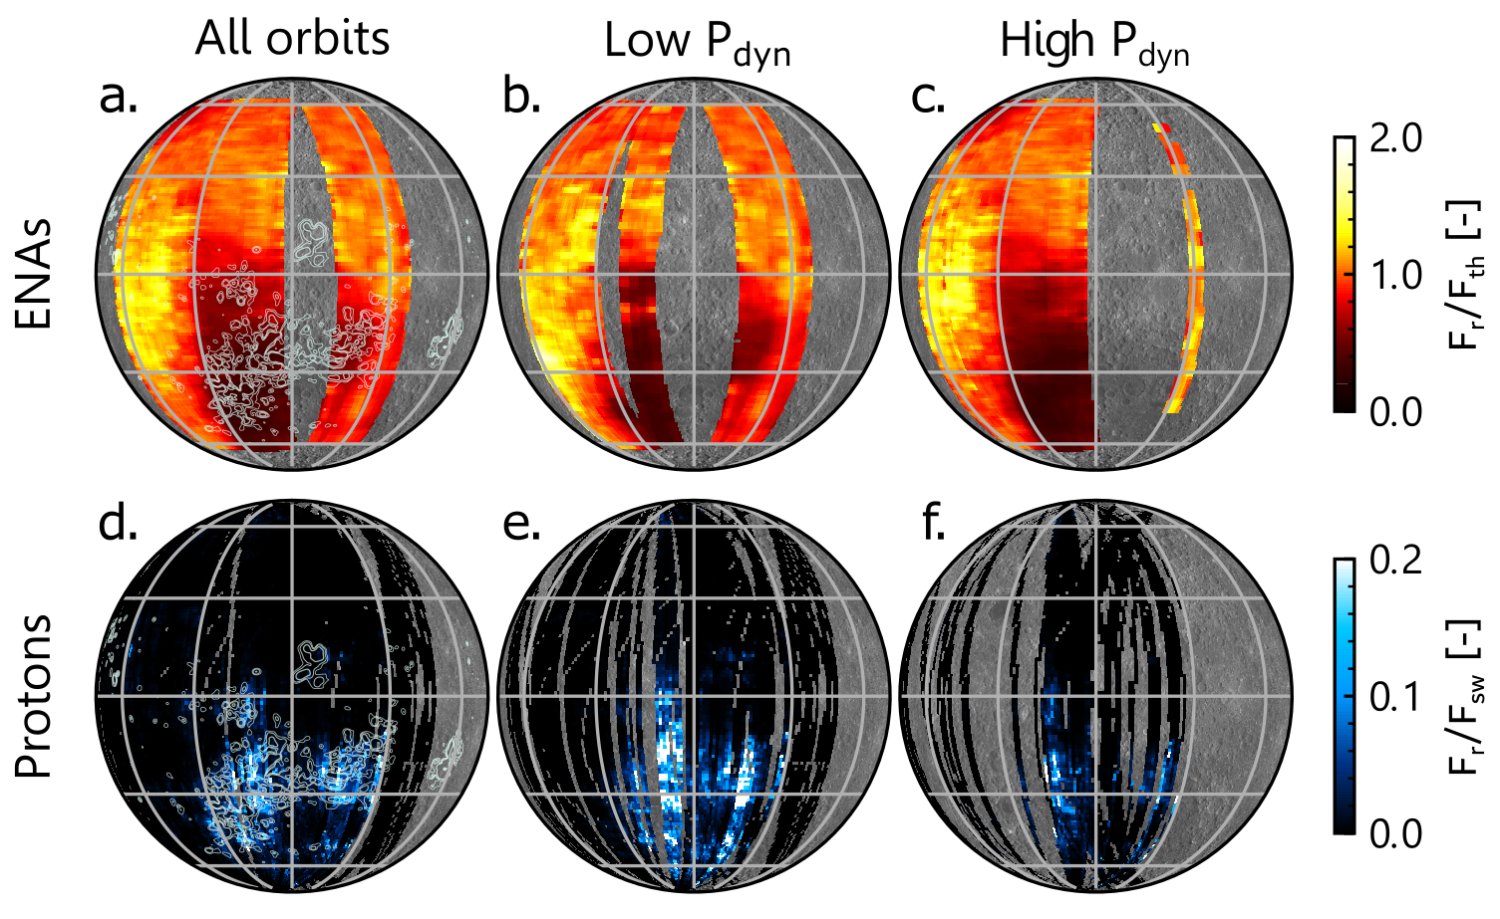
Figure 2: Lunar far side maps of a-c) the backscattered ENA and d-f) reflected protons. The map was produced under different solar wind conditions: using (a, d) all the data and (b, e) the low (<0.6 nPa) and (c, f) high (>0.6 nPa) solar wind dynamic pressure cases.
How to cite: Maynadié, T., Futaana, Y., Barabash, S., Fatemi, S., Wieser, M., Vorburger, A., Bhardwaj, A., Wurz, P., and Asamura, K.: Dynamics and Structure of the South Pole-Aitken Mini-Magnetosphere from Proton and ENA measurements from the SARA Instrument on-board Chandraayan-1, Europlanet Science Congress 2024, Berlin, Germany, 8–13 Sep 2024, EPSC2024-79, https://doi.org/10.5194/epsc2024-79, 2024.