
 1,2,5,1,1,3,4,5,5,3,4,6,7,10
- 1University of Leicester, UK (leigh.fletcher@leicester.ac.uk)
- 2University of Rome La Sapienza, Italy
- 3UC Berkeley, USA
- 4Observatoire de Paris, Meudon, France
- 5INAF – Istituto di Astrofisica e Planetologia Spaziali (INAF-IAPS),Italy
- 6University of Oxford, UK
- 7Jet Propulsion Laboratory, California, USA
- 8University of Wisconsin-Madison, USA
- 9Goddard Spaceflight Center, Maryland, USA
- 10Universidad del País Vasco, UPV/EHU, Bilbao, Spain
We present observations of Jupiter’s atmosphere using JWST’s NIRSpec (Jakobsen+2022, doi:10.1051/0004-6361/202142663) integral field unit (IFU) spectrometer acquired during the first year of scientific operations. Near-infrared spectroscopic mapping provides a key tool for studying giant planet clouds, hazes, and gaseous composition from the cloud-forming weather layer to the radiatively-controlled lower stratosphere. Spectrometers that span the 1-5 µm range provide access to reflected sunlight inside and outside of strong methane bands; ionospheric emission from H3+; and deep thermal emission from an atmospheric ‘window’ near 5 µm (where gaseous absorption is relatively low). The superb spectral sensitivity, spectral resolution (R~2700), and uninterrupted spectral range of NIRSpec/IFU has provided an exquisite dataset for studying the 3D structure of Jupiter’s dynamic atmosphere, with sensitivity to wavelengths that have been previously inaccessible. In this presentation, we compare NIRSpec/IFU spectra to those acquired by the JIRAM instrument (2-5 µm spectrometer) on NASA’s Juno spacecraft (Adriani+2017, doi:10.1007/s11214-014-0094-y), and look ahead to future Jupiter observations by the MAJIS instrument on JUICE (Poulet+2024, doi:10.1007/s11214-024-01057-2).
JWST Observations: We used the NIRSpec/IFU instrument to acquire spatially-resolved spectral maps of Jupiter across a 3x3” field-of-view (FOV), using mosaicking to ensure wide spatial coverage. Two gratings were used at high spectral resolution (R~2700, G235H and G395H) to span the 1.8-5.3 µm range. While the small NIRSpec FOV precludes global mapping of Jupiter, representative regions of the atmosphere can be explored by combining multiple datasets. As part of early-release science (ERS, PIs: de Pater & Fouchet) programme 1373, six mosaic tiles were used to map the Great Red Spot on 2022-07-27 using both gratings; six G395H (2.8-5.3 µm) tiles and three G235H tiles (1.8-3.2 µm) were used to map Jupiter’s South Polar domain on 2022-12-27. Data were reduced and navigated using the JWST pipeline and custom Solar System processing (King+2023, doi:10.3847/2515-5172/ad045f), mitigating the effects of saturation in reflectivity peaks near ~2 µm and strong thermal emission at 5 µm by subdividing long integrations into shorter durations (known as groups). Emission features from H3+ and CH4 fluorescence were identified in the data (Melin+2024) and removed to enable fitting of the neutral atmosphere.
Great Red Spot: JWST captured the GRS in July 2022 in a relatively quiescent state (Fig. 1), with fine tendrils of material (reddish in visible light) forming an anticlockwise spiral at the edge of the vortex, and cloud-free lanes of low reflectivity and bright thermal emission surrounding both the red anticyclone and the reflective aerosols of the GRS hollow. Intriguingly, reflectivity maps between 3.0 and 4.5 µm (sounding upper-tropospheric aerosols) show a series of concentric ovals, forming lanes around the centre of the GRS, with the most reflective in the centre where wind speeds are lowest (and sometimes there is a counter-rotating cyclonic core). A combination of principal component analysis (PCA) and Gaussian Mixture Models (GMM) was used to identify self-similar NIRSpec spectra (Biagiotti+2024, doi:10.5194/egusphere-egu24-12950), forming clusters for subsequent spectral inversion with NEMESIS to derive aerosol properties and gaseous abundances. The clustering naturally identified the different spectra in the dark cloud-free regions; the whitish aerosols of the GRS hollow; and the red-orange aerosols of the GRS. A persistent cluster defines the edge or halo of the GRS, showing a spectrum that is distinct from the GRS interior. We repeated the same analysis on Juno/JIRAM spectra of the GRS acquired during Juno’s first perijove (2016-08-27, Grassi+2021, doi:10.1093/mnras/stab740), albeit with lower spectral resolution and coarser coverage of the JIRAM spectrometer. The same clusters were identified, and the same persistent halo. The halo may be associated with the mixture of red chromophores and the underlying background clouds. The clusters show considerable difference in the shape of the 2.6-2.8 µm reflectivity peak, indicating the presence of different cloud and haze properties (compositions, particle sizes, altitude distributions, etc.) in the different clusters. Clusters closer to the GRS centre appear to have a distinct 2.7-µm reflectivity peak that is spectrally broader with enhanced reflection out beyond 3.0 µm. Inversions varying the properties of the upper haze, deeper clouds, and abundances of ammonia and phosphine will be presented to determine the origin of the concentric lanes within the GRS. Results will be compared to previous near-IR studies from Galileo/NIMS (Baines+2002, doi:10.1006/icar.2002.6901) and ground-based observations (Bjoraker+2018, doi:10.3847/1538-3881/aad186).
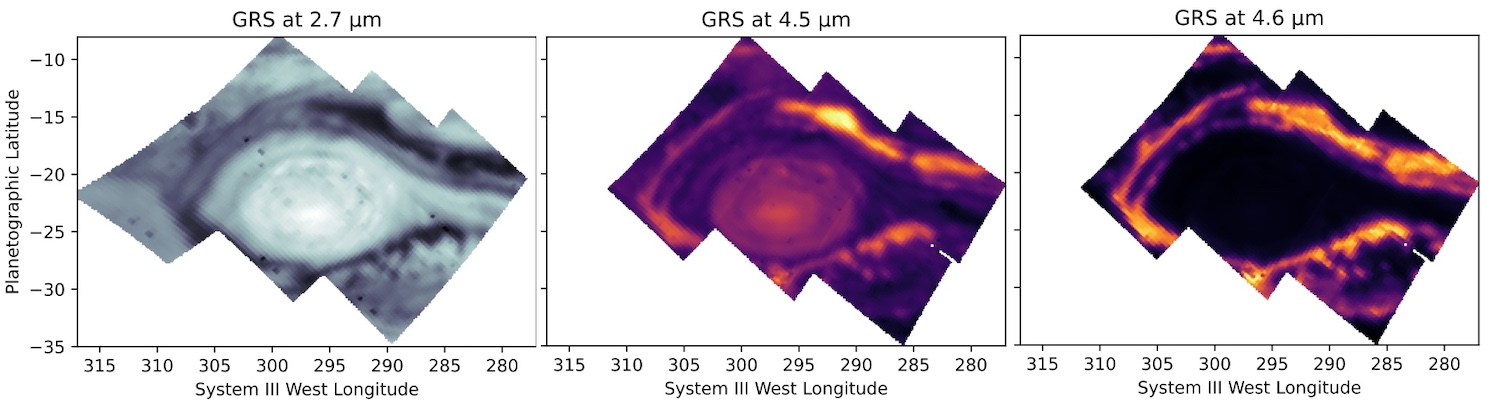
Figure 1 Jupiter's Great Red Spot observed by NIRpec at three wavelengths: 2.7 µm (reflection from deep clouds); 4.5 µm (combined reflection and thermal emission); and 4.6 µm (deep thermal emission).
South Polar Domain: The December-2022 mosaic spans approximately 100o longitude (centred on ~20oW) and 50-90oS, with clearly-identifiable transitions in reflectivity and thermal emission associated with the edge of the South Polar Hood (SPH, 68oS graphic); a low-reflectivity band (62-68oS between prograde jets S5 and S6); and reflective bands between 50-60oS with numerous small cyclones and anticyclonic ovals between the S4 and S5 jets. Folded Filamentary Regions (FFRs) are observed in a band at the edge of the SPH (68-73oS, Rogers+2022, doi:10.1016/j.icarus.2021.114742), appearing dark at 5 µm, but the spatial sampling of the NIRSpec/IFU spaxels is insufficient to resolve details of the edges of the circumpolar cyclones (CPCs). H3+ emission clearly traces the outline of the southern auroral oval. Zonal averages of the southern mosaic will be used to explore changes in aerosol properties and composition across the edge of the SPH. Juno/JIRAM acquired a high-resolution M-band map of Jupiter’s south polar domain 9 days earlier (2022-12-15, perijove 47), allowing us to explore the longevity of the features in this longitude range. The entire south polar domain is bright at 5 µm (i.e., thinner clouds, despite the reflective small-particle hazes of the SPH), punctuated by the darker (cloudier) FFRs and CPCs.
Acknowledgements: JIRAM is funded by ASI–INAF Agreement 2016-23-H.3-2023.
How to cite: Fletcher, L. N., Biagiotti, F., King, O. R. T., Roman, M. T., Melin, H., Harkett, J., de Pater, I., Fouchet, T., Mura, A., Grassi, D., Piccioni, G., Wong, M., Rodríguez-Ovalle, P., Irwin, P., Orton, G., Fry, P., Bjoraker, G., and Hueso, R.: Structure of Jupiter's Great Red Spot and South Polar Domain from JWST/NIRSpec and Juno/JIRAM, Europlanet Science Congress 2024, Berlin, Germany, 8–13 Sep 2024, EPSC2024-801, https://doi.org/10.5194/epsc2024-801, 2024.